. 2019 Oct 15;30(22):2771-2789.
doi: 10.1091/mbc.E19-03-0156. Epub 2019 Sep 11.

Inhibition of spindle extension through the yeast S phase checkpoint is coupled to replication fork stability and the integrity of centromeric DNA

Affiliations

Inhibition of spindle extension through the yeast S phase checkpoint is coupled to replication fork stability and the integrity of centromeric DNA

Jeff Julius et al. Mol Biol Cell. .

Abstract

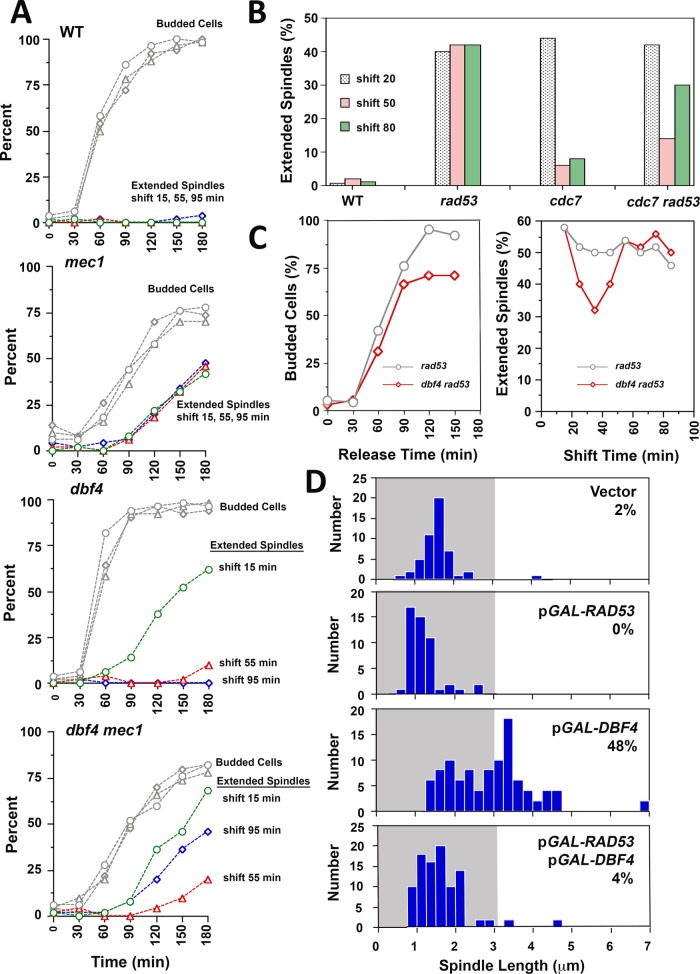
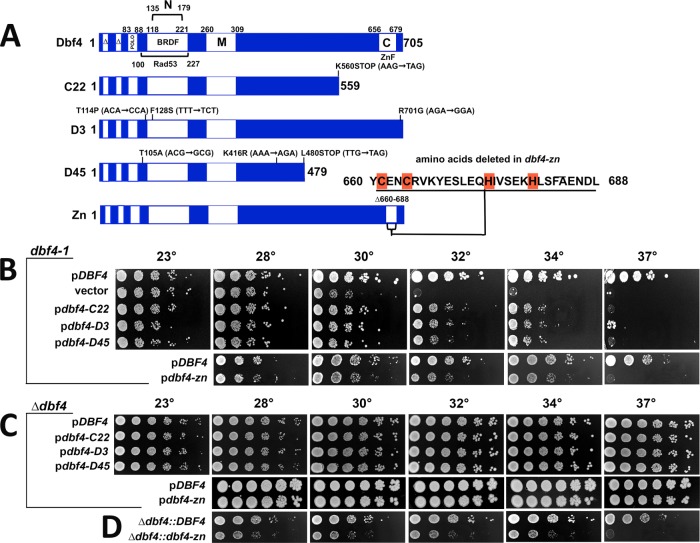
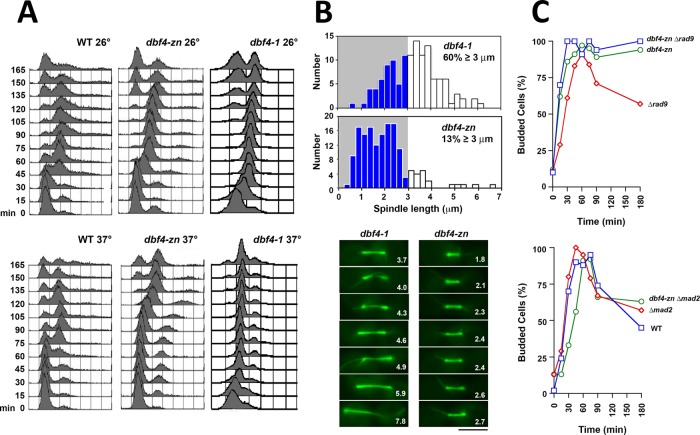
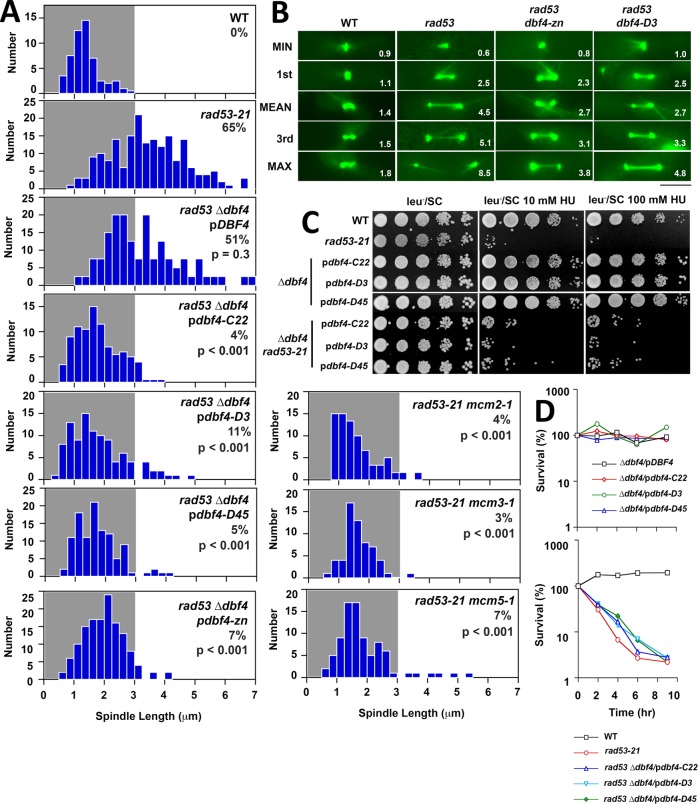
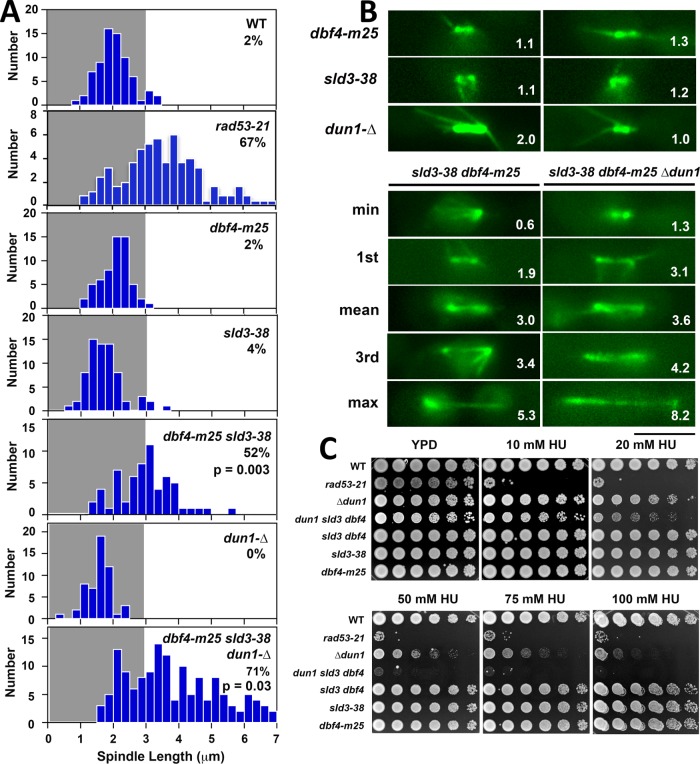
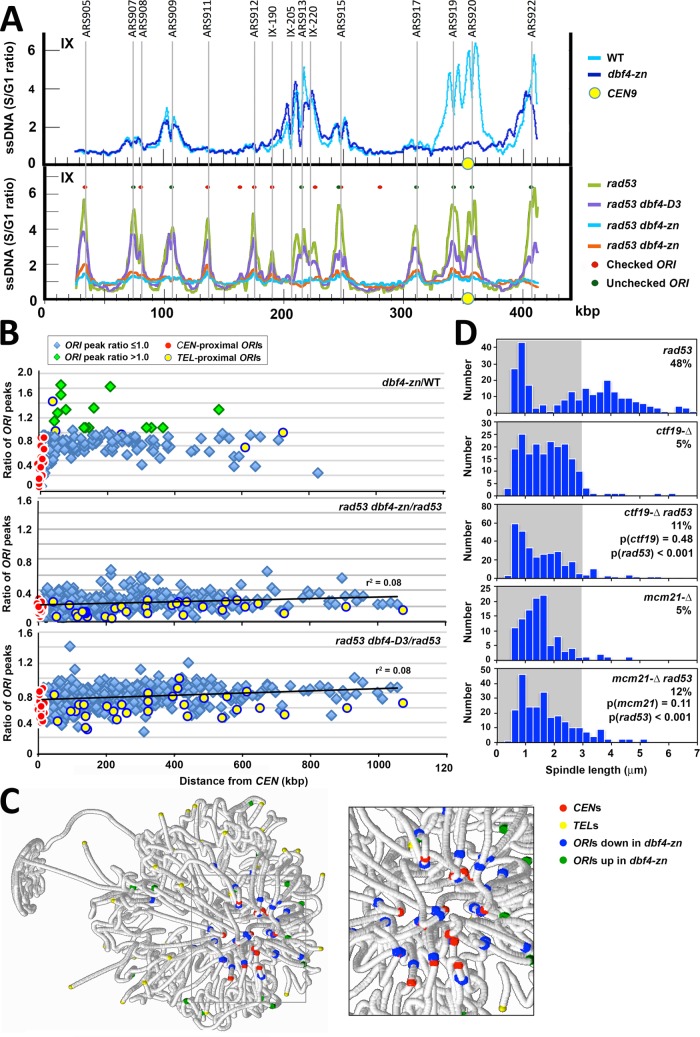
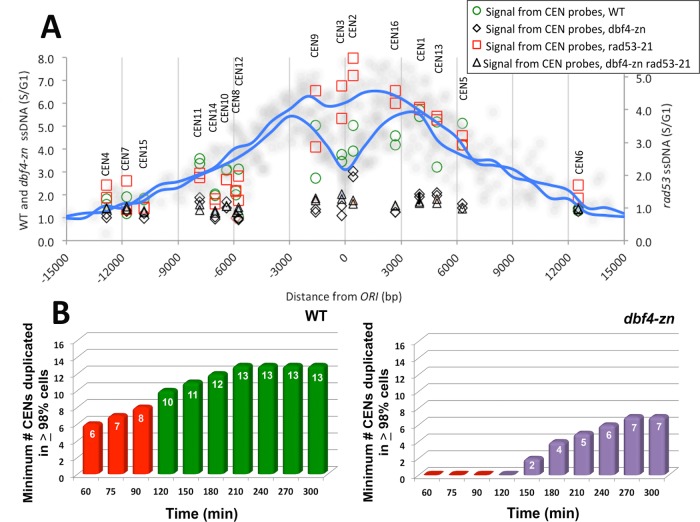
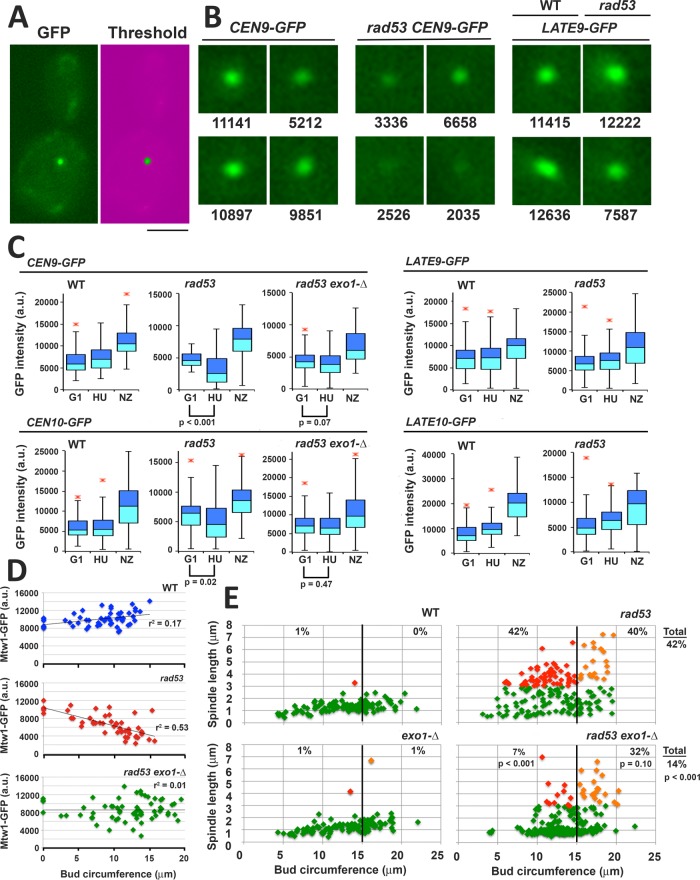
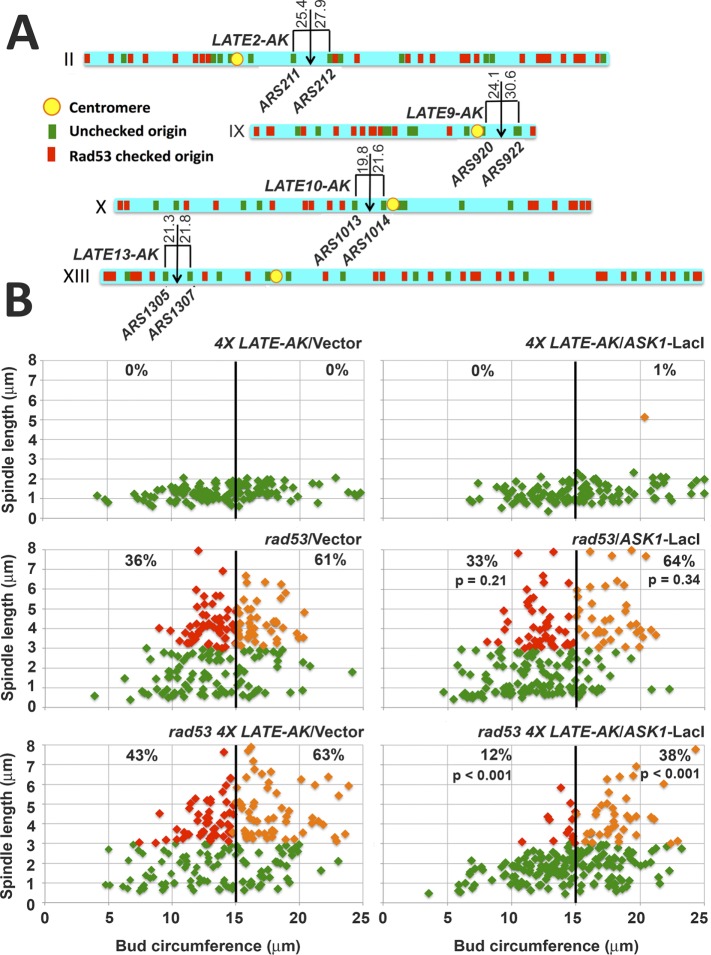
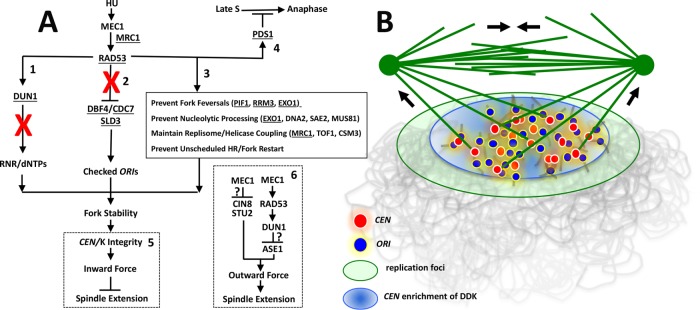
Budding yeast treated with hydroxyurea (HU) activate the S phase checkpoint kinase Rad53, which prevents DNA replication forks from undergoing aberrant structural transitions and nuclease processing. Rad53 is also required to prevent premature extension of the mitotic spindle that assembles during a HU-extended S phase. Here we present evidence that checkpoint restraint of spindle extension is directly coupled to Rad53 control of replication fork stability. In budding yeast, centromeres are flanked by replication origins that fire in early S phase. Mutations affecting the Zn2+-finger of Dbf4, an origin activator, preferentially reduce centromere-proximal origin firing in HU, corresponding with suppression of rad53 spindle extension. Inactivating Exo1 nuclease or displacing centromeres from origins provides a similar suppression. Conversely, short-circuiting Rad53 targeting of Dbf4, Sld3, and Dun1, substrates contributing to fork stability, induces spindle extension. These results reveal spindle extension in HU-treated rad53 mutants is a consequence of replication fork catastrophes at centromeres. When such catastrophes occur, centromeres become susceptible to nucleases, disrupting kinetochore function and spindle force balancing mechanisms. At the same time, our data indicate centromere duplication is not required to stabilize S phase spindle structure, leading us to propose a model for how monopolar kinetochore-spindle attachments may contribute to spindle force balance in HU.


Figures

FIGURE 1:
FIGURE 1:
DDK temperature-sensitive alleles reduce spindle extension in S phase checkpoint mutants. (A) WT (Y300), mec1-21 (AY201), dbf4-1 (JBY999), and mec1-21 dbf4-1 (JBY927) strains were released from G1 at 25°C in 200 mM HU media. At 15, 55, or 95 min after G1 release, cultures were shifted to a nonpermissive temperature of 34°C. At times indicated on the x-axis, aliquots were processed for α-tubulin immunofluorescence and DAPI staining. Spindle extension was reduced in mec1-21 dbf4-1 cells shifted at 55 min. (B) WT (Y300), rad53-21 (Y301), cdc7-1 (DES956), and rad53-21 cdc7-1 (DES960) were released into 200 mM HU media as in A and were shifted to 35°C at 20, 50, and 80 min. After a total of 180 min following G1 release, cells were processed for α-tubulin immunofluorescence and DAPI. As with mec1-21 dbf4-1 cells, rad53-21 cdc7-1 cells displayed reduced spindle extension when shifted at 50 min. (C) To more closely bracket the window for suppression of spindle extension, rad53-21 (Y301) and rad53-21 dbf4-1 (JBY1002) strains were released from G1 into 200 mM HU at 25°C and then split into parallel cultures, which were then shifted to 34°C at the indicated times on the x-axis of the right-hand graph (shift time). Aliquots were maintained at 25°C to monitor cell budding (left graph). Spindle extension was evaluated in temperature-shifted samples at 150 min post-G1 release using DAPI and α-tubulin immunofluorescence (right graph). Maximal suppression of spindle extension was observed when rad53-21 dbf4-1 cells were shifted at 40 min, corresponding with bud emergence and S phase entry. (D) SPC42-GFP cells (JBY1129) were transformed with vector (JBY1285), a low copy plasmid expressing RAD53 under control of the inducible GAL promoter (pCEN HIS3 GAL-RAD53, JBY1286), a high copy pGAL-DBF4 plasmid (p2μm URA3 GAL-DBF4; JBY1287), or cotransformed with both plasmids (JBY1288). Transformants were arrested in G1 for 3.5 h in galactose media (YPGAL) to induce RAD53 and/or DBF4. Cells were then released into YPGAL containing 200 mM HU. After 3.5 h, spindle extension was evaluated using Spc42-GFP.
FIGURE 2:
FIGURE 2:
Characterization of dbf4-C and dbf4-zn. Experiments in this figure are without HU treatment. (A) Dbf4 domains and mutant alleles. C22, D3, and D45 are PCR mutagenized alleles, while dbf4-zn was constructed using recombinant techniques. Base pair changes that alter amino acid coding in dbf4-C alleles are indicated; Zn2+ finger amino acids deleted in dbf4-zn are also shown. The diagram also illustrates amino acid boundaries for domains involved in cell cycle proteolysis (∆); Cdc5 (Polo) and Rad53 binding; motifs N, M, and C; and the BRCT-related BFDF domain. (B) Complementation of dbf4-1; 10-fold serial dilutions of a dbf4-1 strain (JBY997) transformed with low copy pCEN ARS DBF4 (JJY059; JJY164), vector (JJY016), pdbf4-C22 (JJY017), pdbf4-D3 (JJY060), pdbf4-D45 (JJY061), and pdbf4-zn (JJY165) plasmids were stamped onto selective media at indicated temperatures. Whereas DBF4 complements dbf4-1 to 37°C, dbf4-C and dbf4-zn alleles partially complement to 34°C. (C) Complementation of dbf4-∆. A dbf4-∆ strain harboring pURA3 DBF4 was transformed with pCEN ARS DBF4 (JJY037, JJY166), pdbf4-C22 (JJY032), pdbf4-D3 (JJY033), pdbf4-D45 (JJY044), and pdbf4-zn (JJY167). The transformants were cured of the covering DBF4 URA3 plasmid on 5′-FOA; 10-fold serial dilutions were stamped onto selective media at indicated temperatures. In this case, low copy dbf4-C and dbf4-zn plasmids complement dbf4-∆ growth to 37°C. (D) Integrated dbf4-zn. Constructs expressing DBF4 (JJY046) or dbf4-zn (JJY076) were integrated immediately upstream of a precise deletion of the DBF4 open reading frame; 10-fold serial dilutions were incubated at indicated temperatures revealing a dbf4-zn temperature sensitive growth phenotype.
FIGURE 3:
FIGURE 3:
dbf4-zn does not undergo a reductional anaphase. Experiments in this figure are without HU treatment. (A) FACs. WT (CRY1), dbf4-1 (JBY999), or dbf4-zn expressed from the native locus (JJY076) strains were arrested in G1, released at 26°C or 37°C, and analyzed by FACs. dbf4-zn shows an ∼15 min S phase delay compared with WT at 26°C and an ∼45–60 min delay at 37°C. (B) Top graphs: a dbf4-1 SPC42-GFP strain (JBY1392) and a strain expressing SPC42-GFP and integrated dbf4-zn (JJY045) were released from G1 at 37°C. After 2 h, spindle length distributions were determined using Spc42-GFP. Bottom micrographs: dbf4-1 (JBY2323) and integrated dbf4-zn (JBY2324) cells expressing GFP-TUB1 were released from G1 at 37°C. After 2 h spindles were visualized at 37°C. Numbers, spindle length in μm; bar, 4 μm. Whereas dbf4-1 exhibits reductional anaphase spindle extension, dbf4-zn arrests with normal length preanaphase spindles. (C) The dbf4-zn cell cycle arrest. Top graph: rad9-∆ (JBY186), integrated dbf4-zn (JJY076) and integrated dbf4-zn rad9-∆ (JJY080) double mutants were released from G1 at 37°C, and budding was used to evaluate cell cycle progression. Bottom graph: WT (CRY1), mad2-∆ (JBY546), and integrated dbf4-zn mad2-∆ (JJY102) strains were analyzed similarly. As with dbf4-1, dbf4-zn cell cycle arrest is dependent on Mad2 but not Rad9.
FIGURE 4:
FIGURE 4:
pdbf4 C, pdbf4-zn and mcm alleles suppress rad53 spindle extension in HU. (A) WT (JBY1129), rad53-21 (JBY1274), rad53-21 dbf4-∆/pDBF4 (JJY184), rad53-21 dbf4-∆/pdbf4-C22 (JJY028), rad53-21 dbf4-∆/pdbf4-D3 (JJY029), rad53-21 dbf4-∆/pdbf4-D45 (JJY030), rad53-21 dbf4-∆/pdbf4-zn (JJY182), rad53-21 mcm2-1 (JJY112), rad53-21 mcm3-1 (JJY117), and rad53-21 mcm5-1 (JJY120) strains, all harboring SPC42-GFP, were released from G1 into 200 mM HU at 30°C. After 90 min spindle lengths were measured in fixed cells. Percentages of cells with spindles ≥3 μm are displayed, along with the results of two-tailed t tests comparing each mutant to the rad53-21 distribution. (B) WT (JBY1129), rad53-21 (JBY1274), rad53-21 dbf4-∆/pdbf4-zn (rad53 dbf4-zn on the figure; JJY182), and rad53-21 dbf4-∆/pdbf4-D3 (rad53 dbf4-D3 on the figure; JJY029) strains were transformed with pGFP-TUB1 to visualize MTs. Cells were released from G1 into 200 mM HU at 30°C. Starting at 90 min, spindles were imaged and measured (values at the bottom right of each panel) in 50 live cells. Spindles corresponding to minimum, maximum, mean, first, and third quadrant measurements are shown. Bar, 4 μm. (C) Tenfold serial dilutions of WT (JBY1129), rad53-21 (JBY1274), dbf4-∆/pDBF4 (JJY037), dbf4-∆/pdbf4-C22 (JJY032), dbf4-∆/pdbf4-D3 (JJY033), and dbf4-∆/pdbf4-D45 (JJY044) strains, along with rad53-21 dbf4-∆ transformants described in A were stamped on indicated media at 30°C to evaluate HU sensitivity. (D) Asynchronous cultures of all the strains described in C were shifted into media containing 200 mM HU at 30°C. At the indicated times, plating efficiency was determined to evaluate HU recovery.
FIGURE 5:
FIGURE 5:
Dbf4 and Sld3 are Rad53 substrates controlling the block to spindle extension. (A) WT (CRY1), rad53-21 (Y301), dbf4-m25 (YJLO157), sld3-38A (YJLO156), dbf4-m25 sld3-38A (YJLO155, JBY2334), dun1-∆ (MY26), and dbf4-m25 sld3-38A dun1-∆ (JJY141, JJY144) strains were arrested in G1 and released into 200 mM HU at 30°C. After 90 min, samples were processed for α-tubulin immunofluorescence, and spindle lengths were measured. The percentage of cells with spindles ≥3 μm is shown, along with p values (two-tailed t test) comparing the sld3-38A dbf4-m25 and sld3-38A dbf4-m25 dun1-∆ distributions to rad53-21. (B) Strains in A were transformed with pGFP-TUB1, arrested in G1, released into 200 mM HU at 30°C, and spindles were imaged and measured in live cells. Representative spindles are shown for dbf4-m25, sld3-38A, and dun1-∆ single mutants, along with spindles corresponding to minimum, maximum, mean, first, and third quadrant measurements from the sld3-38A dbf4-m25 and sld3-38A dbf4-m25 dun1-∆ populations. Numbers in panels, spindle length in μm; bar, 4 μm. (C) Tenfold serial dilutions of strains in A were stamped onto indicated media to evaluate HU sensitivity.
FIGURE 6:
FIGURE 6:
ORI firing in HU-treated pdbf4-zn and rad53 pdbf4-zn mutants. dbf4-∆/pDBF4 (WT on figure; JJY108), dbf4-∆/pdbf4-zn (dbf4-zn on the figure; JJY181), rad53-21 dbf4-∆/pDBF4 (rad53 on the figure; JJY023), rad53-21 dbf4-∆/pdbf4-zn (rad53 dbf4-zn on the figure; JJY182), and rad53-21 dbf4-∆/pdbf4-D3 (rad53 dbf4-D3 on the figure; JJY029) strains were arrested in G1. The cultures were split with aliquots either released into 200 mM HU at 30°C or retained at the G1 block. After 60 min, ssDNA replication intermediates were isolated from G1 and HU-treated samples and hybridized to microarrays. The ratio of S phase (HU) to G1 hybridization values (S/G1 ratio) was determined at each array position. (A) Replication profiles for chromosome IX showing reduced firing of CEN-flanking ARS919 and ARS920 in pdbf4-zn (top profile) and more uniformly reduced ORI utilization in rad53-21 pdbf4-zn and rad53-21 pdbf4-D3 (bottom profile). (B) ORI AUCs were calculated for 177 ORI peaks in pDBF4 (WT) and pdbf4-zn strains treated with HU and 403 ORI peaks in rad53-21 pDBF4 (rad53) and rad53 pdbf4 strains treated with HU. The ratios of the pdbf4-zn to WT ORI AUCs, the rad53 pdbf4-zn to rad53 ORI AUCs, and the rad53 pdbf4-D3 to rad53 ORI AUCs (ratio of ORI peaks, y-axis) were plotted as a function of ORI distance to the CEN. CEN flanking ORIs, red circles; TEL proximal ORIs, yellow circles; ORIs with ORI AUC ratios ≥1.0, green diamonds. Regression lines are shown for rad53 plots. (C) pdbf4-zn ORIs decreased (blue) or increased (green) by ≥3 SD from the median difference between pdbf4-zn and pDBF4 peak amplitude values are highlighted (RasMol) on a spatial map of the yeast nucleus (see also Supplemental Table S3). Positions of CENs (red) and TELs (yellow) are also shown. Down-regulated ORIs in HU-treated pdbf4-zn cells tend to be located in close proximity to the CEN/SPB cluster, while up-regulated ORIs are often located somewhat more distally (inset). (D) The rad53-21 (JBY2274), ctf19-∆ (JBY2250), ctf19-∆ rad53-21 (JBY2251), mcm21-∆ (JBY2327), and mcm21-∆ rad53-21 (JBY2330) SPC42-GFP strains were released from G1 into 200 mM HU at 30°C. Spindle lengths were measured after 90 min. Percentages of cells with spindles ≥3 μm are shown, along with p values (two-tailed t test) for indicated comparisons.
FIGURE 7:
FIGURE 7:
Analysis of CEN ssDNA and CEN duplication in HU. (A) Using the HU replication profiles described in Figure 6, the closest ORI to each CEN was identified (see also Supplemental Figure S4B; Supplemental Tables S1 and S2). S/G1 ssDNA values spanning these 16 ORIs were determined at 1000-base-pair intervals from the ORI center. The average value at each position was used to plot a composite replication profile for the dbf4-∆/pDBF4 (WT on the y-axis) and rad53-21 dbf4-∆/pDBF4 (rad53 on the y-axis) data sets (blue lines). Data points from each of the 16 individual profiles are also shown (soft gray circles). The split peak characteristic of the WT composite reflects the average extent of bidirectional replication fork movement, while the rad53 composite appears as a more uniform peak due to accumulation of aberrant ssDNA. Genome arrays used in these experiments have two positions overlapping each CEN DNA element. G1/S ssDNA values for these positions were extracted from the dbf4-∆/pDBF4 (WT, green circles), dbf4-∆/pdbf4-zn (dbf4-zn; black diamonds), rad53-21 dbf4-∆/pDBF4 (rad53-21, red squares), and rad53-21 dbf4-∆/pdbf4-zn (dbf4-zn rad53-21; black triangles) data sets and superimposed on the composite profiles to compare the extent of CEN ssDNA in each strain. The relative position of each CEN from the center of the composite is shown at the top of the graph. (B) Statistical projections for CEN duplication in HU were computed as described in the Supplemental Results. The simulation spans a 60–300 min period following G1 release into 200 mM HU. The contributions of 45 CEN-proximal ORIs to CEN duplication are included. Graphs display the minimum number of CENs predicted to be duplicated in ≥ 98% of the cell population at the indicated times for dbf4-∆/pDBF4 (WT) and dbf4-∆/pdbf4-zn (dbf4-zn). Red columns (60–90 min) denote the period in which the spindle forms in HU. Extending the simulation allows the kinetics and maximal extent of CEN duplication to be evaluated.
FIGURE 8:
FIGURE 8:
Exo1 is a determinant of CEN/K integrity and spindle extension in HU-treated rad53 mutants. Strains harboring the indicated GFP chromosome tags were released from G1 into media containing 200 mM HU or with 15 μg/ml NZ at 30°C: CEN9-GFP (WT, JBY2283; rad53-21, JBY2295; exo1-∆ rad53-21, JBY2299); CEN10-GFP (WT, JBY2297; rad53-21, JBY2298; exo1-∆ rad53-21, JBY2301); LATE9-GFP (WT, JBY2289; rad53-21, JBY2290); LATE10-GFP (WT, JBY2291; rad53-21, JBY2293). Cells were processed for microscopy after 90 min. (A) Example of low-end mask to threshold GFP signal. Bar, 4 μm. (B) Representative CEN9-GFP and LATE9-GFP foci in HU-treated cells, with corresponding intensity values (arbitrary units). (C) Box plots of GFP tag intensities in G1, HU, and NZ arrested cells. At least 50 cells were analyzed for G1 and NZ samples; 100 cells were analyzed for HU samples. The p values (two-tailed t test) are provided in cases where the signal intensity of the HU sample is reduced compared with the G1 sample. (D) WT (JBY2252), rad53-21 (JBY2253), and exo1-∆ rad53-21 (JBY2264) MTW1-GFP strains were released from G1 into media containing both HU and NZ at 30°C. NZ was included so that Ks were not dispersed by spindle extension, facilitating quantification of Mtw1-GFP. After 90 min, live cell mounts were analyzed for Mtw1-GFP intensity. Bud circumference was measured as a proxy for time post-G1 release. Cells that did not leave the G1 block were scored to provide a signal baseline. Regression lines and fit estimates are indicated. (E) WT (JBY1129), rad53-21 (JBY1274), exo1-∆ (JBY2246), and exo1-∆ rad53-21 (JBY2303) SPC42-GFP strains were treated with HU as in A and evaluated for bud circumference and spindle length. Color coding: cells with spindles <3 μm, green; cells with spindles ≥3 μm and bud circumferences <15 μm (small to medium budded cells), red; cells with spindles ≥3 μm and buds ≥15 μm (medium to large budded cells), orange. The percentages of small/medium and medium/large budded cells with extended spindles are shown on the corresponding regions of the graphs. The total percentage rad53 and rad53 exo1 cells with extended spindles is shown on the right-hand side of the graphs. The p values (two-tailed t tests) compare differences in spindle extension between the rad53 and rad53 exo1 data sets.
FIGURE 9:
FIGURE 9:
AKs at late replicating sites offset rad53 spindle extension in HU. (A) AK insertion sites on chromosomes 2, 9, 10, and 13 are illustrated by downward arrows. Distances to flanking ORIs (kbp), as well as positions of unchecked ORIs (green), checked ORIs (red) and CENs (yellow) are indicated. (B) RAD53 SPC42-GFP (JBY2271) and rad53-21 SP42-GFP (JBY2273) strains harboring all four LATE-AK insertions (4X LATE-AK) were transformed with a vector control or a plasmid expressing ASK1-LacI to activate synthetic K activity. A rad53-21 SPC42-GFP strain (JBY1274) lacking 4X LATE-AK was similarly transformed. Small colonies emerging on transformation plates were resuspended in liquid media, arrested in G1, and released into 200 mM HU. After 90 min, cells were analyzed for bud circumference and spindle length. Color scheme for graphs is as described for Figure 8E. The percentages of small/medium and medium/large budded cells with extended spindles are shown in the corresponding regions of the graphs. The p values (two-tailed t tests) compare spindle extension in rad53/pASK1-LacI and rad53 4X LATE-AK/pASK1-LacI transformed samples with corresponding vector controls.
FIGURE 10:
FIGURE 10:
Organization and mechanism of the S phase checkpoint block to spindle extension. (A) Checkpoint organization. Six effector pathways relevant to this work are depicted. Rad53 substrates are underlined. See main text for relevant citations. (1) Rad53 activation of Dun1 controls expansion of dNTP pools through transcriptional and posttranslational regulation of RNR. (2) Rad53 inhibition of Dbf4 and Sld3 blocks firing of checked ORIs. (3) Rad53 acts directly at replication forks (box) to maintain fork structure. Pathways 1–3 work synergistically to ensure fork progression during replication stress. (4) Rad53 controls a Pds1-dependent cell cycle arrest response that becomes operative in late S phase. (5) We propose the role of Rad53 in stabilizing forks ensures early-replicating CEN regions are not subjected to nucleolytic degradation, preserving CEN/K integrity and chromosome attachment to the spindle. These attachments generate inward force to restrain spindle extension. (6) Checkpoint regulators also appear to work through additional pathways to down-regulate outward-directed spindle force. Question marks indicate how the checkpoint mediates these responses is not yet clear. Red Xs in 1 and 2 indicate responses crippled downstream of Rad53 in a dun1-∆ dbf4-m25 sld3-38A mutant. (B) Proposed S phase spindle structure. DDK activation of ORI firing leads to incorporation of CEN proximal ORIs (blue) and CENs (red) into replication foci (green oval). DDK enrichment at the CEN ORI cluster is also depicted (light blue oval). A central assumption is that replicating CENs associated with these structures are partially immobilized, forming a cluster of spindle attachment sites capable of resisting K-MT pulling force (force arrows directed toward SPBs). A distribution of such attachments to both spindle poles could offset spindle extension (force arrows in central spindle) at a characteristic S phase spindle length. Such a spindle assembly intermediate may transiently form during conditions that perturb the relative timing of SPB separation and spindle assembly with completion of S phase. In the illustration, the spindle is depicted as “reaching down” to connect to Ks assembled on immobilized CENs. This is a diagrammatic convenience, as the spindle actually extends through the nucleoplasm and would therefore be emmeshed within the replicating chromatin environment.

Similar articles

Cited by

References

    1. Agarwal R, Tang Z, Yu H, Cohen-Fix O. (2003). Two distinct pathways for inhibiting pds1 ubiquitination in response to DNA damage. J Biol Chem , 45027–45033. - PubMed
    1. Alcasabas AA, Osborn AJ, Bachant J, Hu F, Werler PJ, Bousset K, Furuya K, Diffley JF, Carr AM, Elledge SJ. (2001). Mrc1 transduces signals of DNA replication stress to activate Rad53. Nat Cell Biol , 958–965. - PubMed
    1. Allen JB, Zhou Z, Siede W, Friedberg EC, Elledge SJ. (1994). The SAD1/RAD53 protein kinase controls multiple checkpoints and DNA damage-induced transcription in yeast. Genes Dev , 2401–2415. - PubMed
    1. Almawi AW, Matthews LA, Larasati , Myrox P, Boulton S, Lai C, Moraes T, Melacini G, Ghirlando R, Duncker BP, et al. (2016). “AND” logic gates at work: crystal structure of Rad53 bound to Dbf4 and Cdc7. Sci Rep , 34237. - PMC - PubMed
    1. Bachant J, Jessen SR, Kavanaugh SE, Fielding CS. (2005). The yeast S phase checkpoint enables replicating chromosomes to bi-orient and restrain spindle extension during S phase distress. J Cell Biol , 999–1012. - PMC - PubMed

Publication types

MeSH terms

Substances

LinkOut - more resources