. 2019 Sep 11;14(9):e0221766.
doi: 10.1371/journal.pone.0221766. eCollection 2019.

Neuropathy and neural plasticity in the subcutaneous white adipose depot

Affiliations

Neuropathy and neural plasticity in the subcutaneous white adipose depot

Magdalena Blaszkiewicz et al. PLoS One. .

Abstract

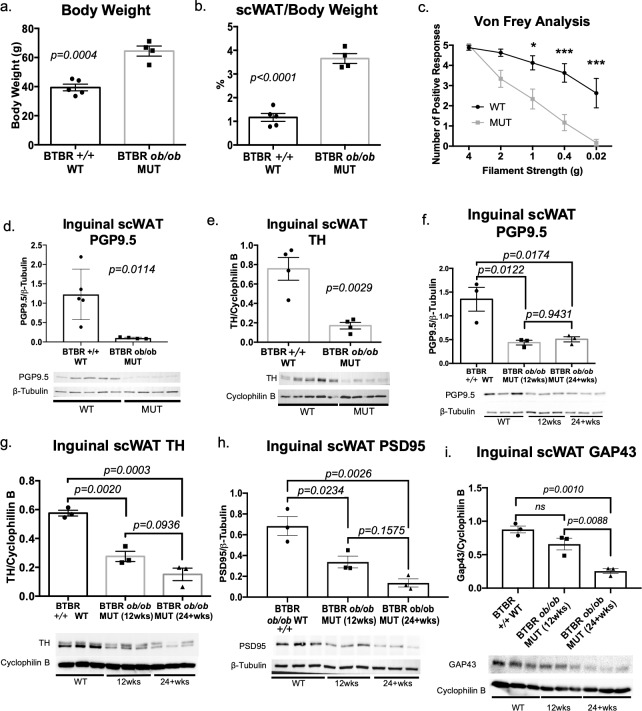
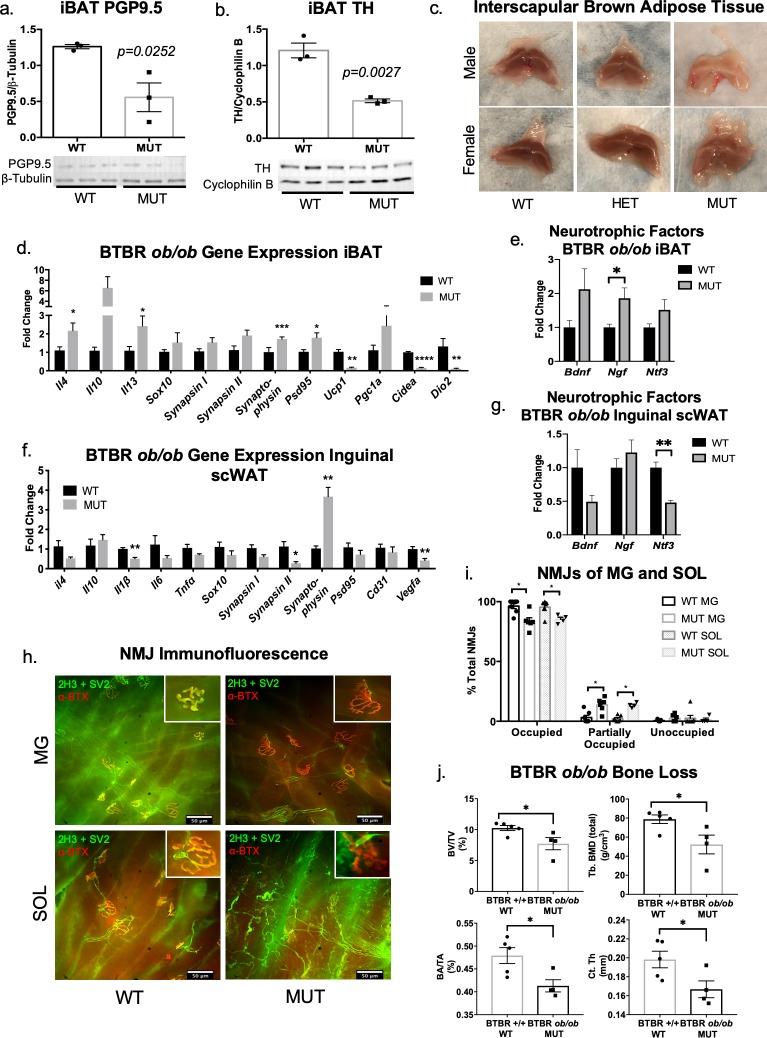
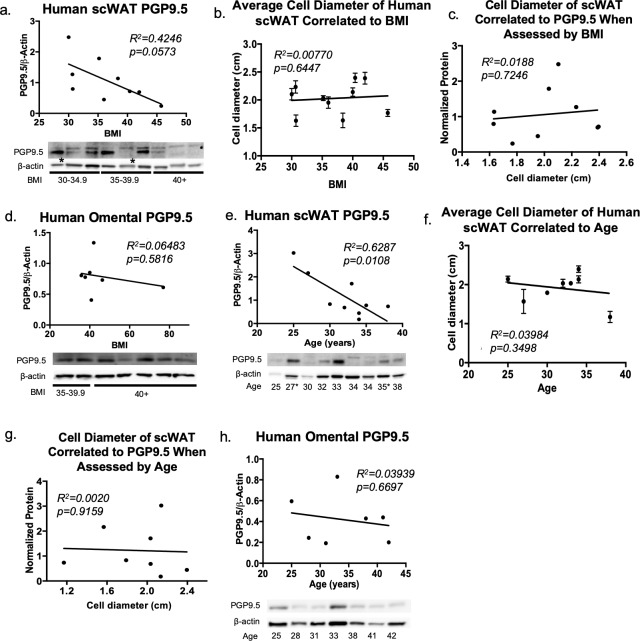
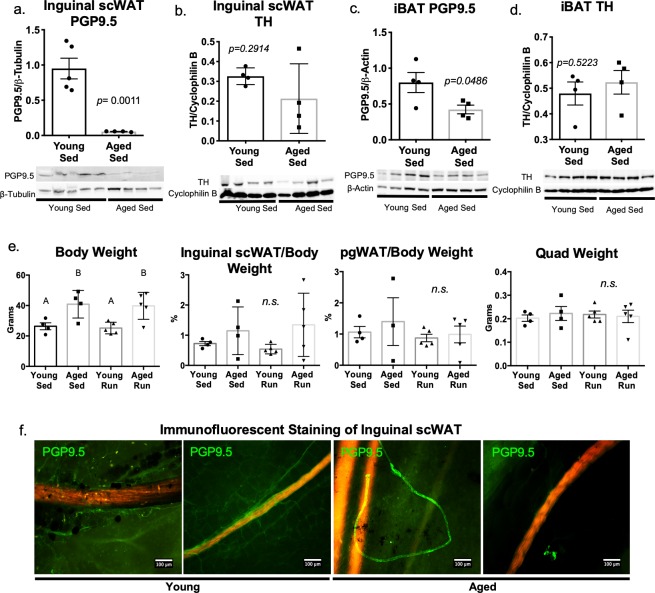
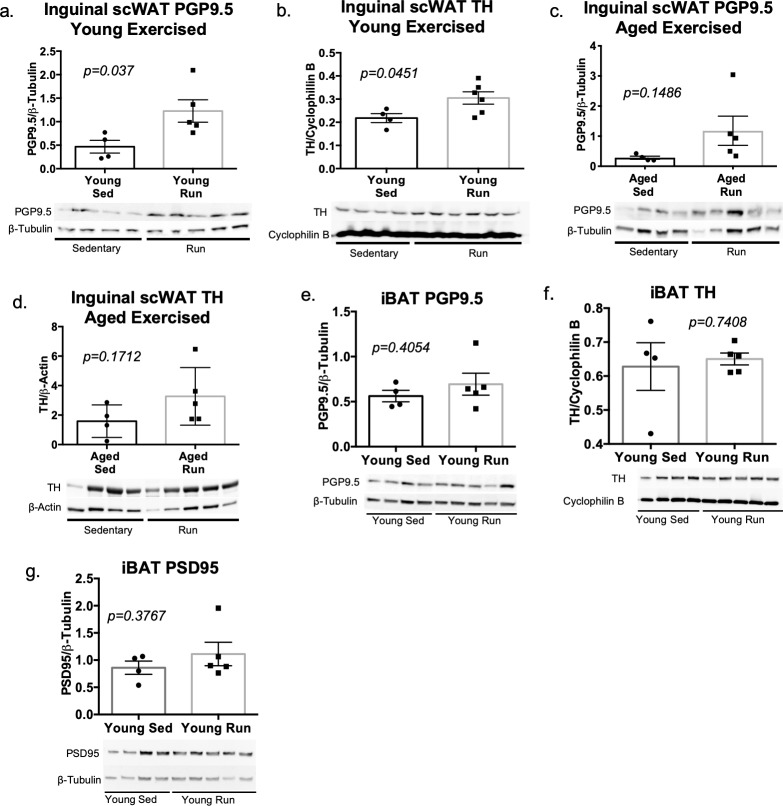
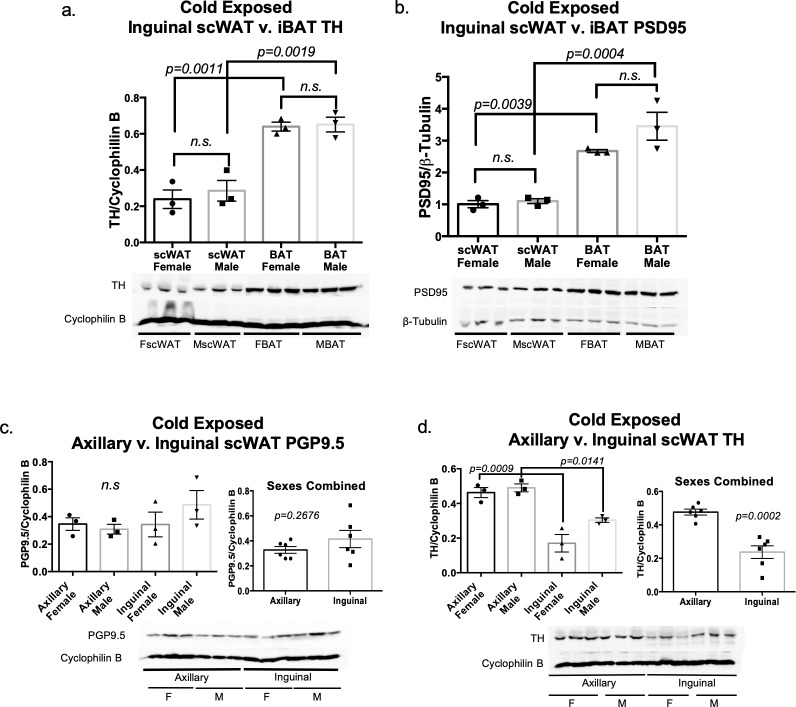
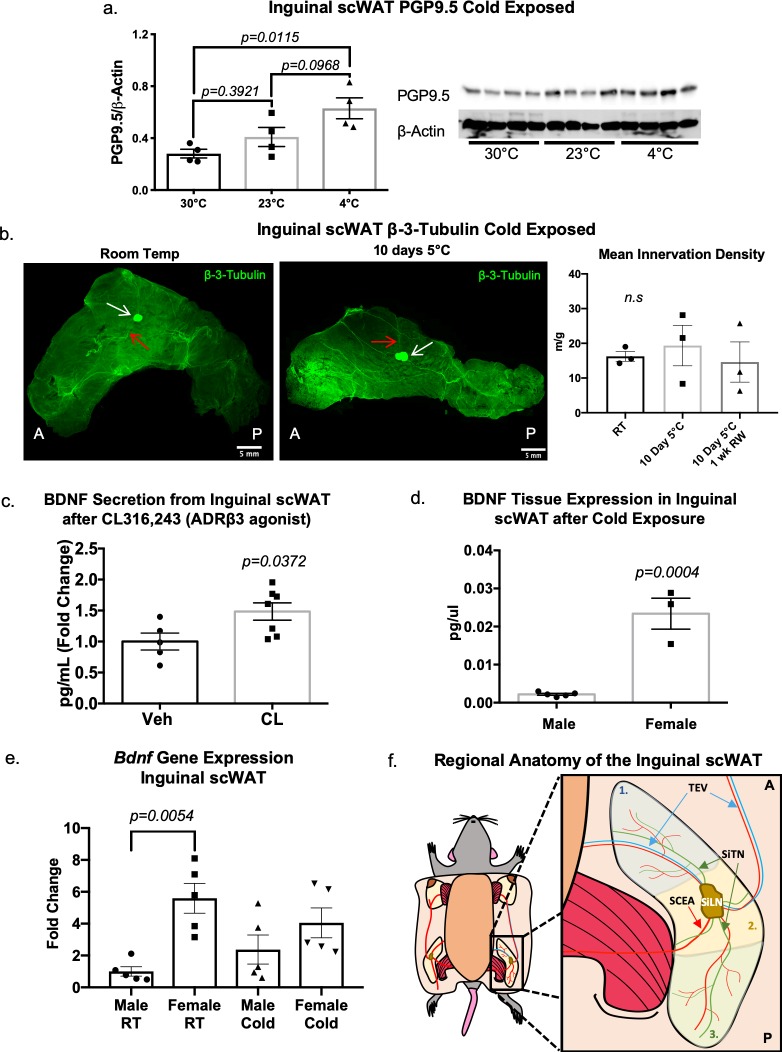
The difficulty in obtaining as well as maintaining weight loss, together with the impairment of metabolic control in conditions like diabetes and cardiovascular disease, may represent pathological situations of inadequate neural communication between the brain and peripheral organs and tissues. Innervation of adipose tissues by peripheral nerves provides a means of communication between the master metabolic regulator in the brain (chiefly the hypothalamus), and energy-expending and energy-storing cells in the body (primarily adipocytes). Although chemical and surgical denervation studies have clearly demonstrated how crucial adipose tissue neural innervation is for maintaining proper metabolic health, we have uncovered that adipose tissue becomes neuropathic (ie: reduction in neurites) in various conditions of metabolic dysregulation. Here, utilizing both human and mouse adipose tissues, we present evidence of adipose tissue neuropathy, or loss of proper innervation, under pathophysiological conditions such as obesity, diabetes, and aging, all of which are concomitant with insult to the adipose organ as well as metabolic dysfunction. Neuropathy is indicated by loss of nerve fiber protein expression, reduction in synaptic markers, and lower neurotrophic factor expression in adipose tissue. Aging-related adipose neuropathy particularly results in loss of innervation around the tissue vasculature, which cannot be reversed by exercise. Together with indications of neuropathy in muscle and bone, these findings underscore that peripheral neuropathy is not restricted to classic tissues like the skin of distal extremities, and that loss of innervation to adipose may trigger or exacerbate metabolic diseases. In addition, we have demonstrated stimulation of adipose tissue neural plasticity with cold exposure, which may ameliorate adipose neuropathy and be a potential therapeutic option to re-innervate adipose and restore metabolic health.


Conflict of interest statement

The authors have declared that no competing interests exist.

Figures

Fig 1
Fig 1. Obesity and diabetes led to white adipose tissue neuropathy.
The BTBR ob/ob (MUT) model of obesity and diabetes was compared to BTBR +/+ wild-type (WT) for body weight measurements (a), and adiposity (b). Body and tissue weight data were analyzed by two-tailed Student’s t-test. Von Frey tactile allodynia analysis was performed on MUT and WT animals to determine onset of peripheral neuropathy (c). Von Frey data was analyzed by ANOVA with Sidak’s post hoc test. For (a-c), all males; WT N = 8, 12–20 weeks old; MUT N = 6, 12–24 weeks old. Protein levels of PGP9.5 (d), as well as TH (e) in inguinal scWAT of the MUT and WT mice were measured by western blotting. For (e), lane 5 was excluded from analyses due to uneven resolution of housekeeper. For (d-e), all males; WT N = 5, 12–20 weeks old and MUT N = 4, 12–20 weeks old. Protein expression of PGP9.5 (f), TH (g), PSD95 (h), and GAP43 (i) in inguinal scWAT of 12–25 weeks old WT, 12 week old MUT and 24–28 week old MUT was measured by western blotting. All males, N = 3 per group. Western blot data were normalized to either β-Tubulin or Cyclophilin B, band intensity were quantified in Image J, and analyzed by two-tailed Student’s t-test. Error bars are SEMs.
Fig 2
Fig 2. Neuropathy extends beyond white adipose tissue in BTBR ob/ob mice.
Protein expression of PGP9.5 (a) and TH (b) in iBAT was measured in MUT mice and compared to WT littermate controls; for (a-b) all 12 week old males, N = 3 WT/MUT. For all western blots, data were normalized to housekeeper proteins β-Tubulin or Cyclophilin B, band intensities were quantified in Image J, and analyzed using a two-tailed Student’s t-test. Error bars are SEMs. Whole BAT depots were compared between female and male BTBR HET, MUT, and WT mice (c). Images are representative, males: MUT N = 2; WT N = 3; HET N = 3; females: MUT N = 1; WT N = 3; HET N = 3; all mice were 12–24 weeks old. Gene expression analysis of BAT (d-e) and inguinal scWAT (f-g). Gene expression data were analyzed by two-tailed Student’s t-test, using Welch’s correction when variance was unequal, N = 4–5 per group. Error bars are SEMs. Neuromuscular Junction (NMJ) Analysis (h-i). Immunofluorescent staining of male BTBR WT and MUT neuromuscular junctions of the medial gastrocnemius (MG) and soleus (SOL) muscles was performed using neurofilament M (2H3) and synaptic vesicles (SV2) (in green) to visualize the pre-synaptic area, and α-bungarotoxin (in red) to visualize the post-synaptic area. Representative images at 40x magnification of BTBR ob/ob wild-type (WT) medial gastrocnemius (MG) (top left panel), and soleus (bottom left panel) captured on Nikon Eclipse E400 microscope. Mutant (MUT) MG (top right panel) and SOL (bottom right panel) (h). Inserts are of occupied (left panels) and partially occupied (right panels) NMJs in representative images (h). Percent of total NMJs for WT and MUT animals in both MG and SOL muscles was calculated as an indicator of neuropathic state (i). Analysis shows multiple t-tests (per row) of replicate cohorts; N = 7 for WT MG, N = 6 for MUT MG, N = 7 for WT SOL, and N = 4 for MUT SOL. Micro CT analysis of BTBR WT and MUT femurs (j). Bone volume density shown as fraction of bone volume/total volume (BV/TV, top left panel); total bone mineral density (BMD) for trabecular bone (Tb) in top right panel; bone area/total area (BA/TA) bottom left panel; and cortical (Ct) thickness (Th) in bottom right panel (j). All animals were male, 12–13 weeks old, N = 5 for WT, N = 4 for MUT. Data analyzed by two-tailed Student’s T- test. Error bars are SEMs. *p < 0.05, **p < 0.01, ***p < 0.001, ****p < 0.0001.
Fig 3
Fig 3. Human subcutaneous and omental white adipose tissue innervation.
In human scWAT, protein levels of pan-neuronal marker PGP9.5 were measured by western blotting; linear regression analysis was performed for assessment of normalized protein levels compared to body mass index (BMI) (a). Average cell diameter in scWAT of human samples when assessed by BMI (b), and normalized protein expression plotted against average cell size (c). Protein levels of PGP9.5 were measured in omental adipose by western blotting; linear regression analysis was performed for assessment of normalized protein levels compared to BMI (d). Protein levels of PGP9.5 measured in human scWAT, linear regression analysis was performed for assessment of normalized protein levels compared to age (e). Average cell diameter in scWAT of human samples when assessed by age (f), and normalized protein expression plotted against average cell size (g). Protein levels of PGP9.5 were measured in omental adipose by western blotting; linear regression analysis was performed for assessment of normalized protein levels compared to age (h). Western blot data were normalized to β-actin, band intensities were quantified in Image J, and analyzed by two-tailed Student’s t-test. Protein expression was normalized to β-Actin and band intensities were quantified in Image J. Cell diameter was measured from images of histological cross-sections of adipose tissue from each patient, averaged (n = 3), and analyzed by linear regression. Due to limitations of available samples from the BNORC adipose tissue core at Boston Medical Center, the BMI distribution of omental adipose was clustered around 40. Error bars are SEMs. For (a,e) N = 9 BMI cohort, N = 9 Age cohort. For (a,e) * indicates individuals with diagnosed diabetes. The majority of human samples were females, see S1–S3 Tables for clinical details.
Fig 4
Fig 4. Aging is associated with adipose tissue neuropathy.
In young (10–12 weeks old) and aged (16 months old) sedentary male C57BL/6J mice, western blotting was used to measure protein expression of PGP9.5 in inguinal scWAT for assessment of total innervation (a) while TH was used to assess sympathetic activation (b). In the same animals, protein expression of PGP9.5 (c) and TH (d) in intrascapular brown adipose tissue (iBAT) was measured by western blot. Protein expression was normalized to either β-Actin, β-Tubulin or Cycophilin B, band intensity was quantified in Image J and analyzed by two-tailed Student’s t-test; N = 4 for young and aged groups. Body weight, adiposity (inguinal scWAT/body weight & pgWAT/body weight), and quadricep muscle weight was measured for young (12 weeks old) and aged (16 month old) mice under sedentary (sed) and exercised (run) conditions (e). Body and tissue weight analyzed by one-way ANOVA, with Tukey post hoc, groups labeled with the same letter (A or B) are statistically similar, for body weight: p = 0.0473 for young sed v. aged sed; p = 0.0240 for young run v aged run. For young and aged sedentary animals N = 4, for young and aged exercised (run) mice, N = 5 per group. Whole depot immunofluorescent imaging of inguinal scWAT from sedentary animals for total innervation (PGP9.5 in green) and vasculature (red/orange; autofluorescence) was performed (f). Images captured at 10x on Nikon Eclipse E400 microscope and are representative of N = 4 mice analyzed per group. Error bars are SEMs, *p < 0.05, **p < 0.01, ***p < 0.001, ****p < 0.0001.
Fig 5
Fig 5. Exercise increases adipose innervation in young mice and attenuated loss of age-related adipose innervation.
Young (10–12 weeks old) and aged (16 months old) male C57BL/6J mice were placed in running-wheel cages for 7 days with continuous access to a running wheel (run). To assess exercise effects on adipose innervation in young mice, protein expression in inguinal scWAT was measured by western blotting with PGP9.5 as a marker of total innervation (a), and TH as an indicator of sympathetic activation (b). Protein expression was normalized to either β-Tubulin or Cyclophilin B. Band intensity was quantified in Image J and analyzed by two-tailed Student’s t-test; N = 4 for young sedentary and N = 5–6 for exercised groups. Protein expression of PGP9.5 (c) and TH (d) in inguinal scWAT of aged sedentary and exercised mice was also determined by western blotting. Protein expression was normalized to β-Tubulin or β-Actin, band intensity was quantified in Image J and analyzed by two-tailed Student’s t-test; N = 4 for aged sedentary animals, N = 5 for aged exercised (run) animals. Young (12–15 weeks old) male C57BL/6J mice were placed in running-wheel cages for 7 days with continuous access to a running wheel (run), control (sed) animals were placed in cages with a locked running wheel. Error bars are SEMs. Protein expression of PGP9.5 (e), TH (f), and PSD95 (g) in iBAT of young (12 week old) sedentary (young sed) versus young exercised (young run) mice was determined by western blotting. Protein expression was normalized to β-Tubulin or Cyclophilin B; band density was quantified in Image J and analyzed using a two-tailed Student’s t-test. Error bars are SEMs.
Fig 6
Fig 6. Adipose innervation: Sex and depot comparison.
Adult (16 week old) male and female control mice on a C57BL/6J background were cold exposed (5°C) for 3 days. Protein expression of TH (a) and PSD95 (b) were measured in inguinal scWAT and BAT via western blotting. Protein expression of pan-neuronal marker PGP9.5 (c) and sympathetic nerve marker TH (d) was measured in axillary and inguinal scWAT for both sexes via western blotting. Protein expression was normalized to β-Tubulin or Cyclophilin B, band density was quantified in Image J and analyzed using a Two-Tailed Student’s t-test. Error bars are SEMs.
Fig 7
Fig 7. Cold exposure induces adipose nerve remodeling.
Adult (8 week old) wild-type C57BL/6J male mice were either cold exposed (at 4°C), maintained at room temperature, or at thermoneutrality (30°C) for 3 days. Changes in innervation were assessed by measuring protein expression of a pan-neuronal marker (PGP9.5) in inguinal scWAT via western blotting (a). Protein expression was normalized to β-Actin, band intensity was quantified in Image J and analyzed by two-tailed Student’s t-test; N = 4 per group. In a separate experiment, adult (18–22 week old) control male mice on a mixed genetic background were maintained either at room temperature (RT), at 5°C for 10 days, or at 5°C for 10 days and then returned to RT for 1 week (rewarmed). Entire depots were immunostained with β3-Tubuilin and imaged on a Leica TCS SP8 or DMI6000 confocal microscope by tiling z-stacks through the entire depth of tissue (b). For quantification of arborization (b, right panel), tiles were individually Z-projected, background subtracted, thresholded into binary images, and skeletonized. Branches less than 4μm in length were excluded from the analysis. White arrows point to subiliac lymph node, red arrows indicate branches of the thoracoepigastric vein (TEV); anterior side (A) is left of subiliac lymph node, posterior side (P) is right of subiliac lymph node. Images are representative of N = 3 per group, error bars are SEMs. Adult (12–13 weeks old) male C57BL/6J mice received either daily i.p. injections of ADRβ3 agonist CL316,243 (at 1.0 mg/kg BW), or vehicle (Veh) for 10–14 days; ex vivo secretions (collected at 1hr and 2hr) from inguinal scWAT explants were measured for BDNF by ELISA, analyzed by two-tailed Student’s t-test, and presented as fold change in picograms (pg)/mL (c). Data is representative of multiple cohorts, N = 5 (Veh), N = 7 (CL316,243). Error bars are SEMs. Adult (16 week old) male and female control mice on a C57BL/6J background were cold exposed (5°C) for 3 days. BDNF protein expression in inguinal scWAT was measured for both sexes via multiplex ELISA assay (d). Gene expression analysis of Bdnf in inguinal scWAT of 15–17 week old male and female C57BL/6J mice (e). Animals were maintained at room temperature (RT) or cold exposed (5°C) for 7 days; gene expression data were analyzed by two-tailed Student’s t-test, N = 5 per group. Error bars are SEMs. Schematic of inguinal scWAT (f) divided into three anatomically distinct areas: 1. area anterior to subiliac lymph node (LN), 2. LN area, 3. area posterior to LN. Major vasculature is shown with the TEV [65] illustrated as blue line and the superficial caudal epigastric artery (SCEA) [66] and other vasculature illustrated as red lines. Branches of the subiliac transverse nerves (SiTN) are illustrated as green lines.

Similar articles

Cited by

References

    1. Ryu V, Watts AG, Xue B, Bartness TJ. Bidirectional crosstalk between the sensory and sympathetic motor systems innervating brown and white adipose tissue in male Siberian hamsters. American journal of physiology Regulatory, integrative and comparative physiology. 2017;312(3):R324–r37. Epub 2017/01/13. 10.1152/ajpregu.00456.2015 - DOI - PMC - PubMed
    1. Morrison SF, Madden CJ. Central nervous system regulation of brown adipose tissue. Comprehensive Physiology. 2014;4(4):1677–713. Epub 2014/11/28. 10.1002/cphy.c140013 - DOI - PMC - PubMed
    1. Bartness TJ, Shrestha YB, Vaughan CH, Schwartz GJ, Song CK. Sensory and sympathetic nervous system control of white adipose tissue lipolysis. Mol Cell Endocrinol. 2010;318(1–2):34–43. Epub 2009/09/15. 10.1016/j.mce.2009.08.031 - DOI - PMC - PubMed
    1. Bartness TJ, Vaughan CH, Song CK. Sympathetic and sensory innervation of brown adipose tissue. Int J Obes (Lond). 2010;34 Suppl 1:S36–42.:S36-S42. - PMC - PubMed
    1. Townsend KL, Tseng YH. Brown fat fuel utilization and thermogenesis. Trends Endocrinol Metab. 2014;25(4):168–77. Epub 2014/01/07. 10.1016/j.tem.2013.12.004 - DOI - PMC - PubMed

Publication types

Substances