

Fe limitation decreases transcriptional regulation over the diel cycle in the model diatom Thalassiosira pseudonana
- PMID: 31509589
- PMCID: PMC6738920
- DOI: 10.1371/journal.pone.0222325
Fe limitation decreases transcriptional regulation over the diel cycle in the model diatom Thalassiosira pseudonana
Abstract
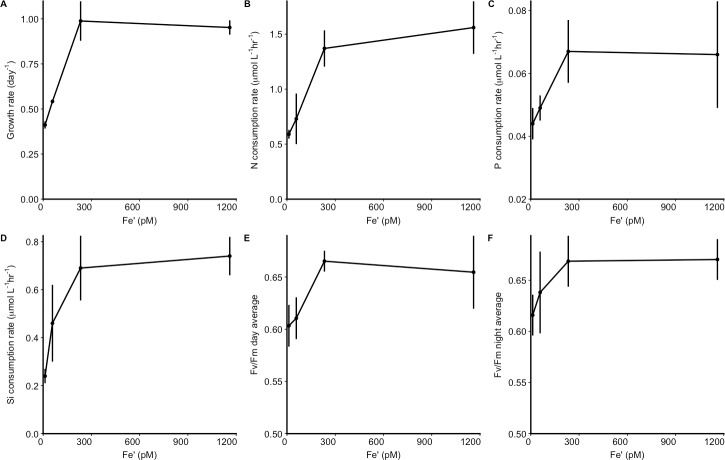
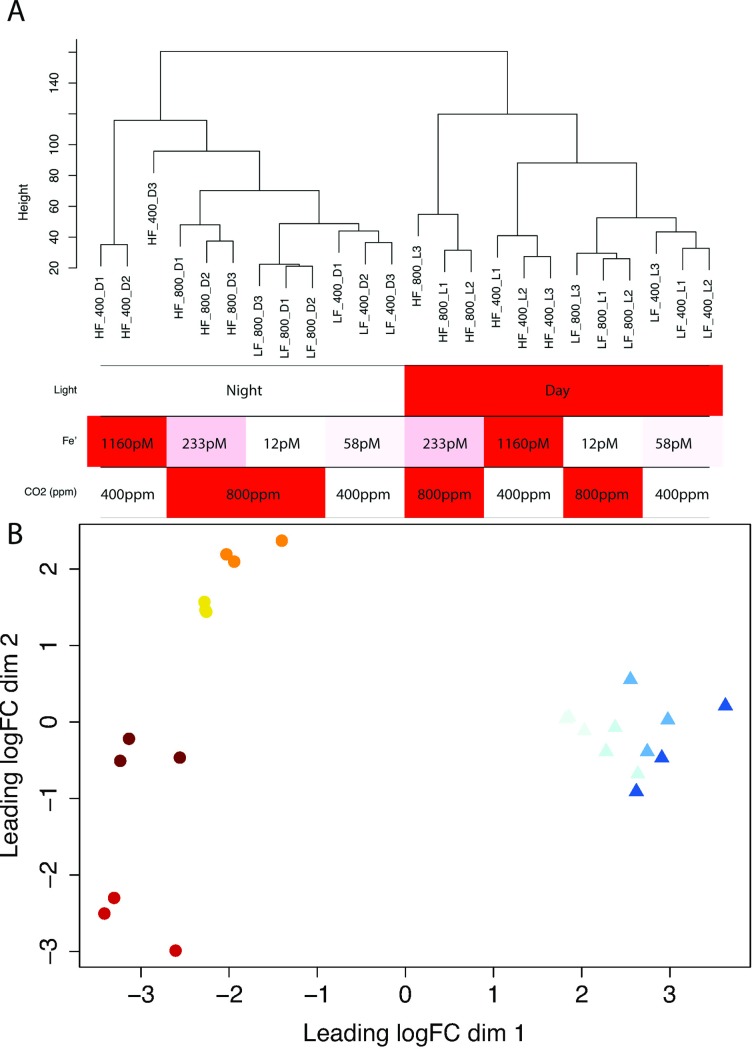
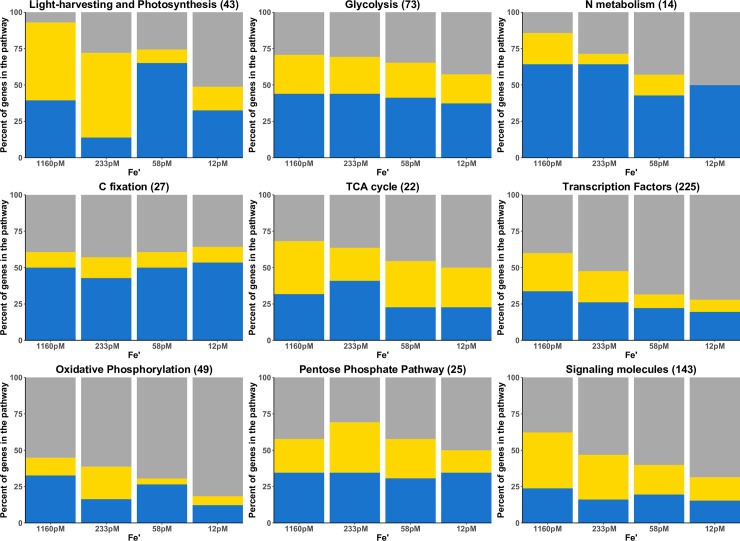
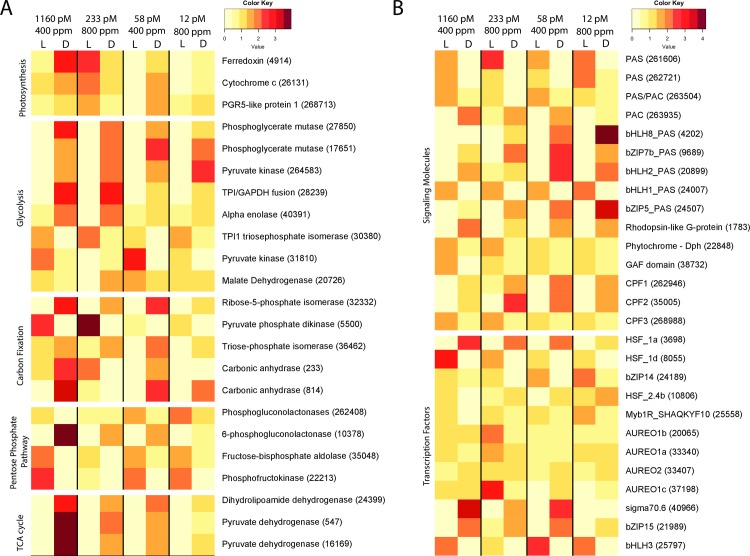
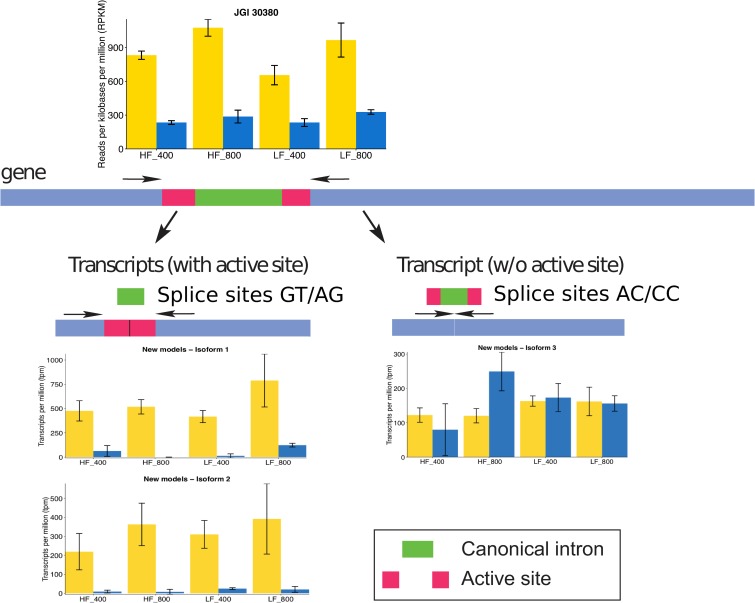
Iron (Fe) is an important growth factor for diatoms and its availability is further restricted by changes in the carbonate chemistry of seawater. We investigated the physiological attributes and transcriptional profiles of the diatom Thalassiosira pseudonana grown on a day: night cycle under different CO2/pH and iron concentrations, that in combination generated available iron (Fe') concentrations of 1160, 233, 58 and 12 pM. We found the light-dark conditions to be the main driver of transcriptional patterns, followed by Fe' concentration and CO2 availability, respectively. At the highest Fe' (1160 pM), 55% of the transcribed genes were differentially expressed between day and night, whereas at the lowest Fe' (12 pM), only 28% of the transcribed genes displayed comparable patterns. While Fe limitation disrupts the diel expression patterns for genes in most central metabolism pathways, the diel expression of light- signaling molecules and glycolytic genes was relatively robust in response to reduced Fe'. Moreover, we identified a non-canonical splicing of transcripts encoding triose-phosphate isomerase, a key-enzyme of glycolysis, generating transcript isoforms that would encode proteins with and without an active site. Transcripts that encoded an active enzyme maintained a diel expression at low Fe', while transcripts that encoded the non-active enzyme lost the diel expression. This work illustrates the interplay between nutrient limitation and transcriptional regulation over the diel cycle. Considering that future ocean conditions will reduce the availability of Fe in many parts of the oceans, our work identifies some of the regulatory mechanisms that may shape future ecological communities.
Conflict of interest statement
The authors have declared that no competing interests exist.
Figures
Similar articles
-
Transcriptional Orchestration of the Global Cellular Response of a Model Pennate Diatom to Diel Light Cycling under Iron Limitation.PLoS Genet. 2016 Dec 14;12(12):e1006490. doi: 10.1371/journal.pgen.1006490. eCollection 2016 Dec. PLoS Genet. 2016. PMID: 27973599 Free PMC article.
-
Whole-genome expression analysis reveals a role for death-related genes in stress acclimation of the diatom Thalassiosira pseudonana.Environ Microbiol. 2012 Jan;14(1):67-81. doi: 10.1111/j.1462-2920.2011.02468.x. Epub 2011 Mar 31. Environ Microbiol. 2012. PMID: 21453404
-
Genetic indicators of iron limitation in wild populations of Thalassiosira oceanica from the northeast Pacific Ocean.ISME J. 2015 Mar;9(3):592-602. doi: 10.1038/ismej.2014.171. Epub 2014 Oct 21. ISME J. 2015. PMID: 25333460 Free PMC article.
-
Phylogenetic aspects of the sulfate assimilation genes from Thalassiosira pseudonana.Amino Acids. 2013 May;44(5):1253-65. doi: 10.1007/s00726-013-1462-8. Epub 2013 Jan 26. Amino Acids. 2013. PMID: 23354278 Review.
-
Diatom elemental and morphological changes in response to iron limitation: a brief review with potential paleoceanographic applications.Geobiology. 2009 Sep;7(4):419-31. doi: 10.1111/j.1472-4669.2009.00207.x. Epub 2009 Jul 29. Geobiology. 2009. PMID: 19659798 Review.
Cited by
-
Re-examination of two diatom reference genomes using long-read sequencing.BMC Genomics. 2021 May 24;22(1):379. doi: 10.1186/s12864-021-07666-3. BMC Genomics. 2021. PMID: 34030633 Free PMC article.
-
An undiscovered circadian clock to regulate phytoplankton photosynthesis.PNAS Nexus. 2024 Nov 6;3(11):pgae497. doi: 10.1093/pnasnexus/pgae497. eCollection 2024 Nov. PNAS Nexus. 2024. PMID: 39544497 Free PMC article.
-
Diminished carbon and nitrate assimilation drive changes in diatom elemental stoichiometry independent of silicification in an iron-limited assemblage.ISME Commun. 2022 Jul 9;2(1):57. doi: 10.1038/s43705-022-00136-1. ISME Commun. 2022. PMID: 37938259 Free PMC article.
-
Divergent functions of two clades of flavodoxin in diatoms mitigate oxidative stress and iron limitation.Elife. 2023 Jun 6;12:e84392. doi: 10.7554/eLife.84392. Elife. 2023. PMID: 37278403 Free PMC article.
-
Representative Diatom and Coccolithophore Species Exhibit Divergent Responses throughout Simulated Upwelling Cycles.mSystems. 2021 Mar 30;6(2):e00188-21. doi: 10.1128/mSystems.00188-21. mSystems. 2021. PMID: 33785571 Free PMC article.
References
-
- Nelson DM, Tréguer P, Brzezinski MA, Leynaert A, Quéguiner B. Production and dissolution of biogenic silica in the ocean: revised global estimates, comparison with regional data and relationship to biogenic sedimentation. Global Biogeochemical Cycles. 1995;9(3):359–72.
-
- Huysman MJ, Fortunato AE, Matthijs M, Costa BS, Vanderhaeghen R, Van den Daele H, et al. AUREOCHROME1a-mediated induction of the diatom-specific cyclin dsCYC2 controls the onset of cell division in diatoms (Phaeodactylum tricornutum). The Plant Cell. 2013;25(1):215–28. 10.1105/tpc.112.106377 - DOI - PMC - PubMed
-
- Olson R, Chisholm S. Effects of photocycles and periodic ammonium supply on three marine phytoplankton species. I: Cell division patterns. Journal of Phycology. 1983;19(4):522–8.
Publication types
MeSH terms
Substances
LinkOut - more resources
Full Text Sources
Medical
Molecular Biology Databases
