. 2019 Oct 10;381(15):1422-1433.
doi: 10.1056/NEJMoa1815111. Epub 2019 Sep 11.

Serine and Lipid Metabolism in Macular Disease and Peripheral Neuropathy

Affiliations

Serine and Lipid Metabolism in Macular Disease and Peripheral Neuropathy

Marin L Gantner et al. N Engl J Med. .

Abstract

Background: Identifying mechanisms of diseases with complex inheritance patterns, such as macular telangiectasia type 2, is challenging. A link between macular telangiectasia type 2 and altered serine metabolism has been established previously.

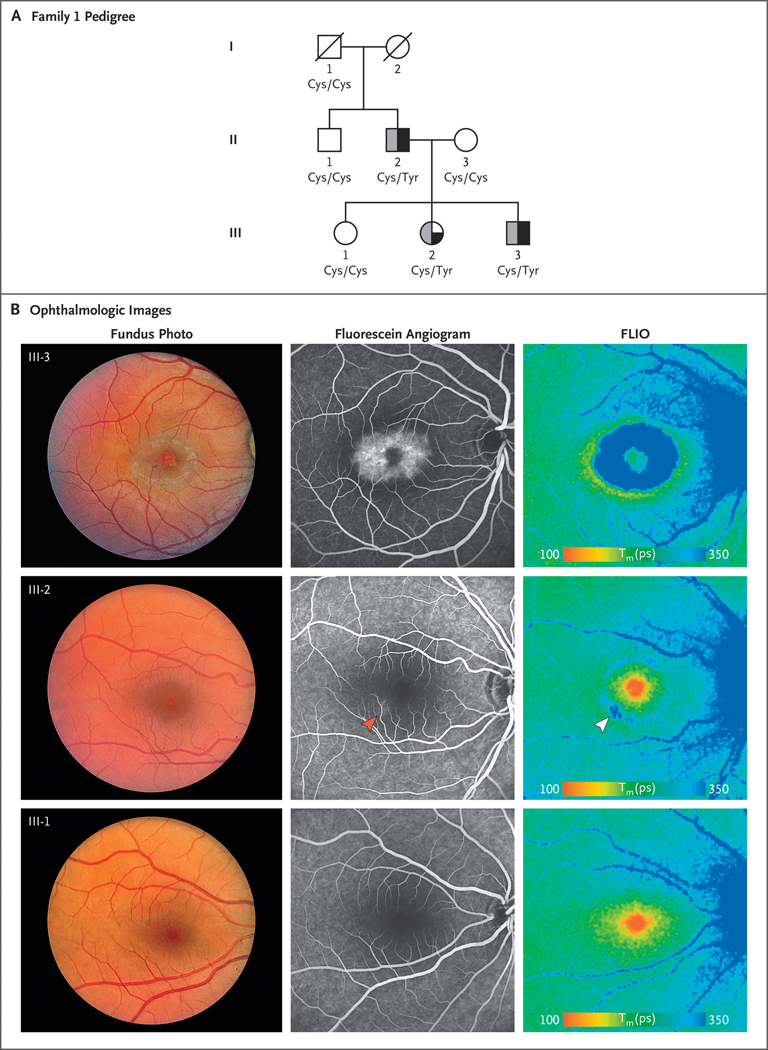
Methods: Through exome sequence analysis of a patient with macular telangiectasia type 2 and his family members, we identified a variant in SPTLC1 encoding a subunit of serine palmitoyltransferase (SPT). Because mutations affecting SPT are known to cause hereditary sensory and autonomic neuropathy type 1 (HSAN1), we examined 10 additional persons with HSAN1 for ophthalmologic disease. We assayed serum amino acid and sphingoid base levels, including levels of deoxysphingolipids, in patients who had macular telangiectasia type 2 but did not have HSAN1 or pathogenic variants affecting SPT. We characterized mice with low serine levels and tested the effects of deoxysphingolipids on human retinal organoids.

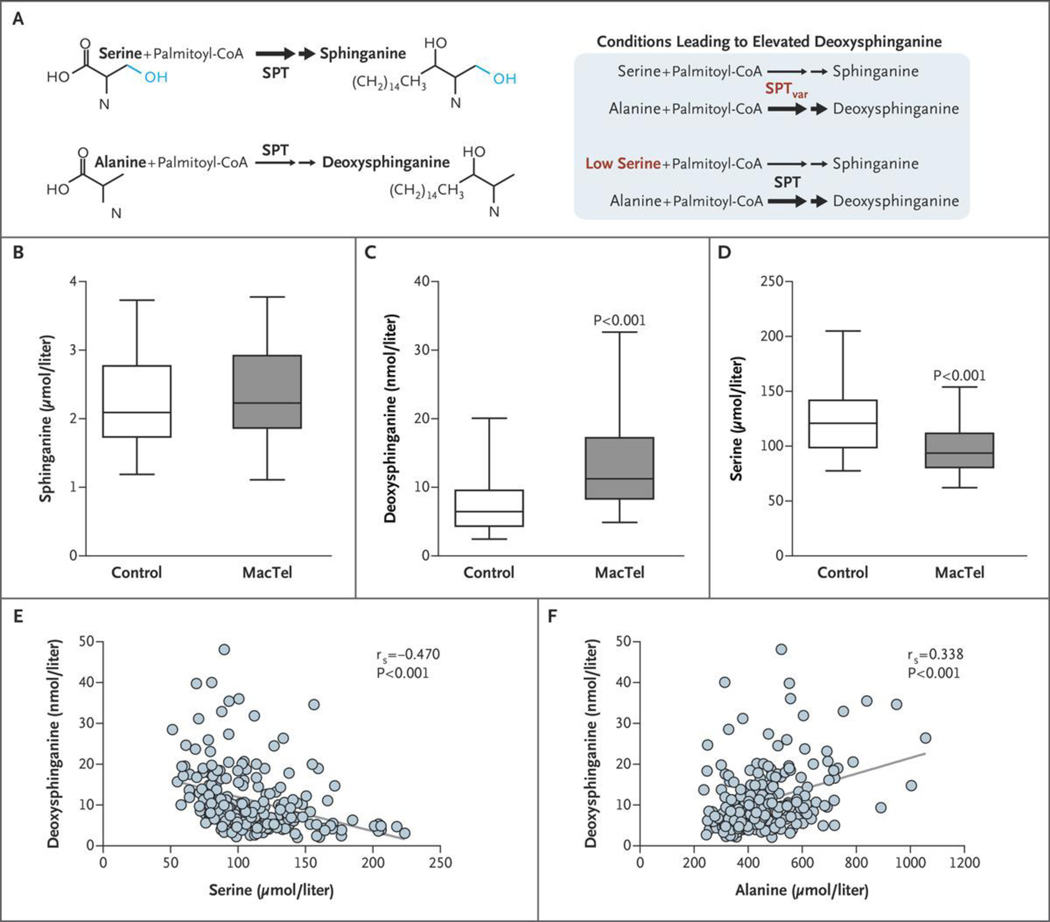
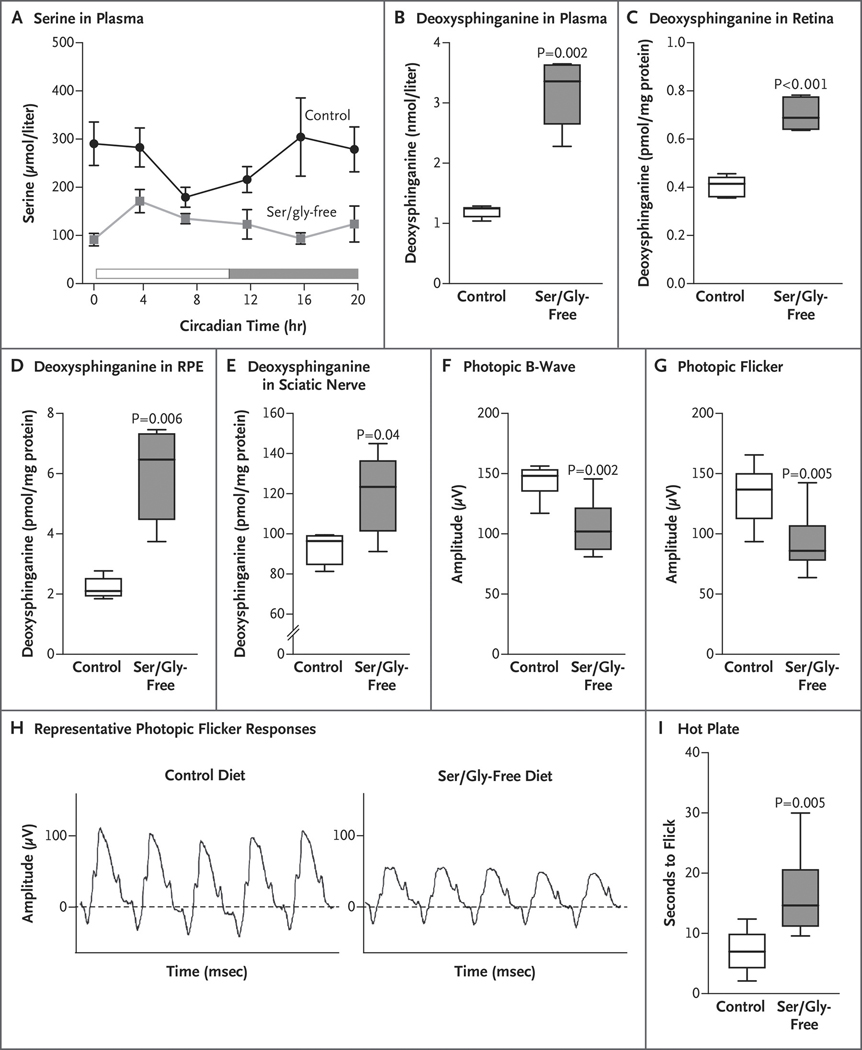
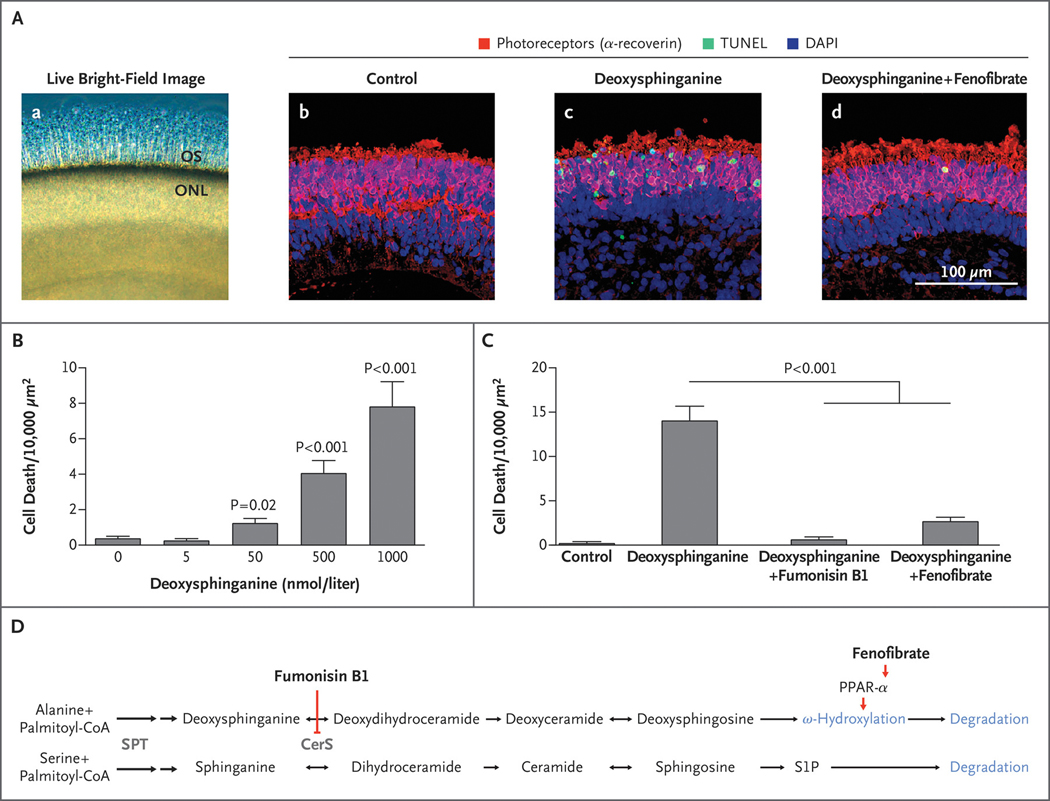
Results: Two variants known to cause HSAN1 were identified as causal for macular telangiectasia type 2: of 11 patients with HSAN1, 9 also had macular telangiectasia type 2. Circulating deoxysphingolipid levels were 84.2% higher among 125 patients with macular telangiectasia type 2 who did not have pathogenic variants affecting SPT than among 94 unaffected controls. Deoxysphingolipid levels were negatively correlated with serine levels, which were 20.6% lower than among controls. Reduction of serine levels in mice led to increases in levels of retinal deoxysphingolipids and compromised visual function. Deoxysphingolipids caused photoreceptor-cell death in retinal organoids, but not in the presence of regulators of lipid metabolism.

Conclusions: Elevated levels of atypical deoxysphingolipids, caused by variant SPTLC1 or SPTLC2 or by low serine levels, were risk factors for macular telangiectasia type 2, as well as for peripheral neuropathy. (Funded by the Lowy Medical Research Institute and others.).


Figures

Figure 1 (facing page).
Figure 1 (facing page).. Macular Telangiectasia Type 2 in Patients with Hereditary Sensory and Autonomic Neuropathy Type 1A (HSAN1A) and the SPTLC1 p.Cys133Tyr Variant.
Panel A shows a pedigree of Family 1. Squares indicate male family members, and circles female family members; a slash through a symbol indicates that the family member is deceased. A half-solid symbol indicates macular telangiectasia type 2, and a half-gray symbol indicates HSAN1A. The quarter-solid symbol representing Family Member III-2 indicates possibly affected status. The amino acid status of SPTLC1 at position 133, as predicted on the basis of the genetic variants, is shown. Panel B shows ophthalmologic images of Family Members III-3 (affected), III-2 (possibly affected), and III-1 (unaffected), highlighting features of macular telangiectasia type 2, including temporal right-angle vessels, parafoveal opacification, and pigment clumping. Late-fluorescein angiographic images show strong parafoveal hyperfluorescence in III-3, subtle inferotemporal hyperfluorescence in III-2 (red arrowhead), and no hyperfluorescence in the unaffected family member, III-1. Fluorescence lifetime imaging ophthalmoscopy (FLIO) images of Family Member III-3 show a characteristic parafoveal blue ring of long FLIO lifetimes and redistribution of the foveal macular pigment in an orange ring of short FLIO lifetimes around the macular telangiectasia type 2 area. Family Member III-2 has a less intense blue parafoveal ring that is most pronounced at the same site where fluorescein staining was observed (white arrowhead). The unaffected sister (III-1) has a normal FLIO with normal macular pigment (orange spot centered on the fovea) and no parafoveal blue ring. Tm(ps) denotes mean fluorescence lifetime in picoseconds.
Figure 2.
Figure 2.. Deoxysphinganine and Serine Levels in Patients with Macular Telangiectasia Type 2.
Panel A shows the generation of deoxysphingolipids under various conditions. Double arrows denote two sequential reactions in the biosynthetic pathway. SPT denotes serine palmitoyltransferase, and SPTvar variant SPT. Panels B through D show the quantitative levels of the metabolites sphinganine (Panel B), deoxysphinganine (Panel C), and serine (Panel D) in serum from 125 patients with macular telangiectasia type 2 (MacTel) and 94 controls; patients with known SPTLC1 or SPTLC2 variants were excluded. Data represented by the box-and-whisker plots are the median, first and third quartiles, and 5th and 95th percentiles. Linear mixed modeling was performed for statistical comparison. Panels E and F show correlation plots of serine and alanine levels, respectively, as compared with deoxysphinganine levels. The term rs denotes the Spearman rank correlation coefficient; the P values are from linear mixed models.
Figure 3.
Figure 3.. Serine and Deoxysphinganine Levels and Retinal and Peripheral Neural Defects in Wild-Type Mice.
Panel A shows serine levels in plasma measured in mice that were fed a control diet or serine- and glycine-free diet for 2 weeks (5 mice in each group). Panels B through E show the quantification of total hydrolyzed deoxysphinganine in plasma and in the indicated tissues in mice that were fed a control diet or a serine- and glycine-free diet for 3 months (5 mice in each group). Deoxysphinganine levels are normalized to the milligrams of tissue protein. RPE denotes retinal pigment epithelium. Panels F and G show electroretinographic (ERG) measurements of photopic responses to a flash in light-adapted mice that were fed a control or a serine- and glycine-free diet for 10 months (8 to 10 eyes in each group). Panel H shows representative photopic flicker responses from mice that were fed a control or a serine- and glycine-free diet. Panel I shows peripheral neural function evaluated by hot-plate assay indicating “time to flick” (i.e., time to a visible reaction to a thermal stimulus) in mice that were fed a control or a serine- and glycine-free diet for 10 months (8 mice in each group). Data represented by the box-and-whisker plots are the median, first and third quartile, and minimum and maximum values. P values were determined with Student’s t-test and corrected for multiple testing by the Benjamini–Hochberg procedure (Tables S14 and S15 in Supplementary Appendix 1).
Figure 4.
Figure 4.. Effect of PPAR-α Agonist Fenofibrate on Deoxysphingolipid Toxicity in Human Photoreceptors.
Panel A, subpanel a shows live bright-field image of human retinal organoid tissue showing outer segments (OS) projecting from the outer nuclear layer (ONL); subpanels b through d show representative confocal images of cell death (indicated by terminal deoxynucleotidyl transferase dUTP nick end labeling [TUNEL] staining) within the photoreceptors (indicated by the presence of α-recoverin) of the retinal organoid ONL after 4 days of treatment with control media (subpanel b), deoxysphinganine (1 μmol per liter) (subpanel c), or deoxysphinganine (1 μmol per liter) plus fenofibrate (20 μmol per liter) (subpanel d). Blue staining with 4′,6-diamidino-2-phenylindole (DAPI) indicates the presence of cell nuclei. Panel B shows the toxicity dose response of deoxysphinganine in retinal organoids. Cell death was quantified in human photoreceptors cultured in varying concentrations of deoxysphinganine for 8 days (9 per group) (Table S15 in Supplementary Appendix 1). Panel C shows pharmacologic rescue of deoxysphinganine toxicity. Cell death was quantified in human photoreceptors after treatment with control media (6 organoids), deoxysphinganine (1 μmol per liter) (22 organoids), deoxysphinganine (1 μmol per liter) plus fumonisin B1 (35 μmol per liter) (12 organoids), or deoxysphinganine (1 μmol per liter) plus fenofibrate (20 μmol per liter) (21 organoids). Bar graphs with T bars indicate the means and standard errors. P values were determined with the Wald test on a linear regression analysis. Cell death (the number of dead cells within the defined area) was normalized by a square-root transformation. Model assumptions were assessed with model diagnostics plots (Tables S16 and S17 in Supplementary Appendix 1). Panel D shows the steps in the ceramide–deoxyceramide pathway, including the interaction of fumonisin B1 and fenofibrate. Both pathways share the enzymes shown in gray. Deoxysphingosine is degraded through ω-hydroxylation; it cannot be degraded through the sphingosine-1-phosphate (S1P) pathway. Double arrows denote two sequential reactions in the biosynthetic pathway. CerS denotes ceramide synthase, and SPT serine palmitoyltransferase.

Comment in

  • A Metabolic Vulnerability of Vision.
    Tyynismaa H. Tyynismaa H. N Engl J Med. 2019 Oct 10;381(15):1474-1476. doi: 10.1056/NEJMe1910322. Epub 2019 Sep 11. N Engl J Med. 2019. PMID: 31509668 No abstract available.

Similar articles

Cited by

References

    1. Chew EY, Clemons TE, Jaffe GJ, et al. Effect of ciliary neurotrophic factor on retinal neurodegeneration in patients with macular telangiectasia type 2: a randomized clinical trial. Ophthalmology 2019; 126: 540–9. - PMC - PubMed
    1. Gass JD, Blodi BA. Idiopathic juxtafoveolar retinal telangiectasis: update of classification and follow-up study. Ophthalmology 1993; 100: 1536–46. - PubMed
    1. Aung KZ, Wickremasinghe SS, Makeyeva G, Robman L, Guymer RH. The prevalence estimates of macular telangiectasia type 2: the Melbourne Collaborative Cohort Study. Retina 2010; 30: 473–8. - PubMed
    1. Klein R, Blodi BA, Meuer SM, Myers CE, Chew EY, Klein BE. The prevalence of macular telangiectasia type 2 in the Beaver Dam eye study. Am J Ophthalmol 2010; 150(1): 55–62.e2. - PMC - PubMed
    1. Ronquillo CC, Wegner K, Calvo CM, Bernstein PS. Genetic penetrance of macular telangiectasia type 2. JAMA Ophthalmol 2018; 136: 1158–63. - PMC - PubMed

Publication types

MeSH terms