. 2019 Sep 10;28(11):2739-2747.e4.
doi: 10.1016/j.celrep.2019.08.009.

A Midbrain Circuit that Mediates Headache Aversiveness in Rats

Affiliations

A Midbrain Circuit that Mediates Headache Aversiveness in Rats

Maggie W Waung et al. Cell Rep. .

Abstract

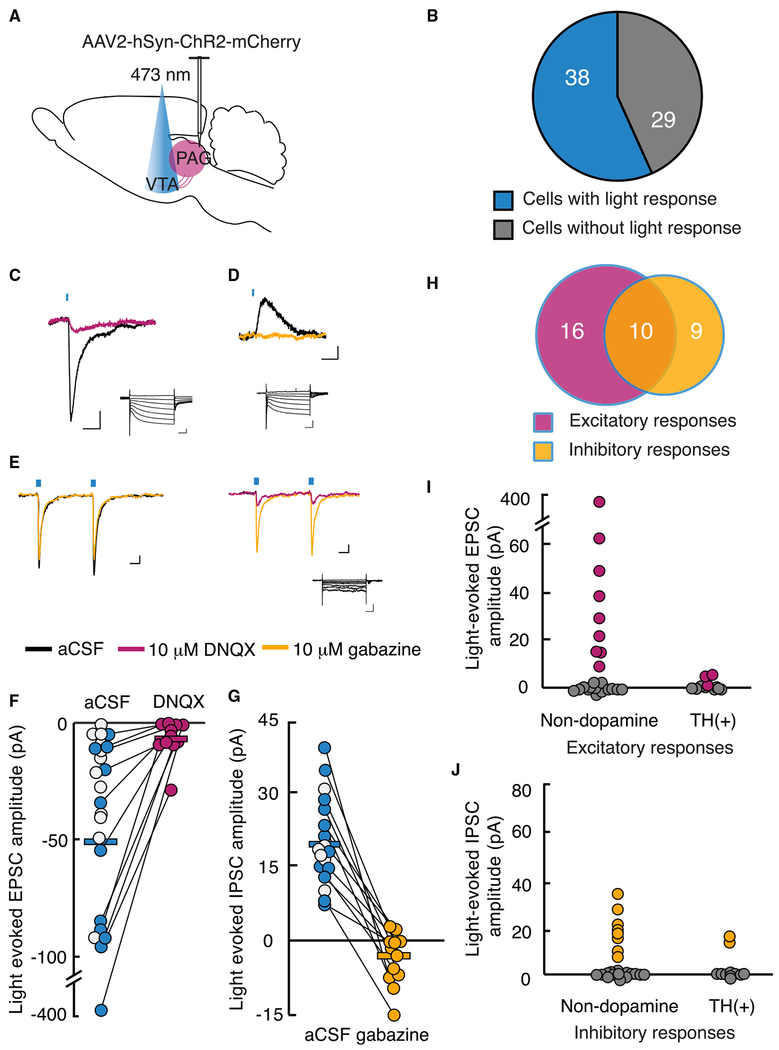
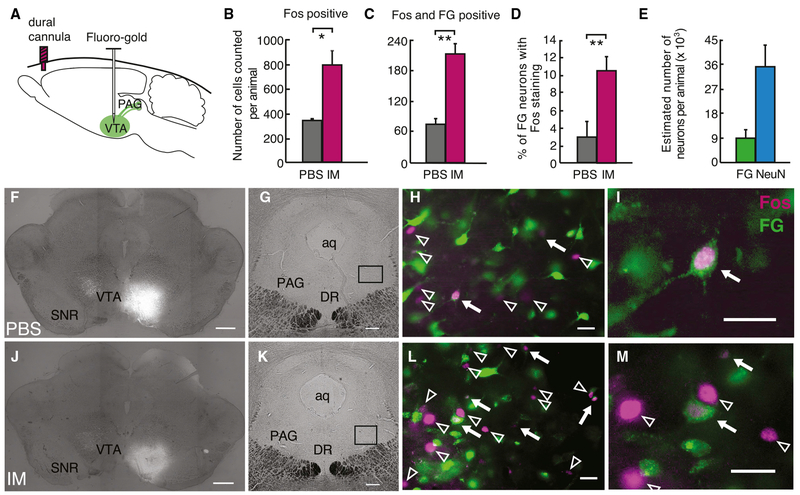
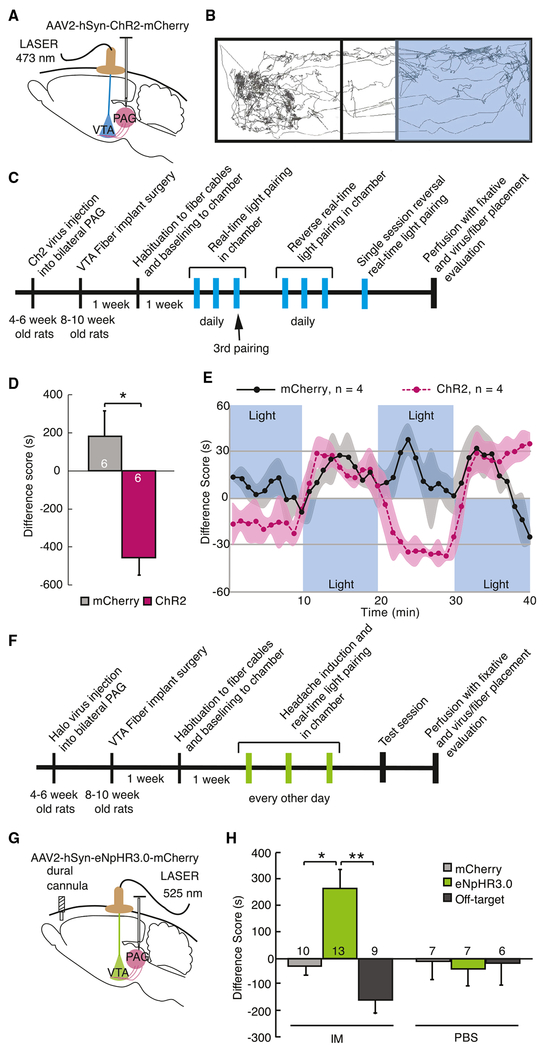
Migraines are a major health burden, but treatment is limited because of inadequate understanding of neural mechanisms underlying headache. Imaging studies of migraine patients demonstrate changes in both pain-modulatory circuits and reward-processing regions, but whether these changes contribute to the experience of headache is unknown. Here, we demonstrate a direct connection between the ventrolateral periaqueductal gray (vlPAG) and the ventral tegmental area (VTA) that contributes to headache aversiveness in rats. Many VTA neurons receive monosynaptic input from the vlPAG, and cranial nociceptive input increases Fos expression in VTA-projecting vlPAG neurons. Activation of PAG inputs to the VTA induces avoidance behavior, while inactivation of these projections induces a place preference only in animals with headache. This work identifies a distinct pathway that mediates cranial nociceptive aversiveness.

Keywords: headache; migraine; periaqueductal gray; ventral tegmental area; ventrolateral PAG.


Conflict of interest statement

DECLARATION OF INTERESTS

The authors declare no competing interests.

Figures

Figure 1.
Figure 1.. Fibers from the vlPAG Are Distributed throughout the VTA
(A) Schematic of AAV2-hSyn-ChR2-mCherry injections into bilateral vlPAG. (B) Sample horizontal slice with bilateral virus injection sites into the vlPAG marked in magenta (Aq, aqueduct; DR, dorsal raphe; scale bar, 500 μm). (C) Cell bodies in the PAG with mCherry expression (magenta; scale bar, 250 μm). (D) Sample horizontal brain slice with mCherry-fiber expression and TH immunocytochemical labeling, acquired and stitched with 2D slide scan in MBF Stereoinvestigator (green; scale bar, 250 μm). (E and F) Confocal images at high magnification of TH(+) neurons (green) in the VTA surrounded by mCherry bouton-like profiles (E) and axon fibers (F) from the vlPAG (magenta; scale bar, 20 μm).
Figure 2.
Figure 2.. Most VTA Neurons Receive Synaptic Inputs from the vlPAG
(A) Schematic of bilateral injection of AAV2-hSyn-ChR2-mCherry into vlPAG. 4-6 weeks after injection, acute VTA slice from 20 animals were prepared for whole-cell recordings. (B) Graphical representation of the number of VTA neurons with light-stimulated synaptic potentials following ChR2 expression in vlPAG neurons. (C and D) Example responses to brief, 470 nm light pulses recorded in voltage clamp. Magenta trace (C); after bath application of 10 μM DNQX at holding potential of −60 mV (scale bar, 20 pA, 10 ms). Yellow trace (D); after 10 μM gabazine at holding potential of −40 mV (scale bar, 5 pA, 10 ms). Insets: responses to voltage steps demonstrating Ih (scale bar, 200 pA, 100 ms). (E) Sample traces from an individual neuron receiving both excitatory and inhibitory light-evoked post-synaptic currents with holding potential at −60 mV using a high-chloride (KCI) internal solution (scale bar, 20 pA, 10 ms). Inset: response to voltage steps (scale bar, 100 pA, 100 ms). (F) EPSC amplitudes recorded at −60 mV using K-gluconate internal solution, plotted before and after DNQX application. Each circle represents one neuron; white circles represent presumed glutamatergic responses, but DNQX was not bath applied. (G) IPSC amplitudes recorded at −40 mV holding potential reduced with gabazine (white circles not tested with gabazine). (H) Excitatory (magenta) and inhibitory (yellow) inputs from the vlPAG converge onto a proportion of VTA neurons from 35 neurons in which EPSCs and IPSCs could be differentiated. (I) EPSC amplitudes in confirmed non-dopamine neurons compared with TH(+) neurons. (J) IPSC amplitudes in confirmed non-dopamine neurons compared with TH(+) neurons. See also Figures S1 and S2.
Figure 3.
Figure 3.. A Subset of PAG Neurons that Project to the VTA Is Activated with Headache
(A) Schematic of retrograde marker Fluoro-Gold (FG) injection into the VTA. 5-7 days after injections, animals were treated with dural PBS or IMs. Two hours later, animals underwent intracardiac perfusion with 4% paraformaldehyde, and coronal slices of the PAG were systematically collected and labeled with a Fos antibody. (B and C) Number of Fos(+) cells (B) and double-labeled Fos- and FG-positive cells (C) counted using stereological methods in the vlPAG using an optical fractionator probe (n = 3 animals per condition, *p < 0.05, **p < 0.01). (D) Percentage of FG-positive cells that were also Fos(+) (**p < 0.005). (E) Estimated number of FG- and NeuN-positive cells in the vlPAG (n = 3 animals). All plots represent mean ± SEM. ((F-M) Example coronal slices in animals treated with dural PBS (F, G, H, and I) or IM (J, K, L, and M). (F and J) Images in (F) and (J), demonstrating unilateral VTA injection sites, were acquired and stitched with 2D slide scan in MBF Stereoinvestigator (scale bar, 500 μm). (G and K) Coronal vlPAG slices, with indication of the locations of higher-magnification images in (H) and (L), respectively (scale bar, 250 μm). (H and L) Fos(+) cells (magenta) and FG-positive cells (green) in the vlPAG. White arrows indicate Fos-labeled cells, and arrowheads indicate double-labeled neurons (scale bar, 25 μm). (I and M) High magnification of Fos(+) cells with and without FG double-labeling (scale bar, 25 μm).
Figure 4.
Figure 4.. Activation of vlPAG-to-VTA Afferents Is Aversive and Required for Headache Aversiveness
(A) Schematic of surgical preparation using ChR2 to selectively activate vlPAG axon terminals in the VTA in 3 replicate groups. Control animals were injected with sham virus, AAV2-hSyn-mCherry. 6-8 weeks later, optical fibers were implanted, bilaterally aimed at the VTA. Animals showed no chamber bias at baseline. (B) Example track tracing of an animal during testing in which blue light (473 nm, 20 Hz, 5 ms pulse, 10-12 mW) commenced when the rat entered the right side of the chamber and was turned off when animal exited that side of the chamber. (C) Timeline of the real-time optical stimulation place pairing protocol. Animals were placed in the test chamber for 20-min sessions daily in which blue light stimulation was paired with one side of the chamber. After 3 sessions with light paired with one side of the chamber, light was then paired to the opposite chamber for 3 daily 20-min sessions for reversal training. After 6 sessions, 4 animals underwent a 40-min session in which light pairing was reversed every 10 min. (D) During the 3rd training session, animals with active ChR2 virus infection avoided the chamber with light stimulation compared with animals injected with sham virus. The difference score is calculated as the time spent in the stimulation-paired chamber minus the time spent in the nostimulation chamber (*p < 0.05). Plot represents mean ± SEM. (E) Averaged real-time difference score from 4 animals during the last session, with stimulation alternating between chambers every 10 min. (F) Timeline of the real-time optical inhibition place pairing protocol. Animals from 5 replicate groups received either intradural IMs or PBS 5 min before being placed into the test chamber. After 3 daily 20-min sessions of green light pairing (525 nm, 16-18 mW) with one side of the chamber, animals were tested the following day in the chamber without light inhibition. (G) Schematic of surgical preparation for the behavioral experiment using halorhodopsin to selectively silence vlPAG inputs to the VTA after dural IMs to induce headache. Sham virus or AAV2-hSyn-eNpHR3.0-mCherry was injected into the vlPAG. Bilateral optical fibers were implanted directed to the VTA 6-8 weeks later. (H) Difference scores were measured during the testing session with no stimulation (*p < 0.05, **p < 0.01), demonstrating that inactivation of the vlPAG-to-VTA connection was appetitive only in rats that received IMs, suggesting it relievesthe aversive state induced by dural IMs. Plot represents mean ± SEM. See also Figure S4.

References

    1. Bandler R, and Depaulis A (1988). Elicitation of intraspecific defence reactions in the rat from midbrain periaqueductal grey by microinjection of kainic acid, without neurotoxic effects. Neurosci. Lett 88, 291–296. - PubMed
    1. Barbaresi P, and Manfrini E (1988). Glutamate decarboxylase-immunoreactive neurons and terminals in the periaqueductal gray of the rat. Neuroscience 27, 183–191. - PubMed
    1. Behbehani MM (1995). Functional characteristics of the midbrain periaqueductal gray. Prog. Neurobiol 46, 575–605. - PubMed
    1. Behbehani MM, and Fields HL (1979). Evidence that an excitatory connection between the periaqueductal gray and nucleus raphe magnus mediates stimulation produced analgesia. Brain Res. 170, 85–93. - PubMed
    1. Bonafede M, Sapra S, Shah N, Tepper S, Cappell K, and Desai P (2018). Direct and Indirect Healthcare Resource Utilization and Costs Among Migraine Patients in the United States. Headache 58, 700–714. - PubMed

Publication types

MeSH terms

Substances