. 2019 Sep 10;28(11):2807-2823.e5.
doi: 10.1016/j.celrep.2019.08.014.

Control of Intestinal Cell Fate by Dynamic Mitotic Spindle Repositioning Influences Epithelial Homeostasis and Longevity

Affiliations

Control of Intestinal Cell Fate by Dynamic Mitotic Spindle Repositioning Influences Epithelial Homeostasis and Longevity

Daniel Jun-Kit Hu et al. Cell Rep. .

Abstract

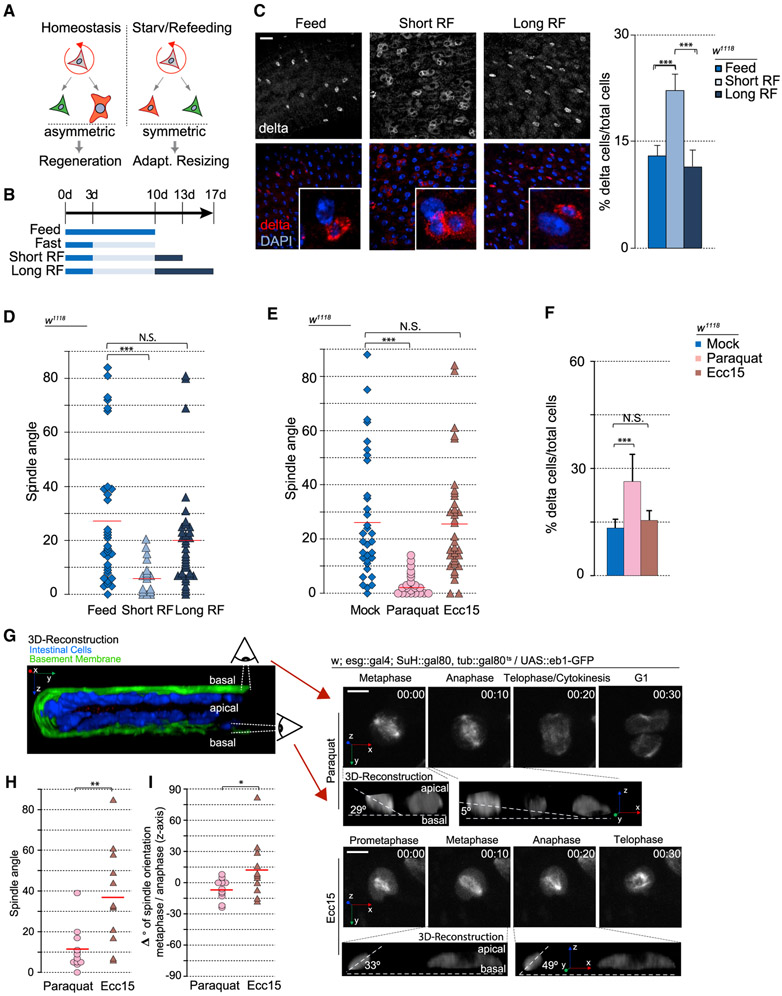
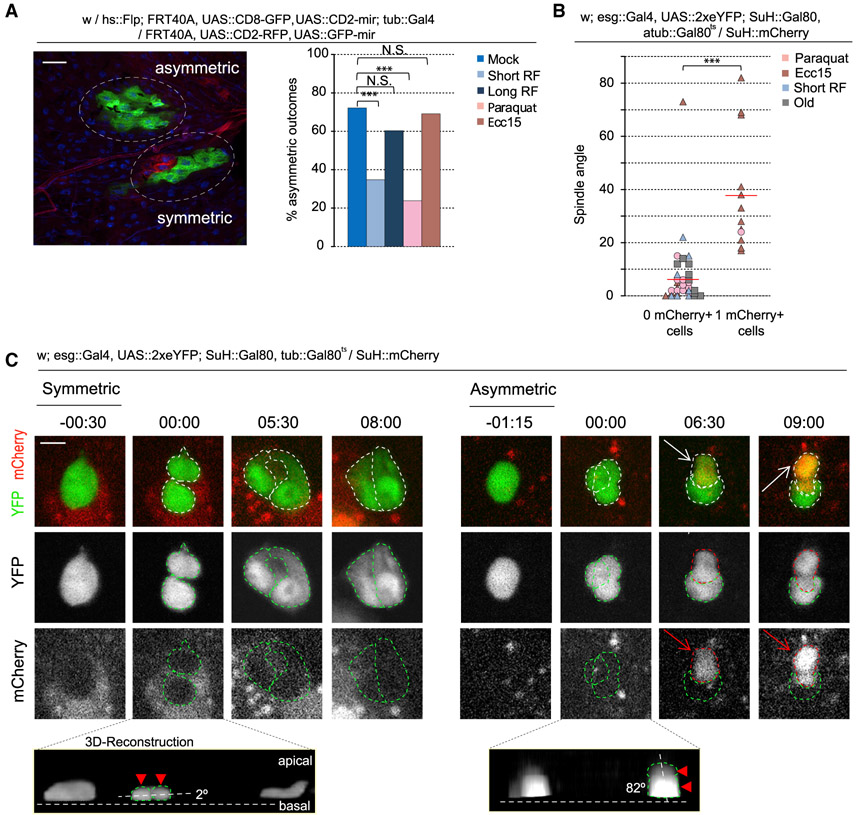
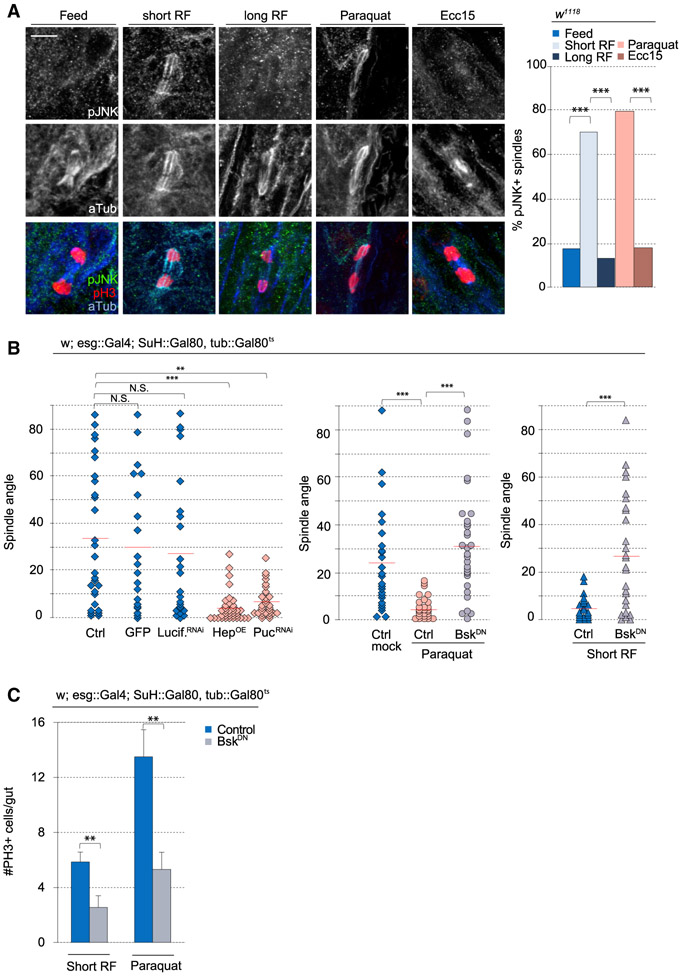
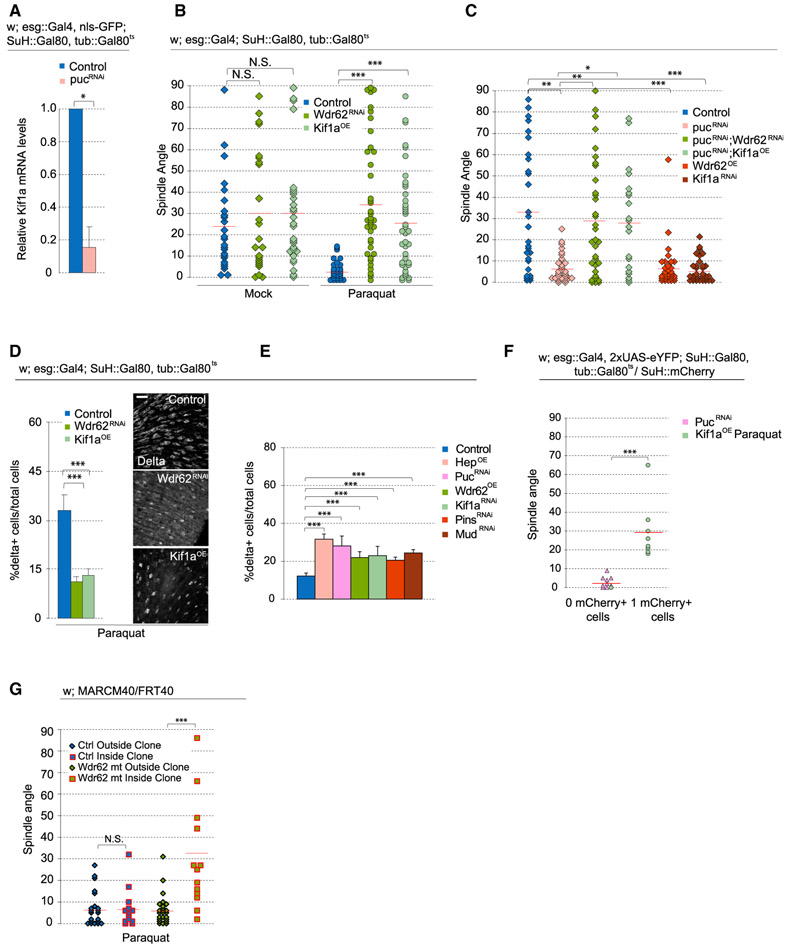
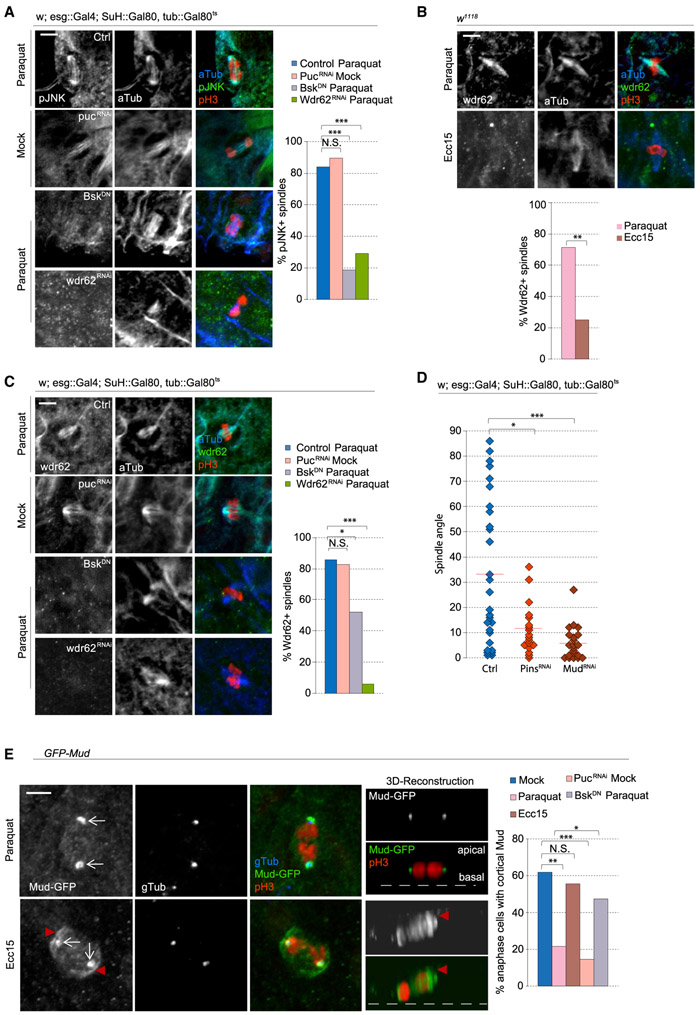
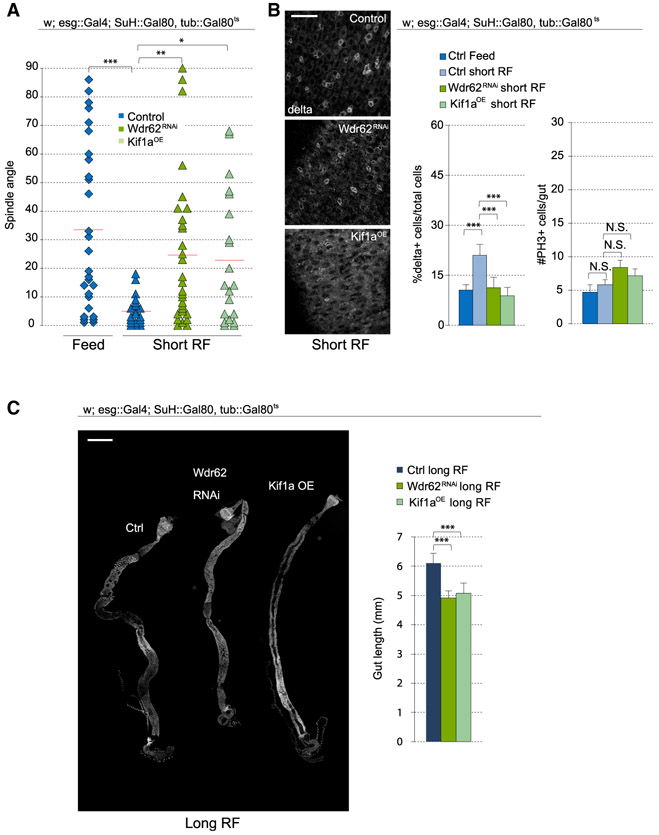
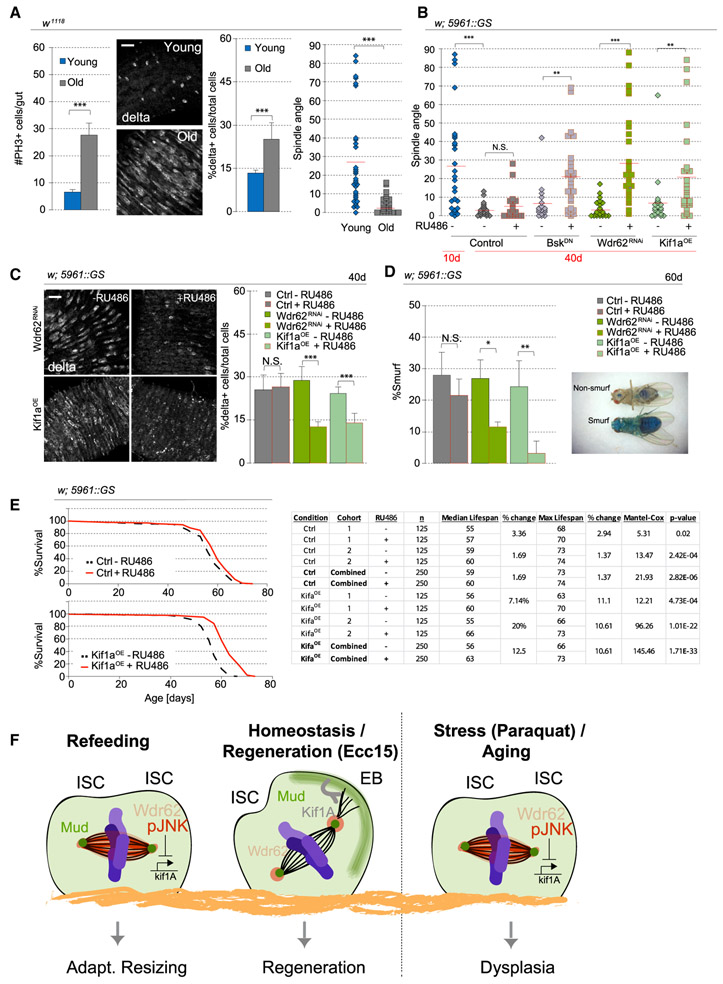
Tissue homeostasis depends on precise yet plastic regulation of stem cell daughter fates. During growth, Drosophila intestinal stem cells (ISCs) adjust fates by switching from asymmetric to symmetric lineages to scale the size of the ISC population. Using a combination of long-term live imaging, lineage tracing, and genetic perturbations, we demonstrate that this switch is executed through the control of mitotic spindle orientation by Jun-N-terminal kinase (JNK) signaling. JNK interacts with the WD40-repeat protein Wdr62 at the spindle and transcriptionally represses the kinesin Kif1a to promote planar spindle orientation. In stress conditions, this function becomes deleterious, resulting in overabundance of symmetric fates and contributing to the loss of tissue homeostasis in the aging animal. Restoring normal ISC spindle orientation by perturbing the JNK/Wdr62/Kif1a axis is sufficient to improve intestinal physiology and extend lifespan. Our findings reveal a critical role for the dynamic control of SC spindle orientation in epithelial maintenance.

Keywords: Drosophila; JNK; Kif1a; Wdr62; aging; cell fate; growth; intestinal stem cell; regeneration; spindle orientation.


Conflict of interest statement

DECLARATION OF INTERESTS

The authors declare no competing interests.

Figures

Figure 1.
Figure 1.. Spindle Orientation Responds to Different Environmental Perturbations
(A) Diagram representing different modes of ISC division in response to different environmental challenges. (B) Timeline of fasting and refeeding conditions. (C) Percentage of D1+ cells (ISCs) increased after short-term refeeding but returned to baseline levels after long-term refeeding. Insets depict a likely clone. (D and E) Quantification of spindle orientation after refeeding conditions (D) and Paraquat treatment versus Ecc15 infection (E). (F) Percentage of D1+ cells increased after paraquat treatment, but not after Ecc15 infection. (G) Intestines imaged live ex vivo (hours:minutes). Insets depict 3D reconstruction. (H) Spindle orientation in live ISCs mimicked that of fixed cells. (I) Changes in spindle orientation between metaphase and anaphase. Mean ± SD (C and F); n = 9 flies (C and F) and n = 11 cells from 6 flies (H and I), with spindle orientation quantified from 15–30 flies (D and E); N.S., not significant; *p < 0.05, **p < 0.01, ***p < 0.001, based on a Kruskal-Wallis test (C–F) or Mann-Whitney test (H and I). Red bar, mean (D, E, H, and I). Scale bars, 20 μm (C) and 5 μm (G). See also Figure S1 and Videos S1 and S2.
Figure 2.
Figure 2.. Spindle Orientation Is an Indicator of Cell Fate
(A) Quantification and representative image of twin-spot clones. (B and C) Quantification (B) and montage (C) of symmetric versus asymmetric outcomes after live imaging of ex vivo intestines. Telophase-cytokinesis was set at 00:00 (hours:minutes). During a symmetric outcome, the dividing cell (−00:30–00:00) forms two daughter cells that remain mCherry− for the duration of the video (08:00). During an asymmetric outcome, the dividing cell (−01:15–00:00) forms two daughter cells. One of the daughter cells remains mCherry−, whereas the other daughter cell becomes mCherry+ (arrow, 06:30). Cell bodies are outlined with green for mCherry− and red for mCherry+. Insets depict 3D reconstruction of the two segregating cell bodies (arrowhead and outlined). Mean ± SD; n = 133 (young), 112 (short-term refeed), 63 (long-term refeed), 42 (paraquat), and 84 (Ecc15) clones from ≥ 10 flies per condition (A), with spindle orientation quantified from 26 flies (B); N.S., not significant; ***p < 0.001, based on a chi-square test (A) or Mann-Whitney test (B). Red bar, mean (B). Scale bars, 20 μm (A) and 5 μm (C). See also Figures S2-S4 and Videos S3, S4, S5, S6, S7, and S8.
Figure 3.
Figure 3.. JNK Activity Promotes Planar Spindle Orientation
(A) Triple staining with anti-phosphorylated-JNK (pJNK), anti-phospho-histone H3 (PH3), and anti-α-tubulin revealed pJNK localization at the spindle after paraquat or short-term refeeding. (B) Quantification of spindle orientation. (C) Quantification of mitotic ISCs in whole gut after BskDN expression. Mean ± SEM (C); n ≥ 20–28 cells from ≥ 16 flies (A), n = 9 flies (BskDN Short RF), or n ≥ 16 flies (C), with spindle orientation quantified from 18–35 flies per condition (B); N.S., not significant; **p < 0.01, ***p < 0.001, based on a chi-square test (A), Kruskal-Wallis test (B), or Mann-Whitney test (C). Red bar, mean (B). Scale bar, 5 μm. See also Figure S5.
Figure 4.
Figure 4.. Wdr62 RNAi and Kif1a Overexpression Rescues Stressed-Induced Effects on Spindle Orientation
(A) Relative mRNA levels of Kif1a, normalized to Actin5c, in ISCs were decreased after pucRNAi. (B and C) Quantification of spindle orientation after genetic perturbation. Expressing full-length Kif1a or Wdr62RNAi prevented the shift to planar spindles normally observed after Paraquat (B) or pucRNAi (C). Untreated, mock-treated, and paraquat-treated pucRNAi control data and were taken from Figure 3B, because experiments were done in parallel. (D and E) Quantification of the percentage of D1+ cells after expressing full-length Kif1a or Wdr62RNAi in Paraquat-treated flies (D) or after genetic perturbations that promoted planar spindles (E). (F) Long-term live imaging lineage tracing experiments revealed that PucRNAi generated symmetric lineages, whereas expressing full-length Kif1a in paraquat-treated flies gave rise to asymmetric lineages. (G) wdr62 loss of function restored oblique spindles despite paraquat treatment. Mean ± SD (A, D, and E); n = 3 samples, with 100 flies per sample (A), and n = 9 flies (D and E), with spindle orientation quantified from ≥25 flies (B and C), 4 flies for PucRNAi and 6 flies for Kif1aOE(F), or ≥15 flies (G) per condition; N.S., not significant; *p < 0.05, **p < 0.01, ***p < 0.001, based on a Mann-Whitney test (A, F, and G) or Kruskal-Wallis test (B–E). Red bar, mean (B, C, F, and G). Scale bar, 20 μm. See also Figure S6 and Videos S9 and S10.
Figure 5.
Figure 5.. pJNK and Wdr62 Localization to the Spindle Prevents the Recruitment of Cortical Mud
(A) Triple staining with anti-pJNK, anti-phospho-histone H3 (PH3), and anti-α-tubulin to test for pJNK localization at the spindle after genetic perturbations. (B and C) Triple staining with anti-Wdr62, anti-PH3, and anti-α-tubulin revealed Wdr62 localization at the mitotic spindle after Paraquat treatment (B) or JNK induction (C). (D) Depletion of Mud and Pins caused a loss of oblique spindles. (E) Overexpression of GFP-Mud revealed localization at the centrosome (arrow) and the cell cortex (arrowhead). The percentage of anaphase cells with cortical Mud was quantified. n ≥ 20 cells from ≥12 flies (A, B, C, and E), with spindle orientation quantified from ≥15 flies per condition (D); N.S., not significant; *p < 0.05, **p < 0.01, ***p < 0.001, based on a chi-square test (A, B, C, and E) or Kruskal-Wallis test (D). Red bar, mean (D). Scale bar, 5 μm. See also Figure S6.
Figure 6.
Figure 6.. Regulation of Spindle Orientation during Adaptive Growth Depends on Wdr62 and Kif1a
(A) Quantification of spindle orientation after short-term refeeding. Control data for feeding and short-term refeeding were taken from Figure 3B and justified by pooling cells from 18+ flies over 5+ independent experiments. (B) Percentage of D1+ cells (ISCs) was reduced after Wdr62RNAi or Kif1a overexpression in short-term refed conditions. The number of PH3+ cells in the gut was not affected. (C) Gut length was decreased after Wdr62RNAi or Kif1a overexpression. Mean ± SD (B, %D1+ cells, and C) or mean ± SEM (B, #PH3+ cells); n ≥ 9 flies (B, %D1+ cells, and C) and n ≥ 18 flies (B, #PH3+ cells), with spindle orientation quantified from ≥19 flies per condition (A); N.S., not significant; *p < 0.05, **p < 0.01, ***p < 0.001, based on a Kruskal-Wallis test (A–C). Red bar, mean (A). Scale bars, 20 μm (B) and 500 μm (C).
Figure 7.
Figure 7.. Rescuing Age-Associated Spindle Orientation Defects Restores Intestine Physiology
(A) Mitotic activity, the ratio of D1+ cells, and planar spindles increased in 40-day-old flies. Spindle orientation for young flies was taken from Figure 1H (fed flies), because young and fed flies have the same condition, and data were pooled from 16 flies over 8 independent experiments. (B) Quantification of spindle orientation. RU486 was fed to 36-day-old flies, and intestines were dissected from 40-day-old flies. (C) Quantification of the percentage of D1+ cells. RU486 was fed to 36-day-old flies, and intestines were dissected from 40-day-old flies. (D) RU486, mixed with blue dye no. 1 in normal food, was fed to 30-day-old females continuously. Intestinal barrier function was assayed by the presence of blue dye strictly in the intestine versus the entirety of the fly. Quantification of the ratio of Smurf flies was performed at day 60. (E) RU486 was fed to 10-day-old females continuously until the end of the analysis. Kif1a expression resulted in a 12% increase in medial lifespan. Statistical analysis is in the chart. (F) Model of JNK-mediated regulation of spindle orientation through its interaction with Wdr62 to prevent recruitment of cortical Mud, and downregulation of kif1a transcript levels. Mean ± SD (A, %D1+ cells; C; and D) or mean ± SEM (A, #PH3+ cells); n = 9 flies (A, %D1+ cells, and C), n ≥ 20 flies (A, #PH3 cells), and n = 3–4 cohorts, with ≥30 flies per cohort (D) and spindle orientation data collected from 15–25 flies per condition (A, spindle angle, and B); N.S., not significant; *p < 0.05, **p < 0.01, ***p < 0.001, based on a Mann-Whitney test (A–D). Scale bar, 20 μm. See also Figure S7.

Similar articles

Cited by

References

    1. Ayyaz A, and Jasper H (2013). Intestinal inflammation and stem cell homeostasis in aging Drosophila melanogaster. Front. Cell. Infect. Microbiol 3, 98. - PMC - PubMed
    1. Bardin AJ, Perdigoto CN, Southall TD, Brand AH, and Schweisguth F (2010). Transcriptional control of stem cell maintenance in the Drosophila intestine. Development 137, 705–714. - PMC - PubMed
    1. Bellaúche Y, Radovic A, Woods DF, Hough CD, Parmentier ML, O’Kane CJ, Bryant PJ, and Schweisguth F (2001). The Partner of Inscuteable/Discs-large complex is required to establish planar polarity during asymmetric cell division in Drosophila. Cell 106, 355–366. - PubMed
    1. Biteau B, Hochmuth CE, and Jasper H (2008). JNK activity in somatic stem cells causes loss of tissue homeostasis in the aging Drosophila gut. Cell Stem Cell 3, 442–455. - PMC - PubMed
    1. Biteau B, Karpac J, Supoyo S, Degennaro M, Lehmann R, and Jasper H (2010). Lifespan extension by preserving proliferative homeostasis in Drosophila. PLoS Genet. 6, e1001159. - PMC - PubMed

Publication types

MeSH terms