. 2019 Sep 10;28(11):2979-2995.e4.
doi: 10.1016/j.celrep.2019.08.018.

A Hyperactive Form of unc-13 Enhances Ca2+ Sensitivity and Synaptic Vesicle Release Probability in C. elegans

Affiliations

A Hyperactive Form of unc-13 Enhances Ca2+ Sensitivity and Synaptic Vesicle Release Probability in C. elegans

Lei Li et al. Cell Rep. .

Abstract

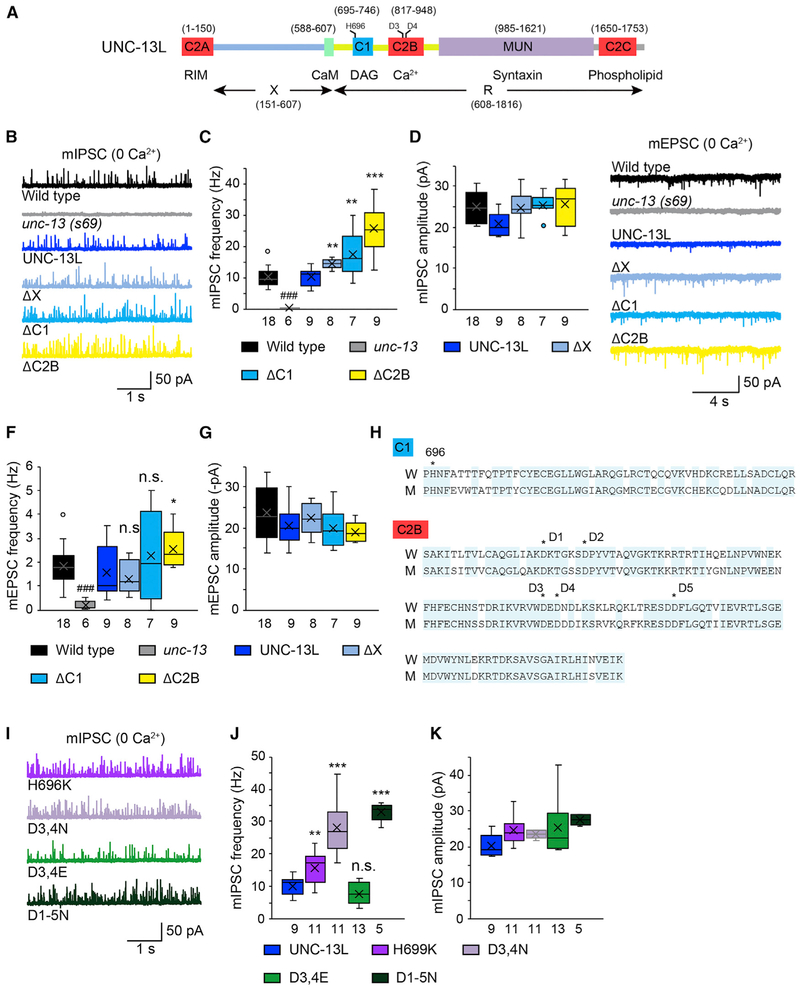
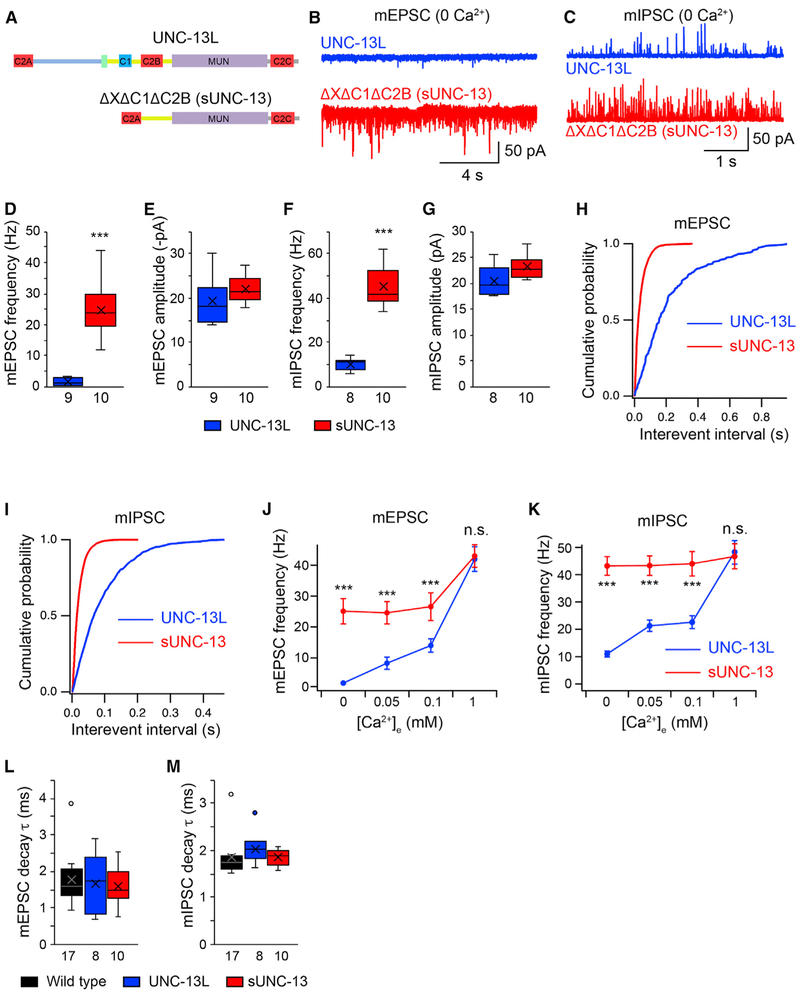
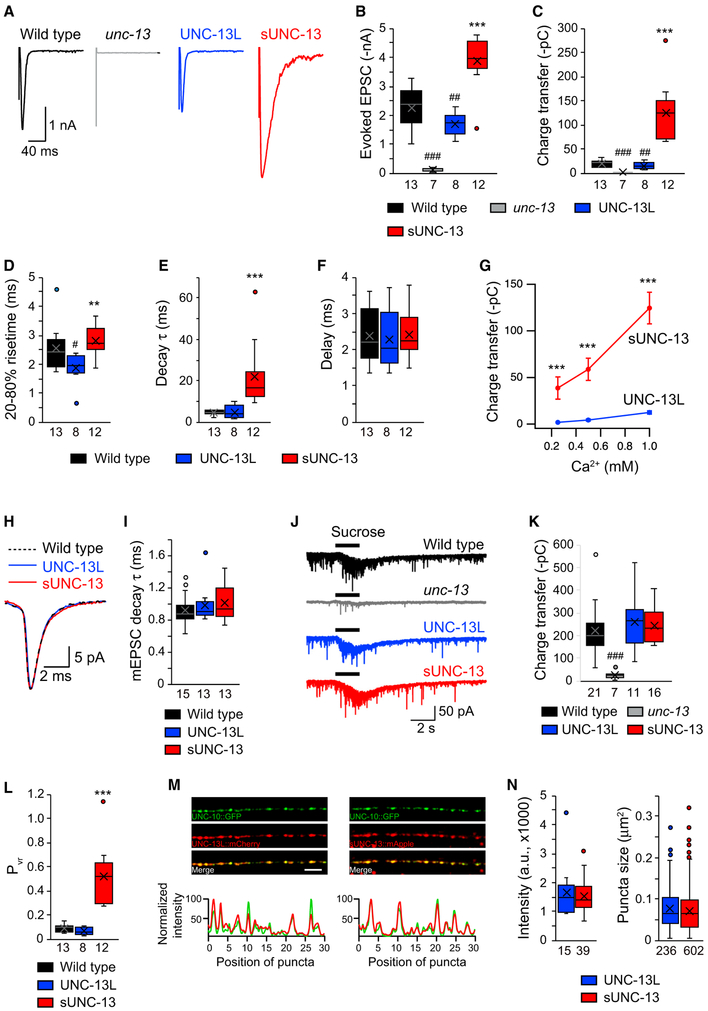
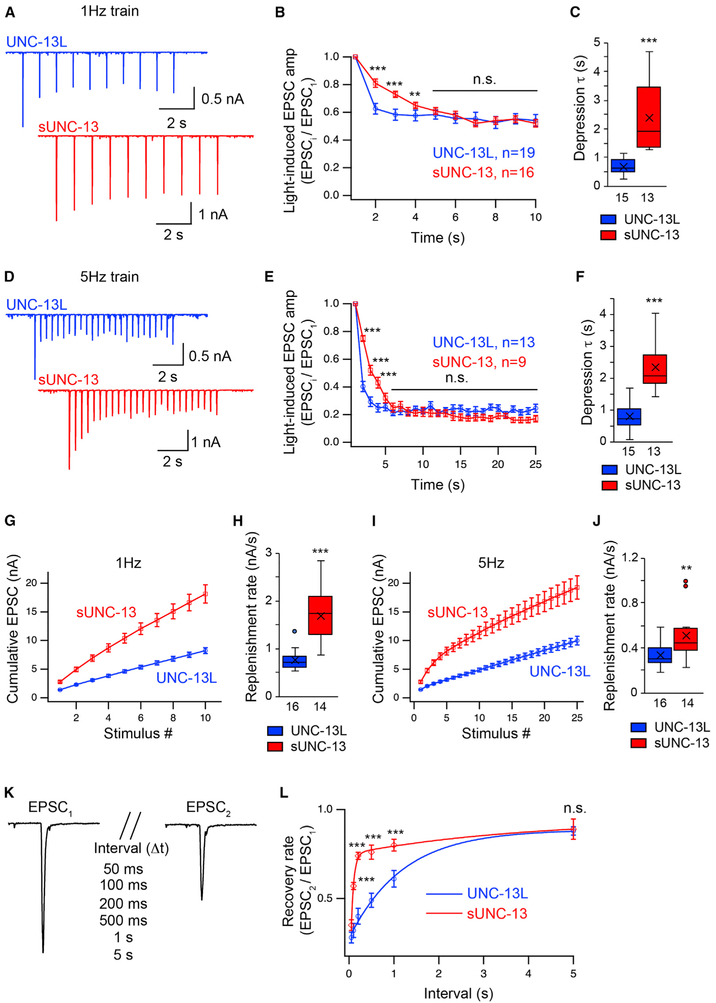
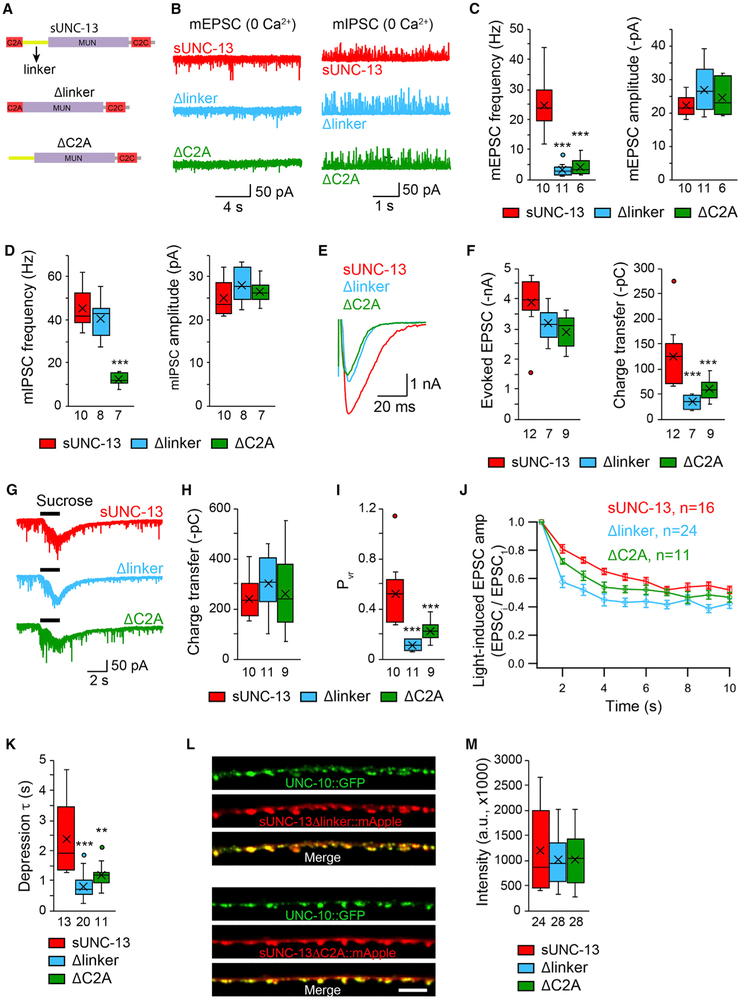
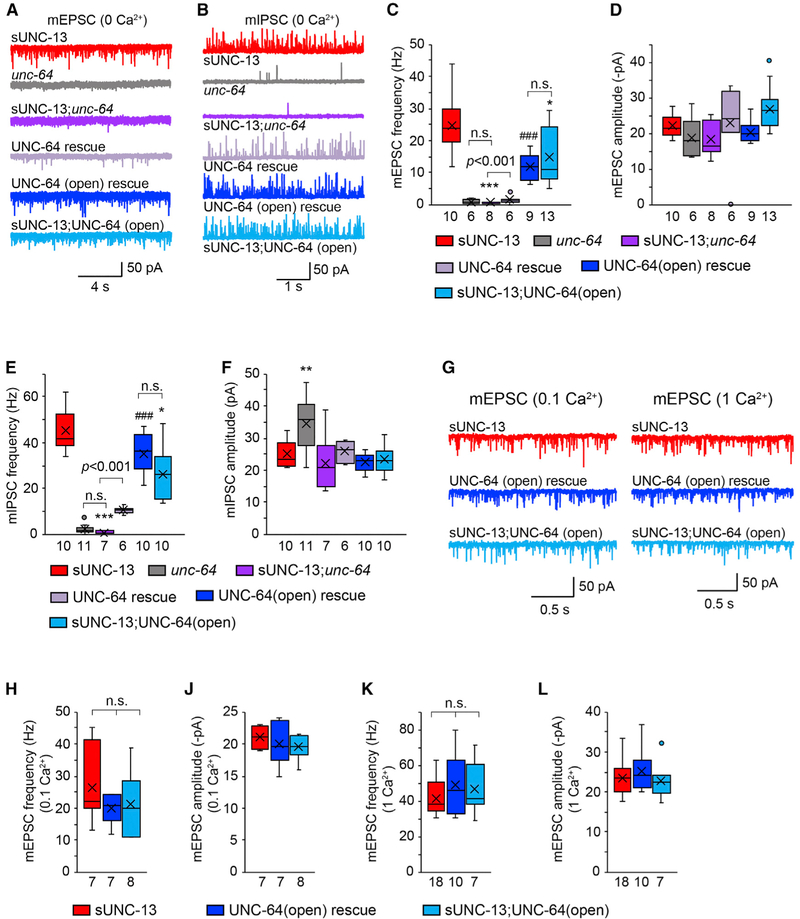
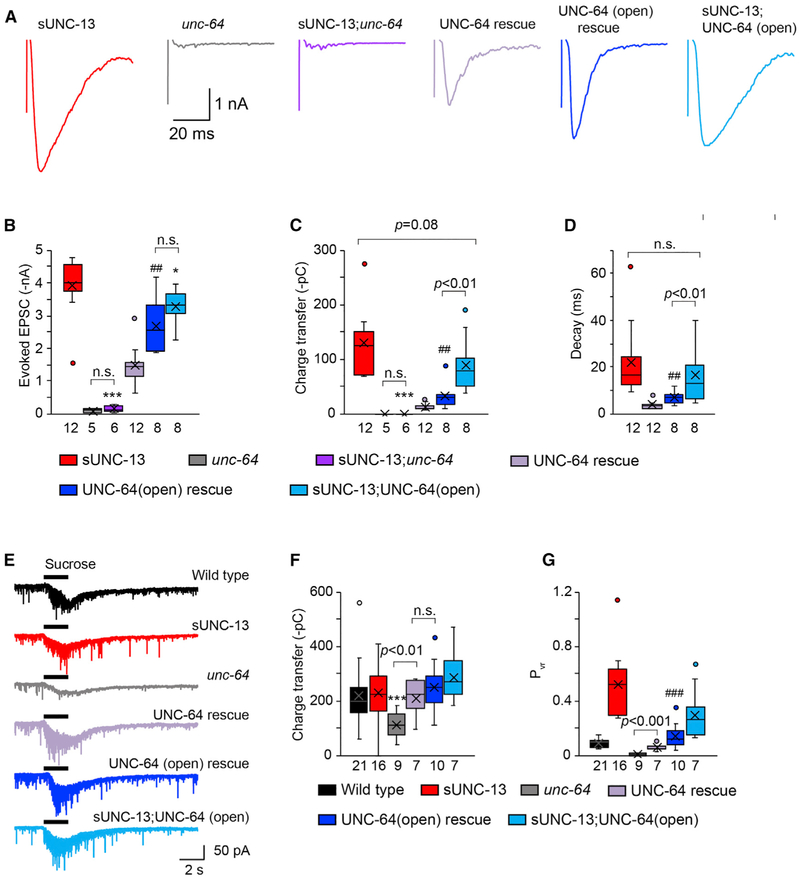
Munc13 proteins play several roles in regulating short-term synaptic plasticity. However, the underlying molecular mechanisms remain largely unclear. Here we report that C. elegans UNC-13L, a Munc13-1 ortholog, has three domains that inhibit synaptic vesicle (SV) exocytosis. These include the X (sequence between C2A and C1), C1, and C2B domains. Deleting all three inhibitory domains produces a hyperactive UNC-13 (sUNC-13) that exhibits dramatically increased neurotransmitter release, Ca2+ sensitivity of release, and release probability. The vesicular pool in unc-13 mutants rescued by sUNC-13 exhibits a faster synaptic recovery and replenishment rate, demonstrating an important role of sUNC-13 in regulating synaptic plasticity. Analysis of double mutants suggests that sUNC-13 enhances tonic release by increasing the open probability of UNC-64/syntaxin-1A, whereas its effects on evoked release appear to be mediated by additional functions, presumably by further regulating the activity of the assembled soluble N-ethylmaleimide-sensitive factor activating protein receptor (SNARE) complex.

Keywords: Ca(2+) sensitivity; evoked release; synaptic depression; synaptic transmission; syntaxin-1A; tonic release; unc-13.


Conflict of interest statement

DECLARATION OF INTERESTS

The authors declare no competing interests.

Figures

Figure 1.
Figure 1.. The X, C1, and C2B Domains in UNC-13L Inhibit Tonic Release
Miniature EPSCs were recorded from the body wall muscle of adult worms in a 0 mM Ca2+ solution. (A) Cartoon depicting the domain structure of UNC-13L. (B) Representative mIPSC traces from the indicated genotypes. (C and D) Quantification of the frequency (C) and amplitude (D) of the mIPSCs from the same genotypes as in (B). (E) Representative mEPSC traces from the indicated genotypes. (F and G) Average of the frequency (F) and amplitude (G) of the mEPSCs from the same genotypes as in (E). (H) Sequence alignment of the C1 and C2B domains between worm unc-13 and rat Munc13-1. Identical residues are highlighted (blue). The histidine (H) that is essential for DAG binding in the C1 domain and the five aspartates (D1-D5) that bind Ca2+ in the C2B domain are indicated with stars. (I) Representative mIPSC traces from the indicated genotypes. (J and K) Quantification of the frequency (J) and amplitude (K) of the mIPSCs from the same genotypes as in (I). Data are presented as box-and-whisker plots, with both the median (line) and mean (cross) indicated. ###p < 0.001 compared with the wild type; *p < 0.05, **p < 0.01, ***p < 0.001 compared with UNC-13L rescue; n.s., non-significant compared with UNC-13L rescue; one-way ANOVA test for the data in (D) and (G); oneway ANOVA following Kruskal-Wallis test for the data in (C), (F), (J), and (K). The number of worms analyzed for each genotype is indicated under each box.
Figure 2.
Figure 2.. UNC-13L Lacking the XC1C2B Domains Increases Tonic Release
(A) Domain structure of full-length UNC-13L and UNC-13LΔXΔC1ΔC2B (i.e., sUNC-13). (B and C) Representative mEPSC (B) and mIPSC (C) traces recorded from unc-13 mutants rescued by UNC-13L or UNC-13LΔXΔC1ΔC2B in 0 mM Ca2+. (D–G) Boxplots of mEPSC/mIPSC frequency and amplitude from the indicated genotypes. (H and I) Cumulative probability distributions of the interevent intervals of the mEPSCs (H) and mIPSCs (I) in UNC-13L and sUNC-13 rescue. (J and K) Quantification of the mEPSC (J) and mIPSC (K) frequencies at various Ca2+ levels (0, 0.05, 0.1, and 1 mM) from unc-13 mutants rescued by UNC-13L (blue) and sUNC-13 (red). (L and M) Quantification of the decay of the averaged mEPSCs (L) and mIPSCs (M). Data in (J) and (K) are presented as mean ± SEM, and all other data are shown as box-and-whisker plots with the median (line) and mean (cross) indicated. ***p < 0.001 compared with UNC-13L rescue; Mann-Whitney test for data in (D) and (G); Student’s t test for data in (E) and (F); one-way ANOVA test for (L) and (M). The number of worms analyzed for each genotype is indicated under each box.
Figure 3.
Figure 3.. sUNC-13 Increases Evoked Neurotransmitter Release without Changing the RRP
(A) Example traces of stimulus-evoked EPSCs recorded in 1 mM Ca2+ from wild-type (black), UNC-13L rescue (blue), and sUNC-13 rescue (red) animals. (B–F) Quantification of the evoked EPSC amplitude (B), charge transfer (C), 20%–80% rise time (D), decay (E), and delay (F) from the same genotype as in (A). (G) Evoked EPSCs recorded from various Ca2+ levels (0.25, 0.5, and 1 mM) from UNC-13L (blue) and sUNC-13 (red) rescue animals. (H) Example traces of averaged mEPSCs from the indicated genotypes. (I) Quantification of the decay τ of the mEPSCs. (J) Hypertonic sucrose-evoked current recorded from wild-type (black) and unc-13 mutants rescued by UNC-13L (blue) or sNC-13 rescue (red). (K) Averaged charge transfer from the sucrose-evoked currents in (H). (L) Quantification of the probability of synaptic vesicle release (Pvr) from the indicated genotypes. (M) Top: representative confocal z stack images for UNC-13L and UNC-10/RIM (left) and sUNC-13 and UNC-10/RIM (right). Scale bar, 5 μm. Bottom: line scans along the dorsal nerve cord. (N) Quantification of the fluorescence intensity and punctum size of UNC-13L::mApple and sUNC-13::mApple. Data in (G) are presented as mean ± SEM, and all other data are shown as box-and-whisker plots with median (line) and mean (cross) indicated. #p < 0.05, ##p < 0.01, ###p < 0.001 compared with the wild type; **p < 0.01, ***p < 0.001 compared with UNC-13L rescue; Student’s t test for data in (G), one-way ANOVA following Kruskal-Wallis test for data in (B) and (C), and one-way ANOVA for all other data. The number of worms analyzed for each genotype is indicated under each box.
Figure 4.
Figure 4.. sUNC-13 Weakens Synaptic Depression and Accelerates Synaptic Recovery
Synaptic depression and recovery were investigated by applying a train (1 Hz and 5 Hz) or a paired light stimulus onto the ventral nerve cord of UNC-13L (blue) and sUNC-13 (red) rescue worms with expression of ChIEF in their cholinergic motor neurons. (A) Example traces of 1-Hz light train stimulus-evoked EPSCs from UNC-13L and sUNC-13 rescue animals. (B) Quantification of synaptic depression by normalizing the EPSC amplitude (EPSCi) to the first EPSC amplitude (EPSC1) (n = 19 for UNC-13L rescue and n = 16 for sUNC-13 rescue). (C) Averaged depression τ of the normalized EPSC amplitude in (B). (D) Example traces of 5-Hz light train stimulus-evoked EPSCs from the same genotypes as in (A). (E) Quantification of synaptic depression by normalizing the EPSCi to EPSC1 (n = 13 for UNC-13L rescue and n = 9 for sUNC-13 rescue). (F) Averaged depression τ of the normalized EPSC amplitude in (E). (G and I) Averaged cumulative EPSC amplitudes during 1-Hz (G) and 5-Hz (I) trains. (H and J) Quantification of the replenishment rates in (G) and (I), respectively. (K) Evoked EPSCs triggered by a paired light stimulus with various intervals ranging from 50 ms to 5 s. (L) Averaged synaptic recovery, calculated by the ratio of EPSC2 to EPSC1, in UNC-13L and sUNC-13 rescue animals (UNC-13L rescue, 50 ms n = 6, 100 ms n = 6, 200 ms n = 10, 500 ms n = 7, 1 s n = 11, 5 s n = 7; sUNC-13 rescue, 50 ms n = 7, 100 ms n = 9, 200 ms n = 7, 500 ms n = 6, 1 s n = 7, 5 s n = 6). Data in (B), (E), (G), (I), and (L) are presented as mean ± SEM, and all other data are shown as box-and-whisker plots with both median (line) and mean (cross) indicated. **p < 0.01, ***p < 0.001 compared with UNC-13L rescue; Student’s t test for data in (B), (E), and (L); Mann-Whitney test for data in (C), (H), and (J). The number of worms analyzed for each genotype is indicated under each box.
Figure 5.
Figure 5.. The C2A and Linker Domains Are Essential for sUNC-13 Function
(A) Cartoon depicting the domain structure of sUNC-13, sUNC-13Δlinker, and sUNC-13ΔC2A. (B–D) Representative traces and boxplot of the frequency and amplitude of mEPSCs and mIPSCs recorded from sUNC-13 rescue, Δlinker rescue, and ΔC2A rescue animals in 0 mM Ca2+. (E and F) Representative traces and summary of the amplitude, charge transfer, and decay of the evoked EPSCs recorded from sUNC-13 rescue and Δlinker rescue and ΔC2A rescue in 1 mM Ca2+. (G–I) Example traces of hypertonic sucrose-evoked currents (G), averaged charge transfer of sucrose currents (H), and Pvr (I) from the indicated genotypes. (J) 1-Hz light train stimulus-triggered EPSCs from sUNC-13 rescue, Δlinker rescue, and ΔC2A rescue animals. (K) Synaptic depression, analyzed by the normalization of the amplitude of the EPSCs to the amplitude of the first EPSC. (L) Representative confocal z stack images for sUNC-13Δlinker and sUNC-13ΔC2A (tagged with mApple) and their colocalization with UNC-10/RIM (tagged with GFP). Scale bar, 5 μm. Bottom: line scans along the dorsal nerve cord. (M) Quantification of the fluorescence intensity of sUNC-13Δlinker::mApple and sUNC-13ΔC2A::mApple. Data in (J) are presented as mean ± SEM, and all other data are shown as box-and-whisker plots with median (line) and mean (cross) indicated. **p < 0.01, ***p < 0.001 compared with sUNC-13 rescue; one-way ANOVA test for data in (D), (H), and (M); one-way ANOVA following Kruskal-Wallis test for data in (C), (F), (I), and (K). The number of worms analyzed for each genotype is indicated under each box.
Figure 6.
Figure 6.. sUNC-13 Increases the Release Probability of Single SVs by Opening UNC-64/Syntaxin
(A and B) Representative traces of the mEPSCs (A) and mIPSCs (B) recorded from the indicated genotypes in 0 mM Ca2+. (C–F) Quantification of the frequencies and amplitudes of the mEPSCs and mIPSCs from the indicated genotypes in (A) and (B). (G) Representative traces of the mEPSCs recorded from the indicated genotypes in 0.1 mM and 1 mM Ca2+. (H–L) Averaged mEPSC frequencies and amplitudes from the same genotypes as in (G). Data are shown as box-and-whisker plots with median (line) and mean (cross) indicated. *p < 0.05, **p < 0.01, ***p < 0.001 compared with sUNC-13 rescue; ###p < 0.001 compared with UNC-64 rescue in unc-64 mutants; one-way ANOVA test for data in (C), (D), (F), and (H); one-way ANOVA following Kruskal-Wallis test for data in (E) and (J)–(L). The number of worms analyzed for each genotype is indicated under each box.
Figure 7.
Figure 7.. sUNC-13 Increases the Release Probability of Entire Synapses beyond Opening UNC-64/Syntaxin
(A) Example traces of stimulus-evoked EPSCs from the indicated genotypes. (B–D) Quantification of the amplitude (B), charge transfer (C), and decay (D) of the evoked EPSCs in (A). (E and F) Representative traces of sucrose-evoked current (E) and averaged charge transfer (F) from the indicated genotypes. (G) Quantification of the release probability of entire synapses (Pvr). Data are shown as box-and-whisker plots with median (line) and mean (cross) indicated. *p < 0.05, ***p < 0.001 compared with sUNC-13 rescue; ##p < 0.01, ###p < 0.001 compared with UNC-64 rescue in unc-64 mutants; one-way ANOVA test for data in (B), (C), and (G); one-way ANOVA following Kruskal-Wallis test for data in (D and (F). The number of worms analyzed for each genotype is indicated under each box.

Similar articles

Cited by

References

    1. Aravamudan B, Fergestad T, Davis WS, Rodesch CK, and Broadie K (1999). Drosophila UNC-13 is essential for synaptic transmission. Nat. Neurosci 2, 965–971. - PubMed
    1. Augustin I, Rosenmund C, Südhof TC, and Brose N (1999). Munc13-1 is essential for fusion competence of glutamatergic synaptic vesicles. Nature 400, 457–461. - PubMed
    1. Basu J, Betz A, Brose N, and Rosenmund C (2007). Munc13-1 C1 domain activation lowers the energy barrier for synaptic vesicle fusion. J. Neurosci 27, 1200–1210. - PMC - PubMed
    1. Borst JG, and Sakmann B (1996). Calcium influx and transmitter release in a fast CNS synapse. Nature 383, 431–434. - PubMed
    1. Borst JG, and Sakmann B (1999). Effect of changes in action potential shape on calcium currents and transmitter release in a calyx-type synapse of the rat auditory brainstem. Philos. Trans. R. Soc. Lond. B Biol. Sci 354, 347–355. - PMC - PubMed

Publication types

MeSH terms

LinkOut - more resources