. 2019 Sep 10;28(11):2996-3009.e7.
doi: 10.1016/j.celrep.2019.08.020.

A Unique Epigenomic Landscape Defines Human Erythropoiesis

Affiliations

A Unique Epigenomic Landscape Defines Human Erythropoiesis

Vincent P Schulz et al. Cell Rep. .

Abstract

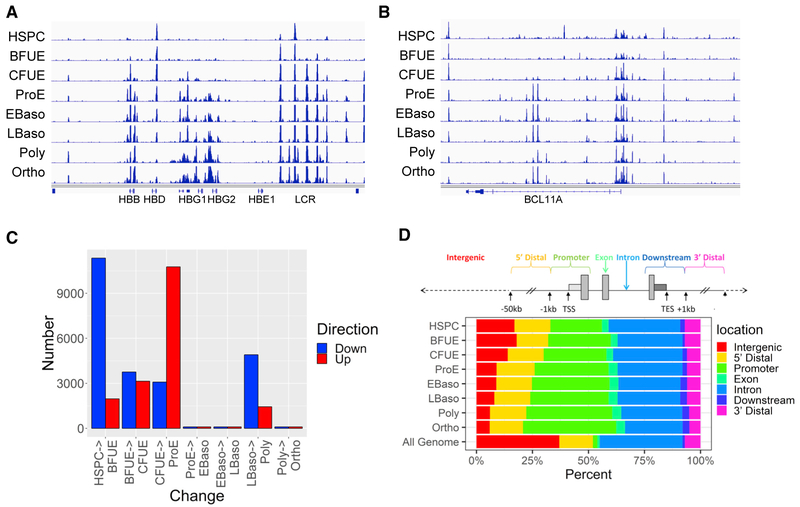
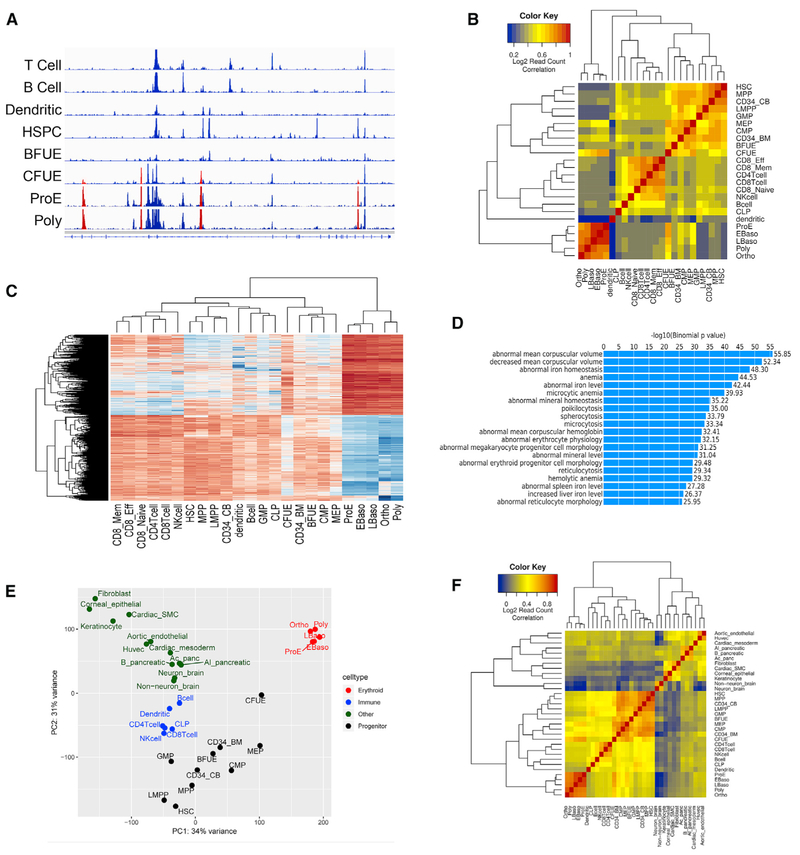
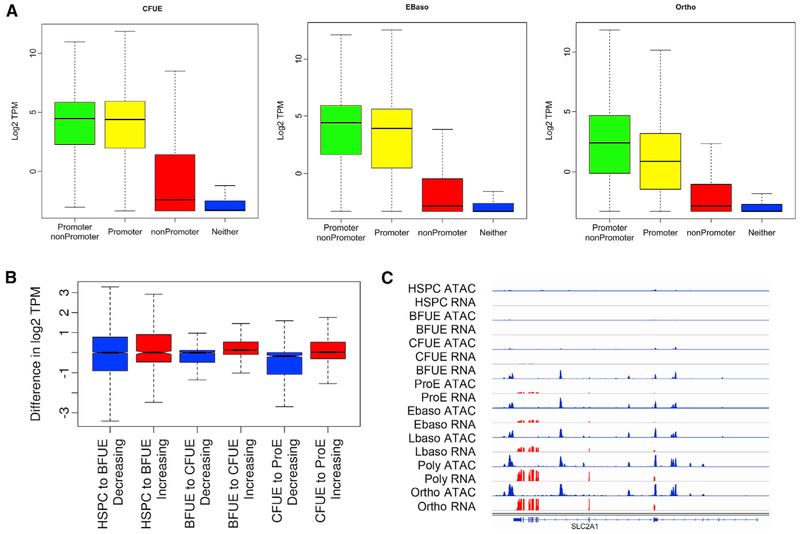
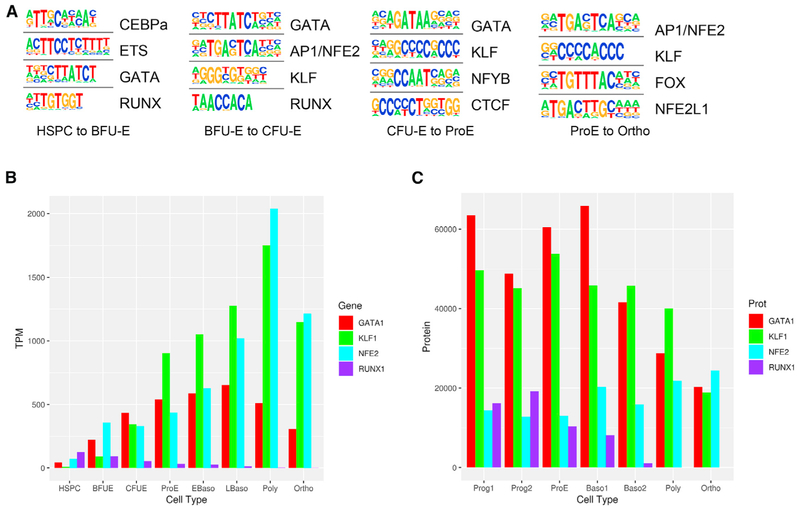
Mammalian erythropoiesis yields a highly specialized cell type, the mature erythrocyte, evolved to meet the organismal needs of increased oxygen-carrying capacity. To better understand the regulation of erythropoiesis, we performed genome-wide studies of chromatin accessibility, DNA methylation, and transcriptomics using a recently developed strategy to obtain highly purified populations of primary human erythroid cells. The integration of gene expression, DNA methylation, and chromatin state dynamics reveals that stage-specific gene regulation during erythropoiesis is a stepwise and hierarchical process involving many cis-regulatory elements. Erythroid-specific, nonpromoter sites of chromatin accessibility are linked to erythroid cell phenotypic variation and inherited disease. Comparative analyses of stage-specific chromatin accessibility indicate that there is limited early chromatin priming of erythroid genes during hematopoiesis. The epigenome of terminally differentiating erythroid cells defines a distinct subset of highly specialized cells that are vastly dissimilar from other hematopoietic and nonhematopoietic cell types. These epigenomic and transcriptome data are powerful tools to study human erythropoiesis.

Keywords: anemia; chromatin; epigenomic; erythrocyte; erythropoiesis; methylation; trait.


Conflict of interest statement

DECLARATION OF INTERESTS

The authors declare no competing interests.

Figures

Figure 1.
Figure 1.. Regions of Open Chromatin Identified during Erythropoiesis
(A) ATAC peaks at the β-globin-like gene locus. (B)ATAC peaks at the BCL11A gene locus. (C)Bar chart representation of differential changes in open chromatin as identified by ATAC peaks by stages of erythropoiesis, with sites of acquired ATAC peaks shown in red and sites of lost ATAC peaks shown in blue. (D)Distribution of ATAC peaks in human erythroid cells at differing stages of erythroid development and differentiation. The human genome was portioned into seven bins relative to RefSeq genes. The percentage of the human genome represented by each bin was color coded, and the distribution of ATAC peaks placed in each bin was graphed on the color-coded bar. The Genome Bar is a graphical representation of the relative proportions of the different location categories in the entire human genome. TES, transcriptional end site; TSS, transcriptional start site.
Figure 2.
Figure 2.. Erythroid Cells Exhibit Unique Stage- and Cell Type-Specific Patterns of Nonpromoter Chromatin Accessibility
(A)Chromatin accessibility at the HK1 locus demonstrating erythroid-specific (red) ATAC peaks. (B)Read count correlation of ATAC peaks in erythroid and nonerythroid hematopoietic cells. (C)Heatmap of differential ATAC regions between erythroid cells and other hematopoietic cell types. The regions at the top far right, representing terminal erythroid differentiation, show high accessibility in erythroid cells, and the regions at bottom have low accessibility in erythroid cells compared to other hematopoietic cell types. (D)GREAT (genomic regions enrichment of annotations tool) analysis of erythroid-specific regions of chromatin accessibility revealed significantly enriched terms for erythroid-related traits. The log10 binomial p value of each category is shown at right. (E)Principal-component analysis of patterns of chromatin accessibility in erythroid, nonerythroid hematopoietic, and nonhematopoietic cells. (F)Hierarchical cluster analysis shows terminally differentiating erythroid cells clustering separately from all of the other hematopoietic and nonhematopoietic cells (orange box, lower left corner).
Figure 3.
Figure 3.. Chromatin Accessibility and Gene Expression
Levels of gene expression determined by RNA-seq were correlated with the location of ATAC peaks in linked gene promoters, linked nonpromoter regions, both, or neither. (A)Patterns of gene expression associated with ATAC peak presence or absence as described are shown in CFU-E, early basophilic erythroblasts, and orthochromatic erythroblasts. (B)Levels of gene expression and gain or loss of ATAC peaks. In general, as gene loci acquired ATAC peaks, levels of gene expression increased. Shown here in the transitions from HSPC to BFU-E, BFU-E to CFU-E, and CFU-E to proerythroblast (ProE), the gene expression of linked genes that lost ATAC peaks (blue) is significantly lower than the expression of linked genes that gained ATAC peaks (red). (C)SLC2A1 gene locus. Patterns of chromatin accessibility denoted by ATAC peaks (blue) are apparent in erythroid differentiation before the onset of detectable gene expression identified by RNA-seq (red).
Figure 4.
Figure 4.. Transcription Factor Activity Changes across Erythropoiesis
(A)The top regulatory protein-binding sites identified by the HOMER algorithm searching ±50 bp from summits of differential increasing stage to stage ATAC peaks. The top four motifs ranked by p value are shown for erythroid cell type transitions. (B)Gene expression of critical erythroid transcription factors are shown for each stage of erythropoiesis. Transcriptome data are from An et al. (2014) and the present article. (C)Protein expression of critical erythroid transcription factors are shown for each stage of erythropoiesis. Protein data are from Gautier et al. (2016).
Figure 5.
Figure 5.. Chromatin Accessibility Bookmarking and Gene Expression
Sites of chromatin accessibility identified in HSPC, BFU-E, CFU-E, or ProE cells, respectively, and all of the other subsequent erythroid stages were defined as exhibiting bookmarking. (A and B) Examples of bookmarked regions of open chromatin in HSPCs in the HBS1L/MYB intergenic region (A) and the SOX6 locus (B) are shown. Both of these bookmarked sites contain SNPs (associated dbSNP identifiers) linked to genome-wide association study (GWAS)-associated erythroid cell phenotypic traits. (C and D) Comparison of gene expression of bookmarked-linked genes (red) compared to control, non-bookmarked genes (blue) is shown in BFU-E (C) and in CFU-E (D) cells.
Figure 6.
Figure 6.. Dynamic Changes in Methylation across Erythropoiesis
(A)Boxplots of the percentage of methylation of 5-kb genomic windows show a gradual decrease in methylation. (B)Dynamic changes in methylation in the regions of the RBM38 gene locus. Changes from DNA methylation (red, height indicates number of methylated reads) to demethylation (blue, height indicates number of unmethylated reads) are observed. (C)Numbers of differentially methylated regions are shown in 5-kb tiled regions across the genome. Red indicates regions of gained methylation and blue indicates regions of lost methylation. (D)Numbers of differentially methylated regions located in open chromatin. (E)Heatmap display of methylation levels (%) in open chromatin regions with dynamic methylation. (F)Dynamic changes in DNA methylation, alterations in chromatin configuration, and pattern of gene expression at the ZFPM1 gene locus.
Figure 7.
Figure 7.. Sites of Chromatin Accessibility Containing Genome-wide Association Study-Linked SNPs Linked to Erythroid Cell Traits
ATAC peaks were mapped onto the GWAS catalog of the National Human Genome Research Institute associated with erythroid cell terms. (A and B) Examples of erythroid-specific, erythroid trait-associated SNPs in ATAC peaks bookmarked in CFU-E cells are shown at the RCL1 gene locus (A, two SNPs) and the PIEZO1 gene locus (B, one SNP). (C) The x axis represents the 497 SNPs associated with erythroid cell traits ordered from right to left. The top of the heatmap (red) shows each ATAC peak that contains a GWAS erythroid-associated SNP by erythroid stage. The bottom half of the heatmap (blue) shows the trait associated with each ATAC peak-containing GWAS SNP. Many SNPs were bookmarked, and most were associated with more than one erythroid cell trait.

Similar articles

Cited by

References

    1. Abraham BJ, Cui K, Tang Q, and Zhao K (2013). Dynamic regulation of epigenomic landscapes during hematopoiesis. BMC Genomics 14, 193. - PMC - PubMed
    1. Akalin A, Garrett-Bakelman FE, Kormaksson M, Busuttil J, Zhang L, Khrebtukova I, Milne TA, Huang Y, Biswas D, Hess JL, et al. (2012a). Base-pair resolution DNA methylation sequencing reveals profoundly divergent epigenetic landscapes in acute myeloid leukemia. PLoS Genet. 8, e1002781. - PMC - PubMed
    1. Akalin A, Kormaksson M, Li S, Garrett-Bakelman FE, Figueroa ME, Melnick A, and Mason CE (2012b). methylKit: a comprehensive R package for the analysis of genome-wide DNA methylation profiles. Genome Biol. 13, R87. - PMC - PubMed
    1. An X, Schulz VP, Li J, Wu K, Liu J, Xue F, Hu J, Mohandas N, and Gallagher PG (2014). Global transcriptome analyses of human and murine terminal erythroid differentiation. Blood 123, 3466–3477. - PMC - PubMed
    1. Armstrong DL, Zidovetzki R, Alarcón-Riquelme ME, Tsao BP, Criswell LA, Kimberly RP, Harley JB, Sivils KL, Vyse TJ, Gaffney PM, et al. (2014). GWAS identifies novel SLE susceptibility genes and explains the association of the HLA region. Genes Immun. 15, 347–354. - PMC - PubMed

Publication types

MeSH terms