

Regenerative Effect of Growth Hormone (GH) in the Retina after Kainic Acid Excitotoxic Damage
- PMID: 31509934
- PMCID: PMC6770150
- DOI: 10.3390/ijms20184433
Regenerative Effect of Growth Hormone (GH) in the Retina after Kainic Acid Excitotoxic Damage
Abstract
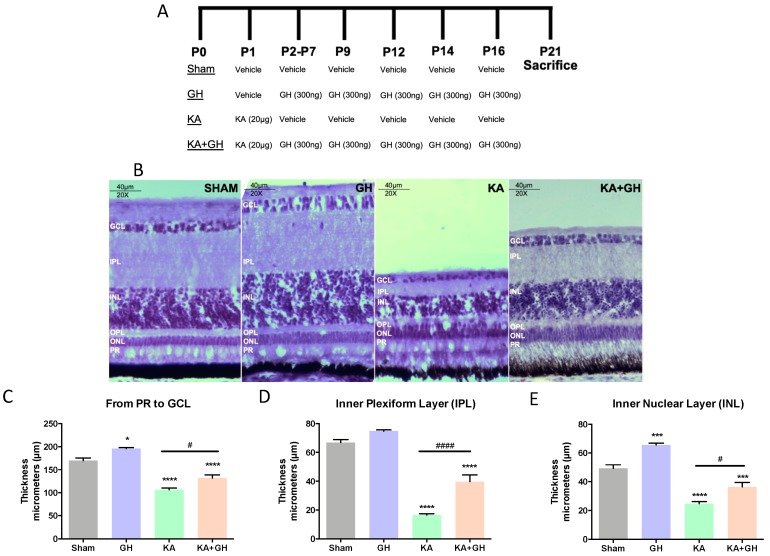
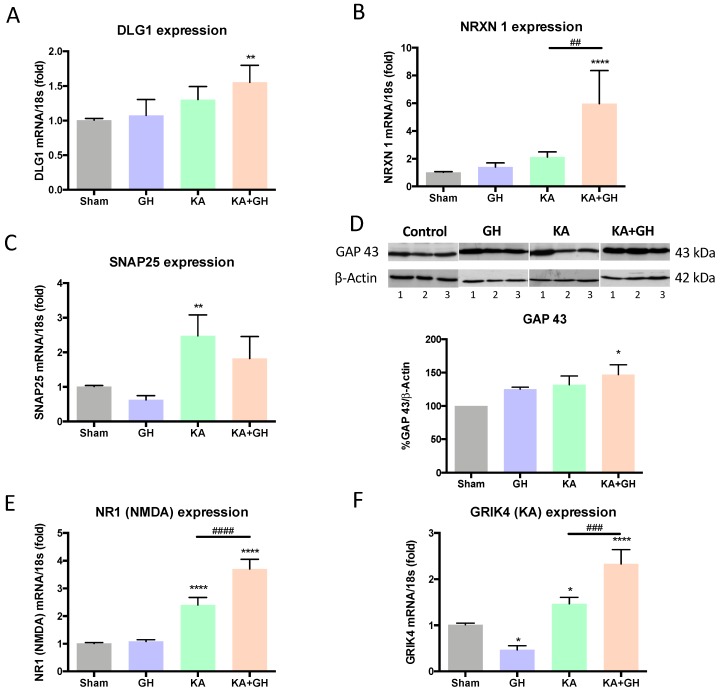
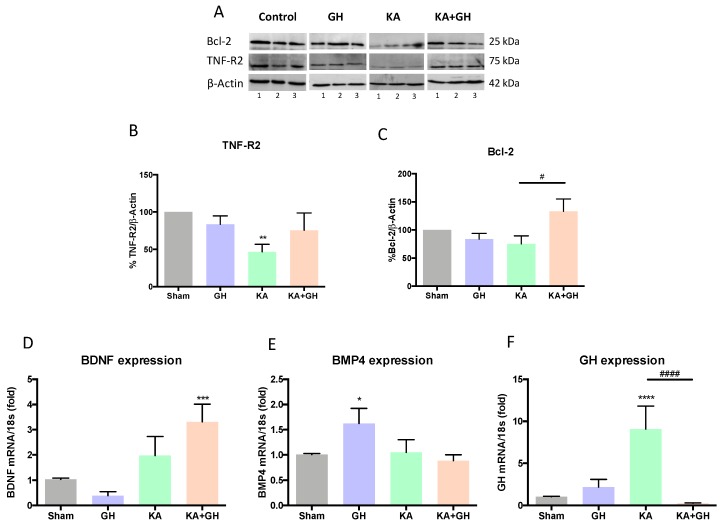
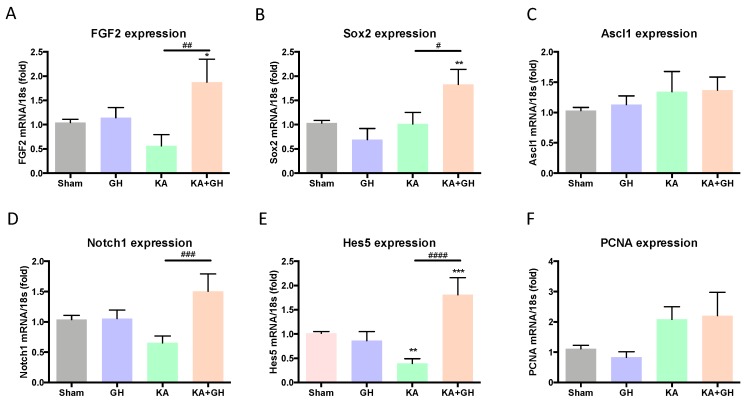
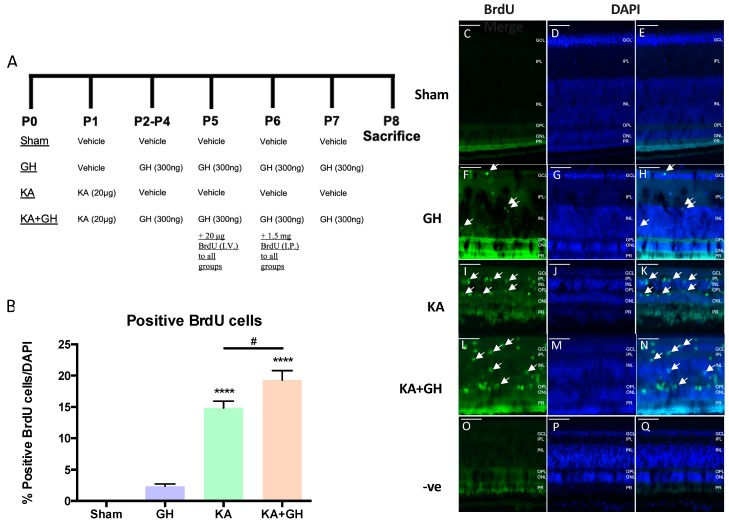
In addition to its role as an endocrine messenger, growth hormone (GH) also acts as a neurotrophic factor in the central nervous system (CNS), whose effects are involved in neuroprotection, axonal growth, and synaptogenic modulation. An increasing amount of clinical evidence shows a beneficial effect of GH treatment in patients with brain trauma, stroke, spinal cord injury, impaired cognitive function, and neurodegenerative processes. In response to injury, Müller cells transdifferentiate into neural progenitors and proliferate, which constitutes an early regenerative process in the chicken retina. In this work, we studied the long-term protective effect of GH after causing severe excitotoxic damage in the retina. Thus, an acute neural injury was induced via the intravitreal injection of kainic acid (KA, 20 µg), which was followed by chronic administration of GH (10 injections [300 ng] over 21 days). Damage provoked a severe disruption of several retinal layers. However, in KA-damaged retinas treated with GH, we observed a significant restoration of the inner plexiform layer (IPL, 2.4-fold) and inner nuclear layer (INL, 1.5-fold) thickness and a general improvement of the retinal structure. In addition, we also observed an increase in the expression of several genes involved in important regenerative pathways, including: synaptogenic markers (DLG1, NRXN1, GAP43); glutamate receptor subunits (NR1 and GRIK4); pro-survival factors (BDNF, Bcl-2 and TNF-R2); and Notch signaling proteins (Notch1 and Hes5). Interestingly, Müller cell transdifferentiation markers (Sox2 and FGF2) were upregulated by this long-term chronic GH treatment. These results are consistent with a significant increase in the number of BrdU-positive cells observed in the KA-damaged retina, which was induced by GH administration. Our data suggest that GH is able to facilitate the early proliferative response of the injured retina and enhance the regeneration of neurite interconnections.
Keywords: excitotoxicity; growth hormone; neurotrophic; regeneration; retina; synaptogenic.
Conflict of interest statement
The authors declare no conflict of interest.
Figures
Similar articles
-
Growth Hormone Neuroprotection Against Kainate Excitotoxicity in the Retina is Mediated by Notch/PTEN/Akt Signaling.Invest Ophthalmol Vis Sci. 2019 Nov 1;60(14):4532-4547. doi: 10.1167/iovs.19-27473. Invest Ophthalmol Vis Sci. 2019. PMID: 31675424
-
Growth hormone protects against kainate excitotoxicity and induces BDNF and NT3 expression in chicken neuroretinal cells.Exp Eye Res. 2018 Jan;166:1-12. doi: 10.1016/j.exer.2017.10.005. Epub 2017 Oct 10. Exp Eye Res. 2018. PMID: 29030174
-
Growth hormone promotes synaptogenesis and protects neuroretinal dendrites against kainic acid (KA) induced damage.Gen Comp Endocrinol. 2018 Sep 1;265:111-120. doi: 10.1016/j.ygcen.2018.02.011. Epub 2018 Feb 15. Gen Comp Endocrinol. 2018. PMID: 29454595
-
Signaling mechanisms mediating local GH action in the neural retina of the chick embryo.Gen Comp Endocrinol. 2009 Sep 1;163(1-2):63-9. doi: 10.1016/j.ygcen.2009.01.005. Epub 2009 Jan 22. Gen Comp Endocrinol. 2009. PMID: 19344664 Review.
-
Growth hormone-induced neuroprotection in the neural retina during chick embryogenesis.Ann N Y Acad Sci. 2009 Apr;1163:414-6. doi: 10.1111/j.1749-6632.2008.03641.x. Ann N Y Acad Sci. 2009. PMID: 19456374 Review.
Cited by
-
Growth Hormone (GH) Crosses the Blood-Brain Barrier (BBB) and Induces Neuroprotective Effects in the Embryonic Chicken Cerebellum after a Hypoxic Injury.Int J Mol Sci. 2022 Sep 30;23(19):11546. doi: 10.3390/ijms231911546. Int J Mol Sci. 2022. PMID: 36232848 Free PMC article.
-
An insight on established retinal injury mechanisms and prevalent retinal stem cell activation pathways in vertebrate models.Animal Model Exp Med. 2021 Jul 9;4(3):189-203. doi: 10.1002/ame2.12177. eCollection 2021 Sep. Animal Model Exp Med. 2021. PMID: 34557646 Free PMC article. Review.
-
Gonadotropin-releasing hormone and growth hormone act as anti-inflammatory factors improving sensory recovery in female rats with thoracic spinal cord injury.Front Neurosci. 2023 Jun 9;17:1164044. doi: 10.3389/fnins.2023.1164044. eCollection 2023. Front Neurosci. 2023. PMID: 37360158 Free PMC article.
-
KLF13 Regulates the Activity of the GH-Induced JAK/STAT Signaling by Targeting Genes Involved in the Pathway.Int J Mol Sci. 2023 Jul 7;24(13):11187. doi: 10.3390/ijms241311187. Int J Mol Sci. 2023. PMID: 37446365 Free PMC article.
-
Growth hormone promotes the reconstruction of injured axons in the hypothalamo-neurohypophyseal system.Neural Regen Res. 2024 Oct 1;19(10):2249-2258. doi: 10.4103/1673-5374.389358. Epub 2023 Nov 8. Neural Regen Res. 2024. PMID: 38488559 Free PMC article.
References
-
- Engler A., Zhang R., Taylor V. Notch and Neurogenesis. In: Borggrefe T., Giaimo B.D., editors. Molecular Mechanisms of Notch Signaling. Springer International Publishing; Cham, Switzerland: 2018. pp. 223–234.
MeSH terms
Substances
Grants and funding
LinkOut - more resources
Full Text Sources
