

Effects of Vitamin D Deficiency on Proliferation and Autophagy of Ovarian and Liver Tissues in a Rat Model of Polycystic Ovary Syndrome
- PMID: 31509973
- PMCID: PMC6770417
- DOI: 10.3390/biom9090471
Effects of Vitamin D Deficiency on Proliferation and Autophagy of Ovarian and Liver Tissues in a Rat Model of Polycystic Ovary Syndrome
Abstract
Aim: We aimed to examine the alterations of the insulin signaling pathway, autophagy, nitrative stress and the effect of vitamin D supplementation in the liver and ovaries of vitamin D deficient hyperandrogenic rats.
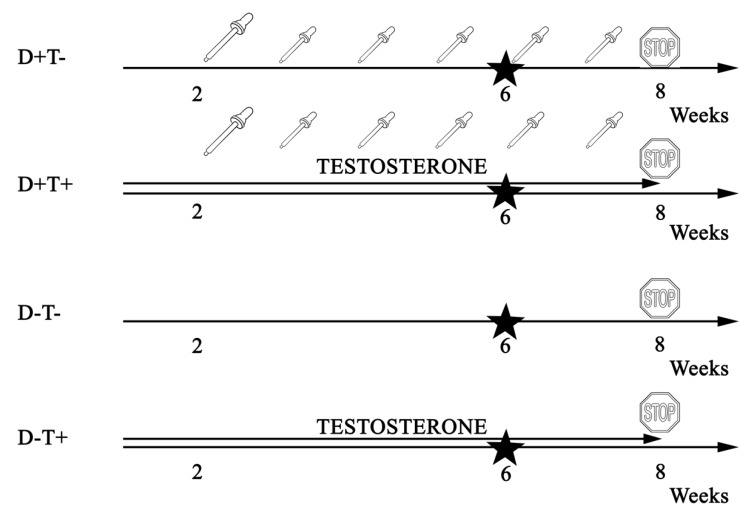
Methods: Female Wistar rats received eight weeks of transdermal testosterone treatment and lived on a low vitamin D diet (D-T+). Vitamin D supplementation was achieved by oral administration of vitamin D3 (D+T+). Sham-treated (D+T-) and vitamin D deficient animals (D-T-) served as controls. (N = 10-12 per group).
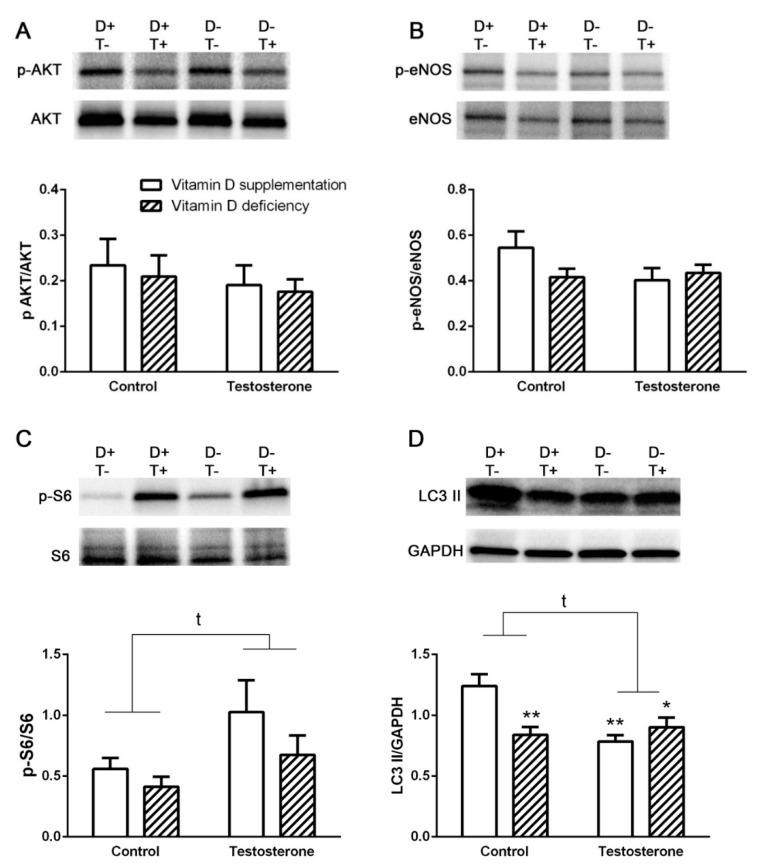
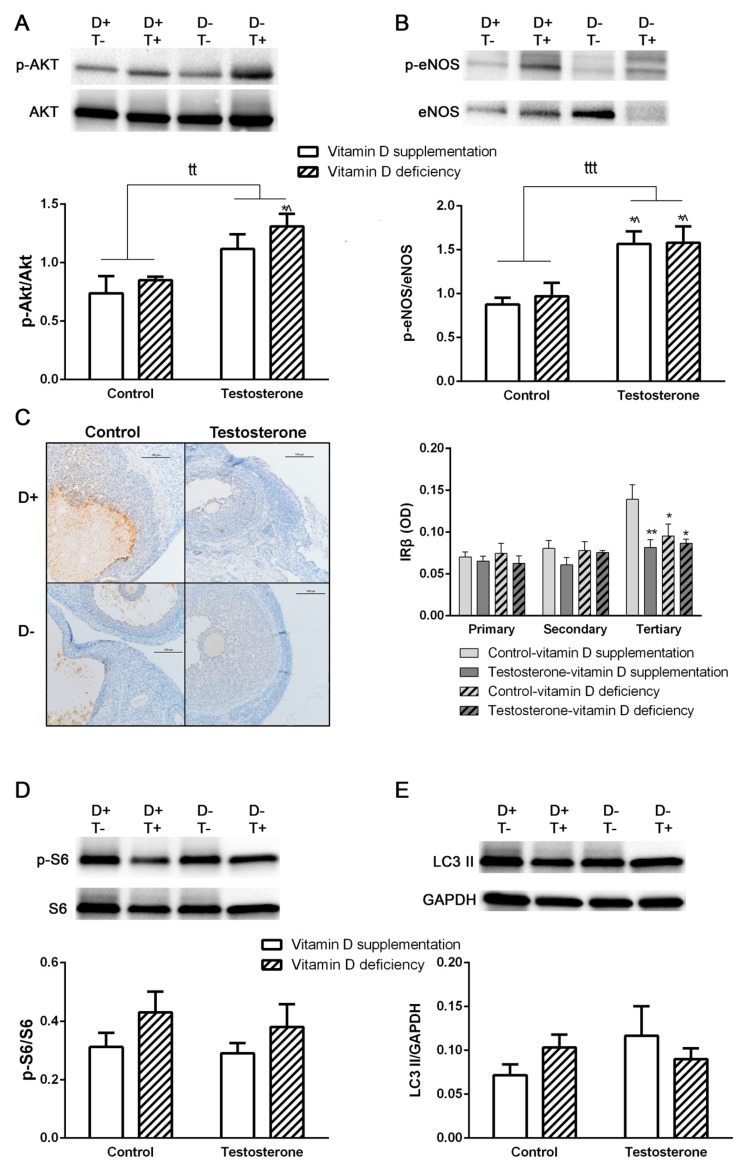
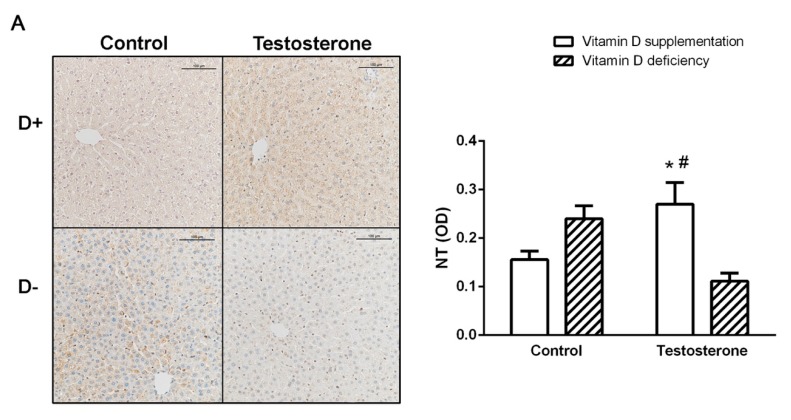
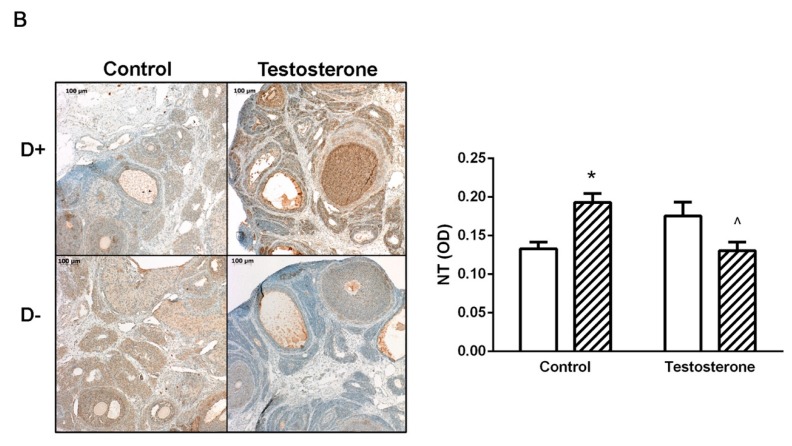
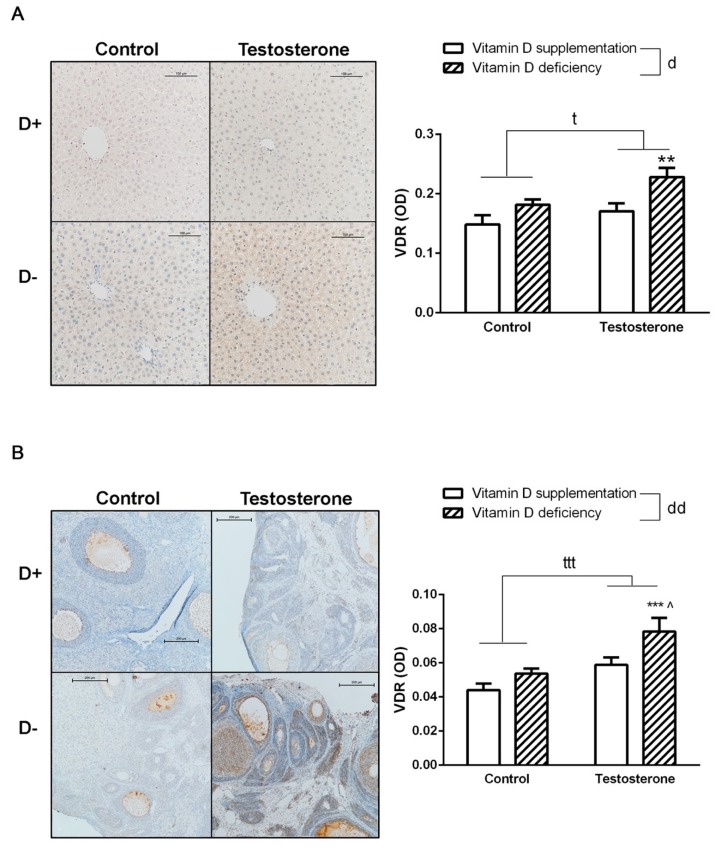
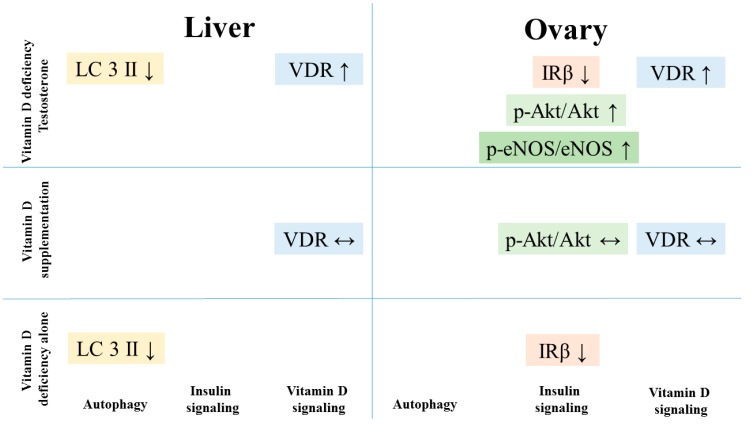
Results: D-T+ animals showed decreased LC3 II levels in the liver and increased p-Akt/Akt and p-eNOS/eNOS ratios with decreased insulin receptor staining in the ovaries. Vitamin D supplementation prevented the increase of Akt phosphorylation in the ovaries. Vitamin D deficiency itself also led to decreased LC3 II levels in the liver and decreased insulin receptor staining in the ovaries. D-T+ group showed no increase in nitrotyrosine staining; however, the ovaries of D-T- rats and the liver of D+T+ animals showed increased staining intensity.
Conclusion: Vitamin D deficiency itself might lead to disrupted ovarian maturation and autophagy malfunction in the liver. Preventing Akt phosphorylation may contribute to the beneficial effect of vitamin D treatment on ovarian function in hyperandrogenism.
Keywords: autophagy; hyperandrogenism; insulin resistance; oxidative stress; polycystic ovary syndrome (PCOS); vitamin D.
Conflict of interest statement
The authors declare no conflict of interest.
Figures
Similar articles
-
Increased Oxidative and Nitrative Stress and Decreased Sex Steroid Relaxation in a Vitamin D-Deficient Hyperandrogenic Rodent Model-And a Validation of the Polycystic Ovary Syndrome Model.Nutrients. 2025 Jan 7;17(2):201. doi: 10.3390/nu17020201. Nutrients. 2025. PMID: 39861332 Free PMC article.
-
Endothelial relaxation mechanisms and nitrative stress are partly restored by Vitamin D3 therapy in a rat model of polycystic ovary syndrome.Life Sci. 2013 Aug 6;93(4):133-8. doi: 10.1016/j.lfs.2013.05.003. Epub 2013 May 14. Life Sci. 2013. PMID: 23685132
-
Influence of Vitamin D on the Vasoactive Effect of Estradiol in a Rat Model of Polycystic Ovary Syndrome.Int J Mol Sci. 2021 Aug 30;22(17):9404. doi: 10.3390/ijms22179404. Int J Mol Sci. 2021. PMID: 34502321 Free PMC article.
-
Vitamin D in the aetiology and management of polycystic ovary syndrome.Clin Endocrinol (Oxf). 2012 Sep;77(3):343-50. doi: 10.1111/j.1365-2265.2012.04434.x. Clin Endocrinol (Oxf). 2012. PMID: 22574874 Review.
-
Vitamin D3 action within the ovary - an updated review.Physiol Res. 2020 Jul 16;69(3):371-378. doi: 10.33549/physiolres.934266. Epub 2020 May 29. Physiol Res. 2020. PMID: 32469224 Free PMC article. Review.
Cited by
-
Effect of Vitamin D3 on Chemerin and Adiponectin Levels in Uterus of Polycystic Ovary Syndrome Rats.Cells. 2023 Aug 8;12(16):2026. doi: 10.3390/cells12162026. Cells. 2023. PMID: 37626836 Free PMC article.
-
Ovarian reserve modulates the impact of vitamin D deficiency on assisted reproductive outcomes in patients undergoing controlled ovarian hyperstimulation.Front Nutr. 2024 Dec 12;11:1486958. doi: 10.3389/fnut.2024.1486958. eCollection 2024. Front Nutr. 2024. PMID: 39726869 Free PMC article.
-
Effect of Vitamin D Status on Vascular Function of the Aorta in a Rat Model of PCOS.Oxid Med Cell Longev. 2021 Mar 18;2021:8865979. doi: 10.1155/2021/8865979. eCollection 2021. Oxid Med Cell Longev. 2021. PMID: 33791074 Free PMC article.
-
Autophagy in ovary and polycystic ovary syndrome: role, dispute and future perspective.Autophagy. 2021 Oct;17(10):2706-2733. doi: 10.1080/15548627.2021.1938914. Epub 2021 Jun 23. Autophagy. 2021. PMID: 34161185 Free PMC article. Review.
-
Vitamin D has therapeutic effects on obesity and hyperandrogenemia in PCOS mouse model induced by low dose DHEA and high-fat diet.BMC Womens Health. 2024 Nov 9;24(1):601. doi: 10.1186/s12905-024-03445-w. BMC Womens Health. 2024. PMID: 39521978 Free PMC article.
References
-
- Mogili K.D., Karuppusami R., Thomas S., Chandy A., Kamath M.S., Tk A. Prevalence of vitamin D deficiency in infertile women with polycystic ovarian syndrome and its association with metabolic syndrome—A prospective observational study. Eur. J. Obstet. Gynecol. Reprod. Boil. 2018;229:15–19. - PubMed
-
- Hahn S., Haselhorst U., Tan S., Quadbeck B., Schmidt M., Roesler S., Kimmig R., Mann K., Janssen O.E. Low Serum 25-Hydroxyvitamin D Concentrations are Associated with Insulin Resistance and Obesity in Women with Polycystic Ovary Syndrome. Exp. Clin. Endocrinol. Diabetes. 2006;114:577–583. doi: 10.1055/s-2006-948308. - DOI - PubMed
-
- Hadjadj L., Várbíró S., Horváth E.M., Monori-Kiss A., Pál É., Karvaly G.B., Heinzlmann A., Magyar A., Szabo I., Sziva R.E., et al. Insulin resistance in an animal model of polycystic ovary disease is aggravated by vitamin D deficiency: Vascular consequences. Diabetes Vasc. Dis. Res. 2018;15:294–301. doi: 10.1177/1479164118758580. - DOI - PubMed
Publication types
MeSH terms
Substances
LinkOut - more resources
Full Text Sources
Medical
