

Altered Cell Surface N-Glycosylation of Resting and Activated T Cells in Systemic Lupus Erythematosus
- PMID: 31509989
- PMCID: PMC6770513
- DOI: 10.3390/ijms20184455
Altered Cell Surface N-Glycosylation of Resting and Activated T Cells in Systemic Lupus Erythematosus
Abstract
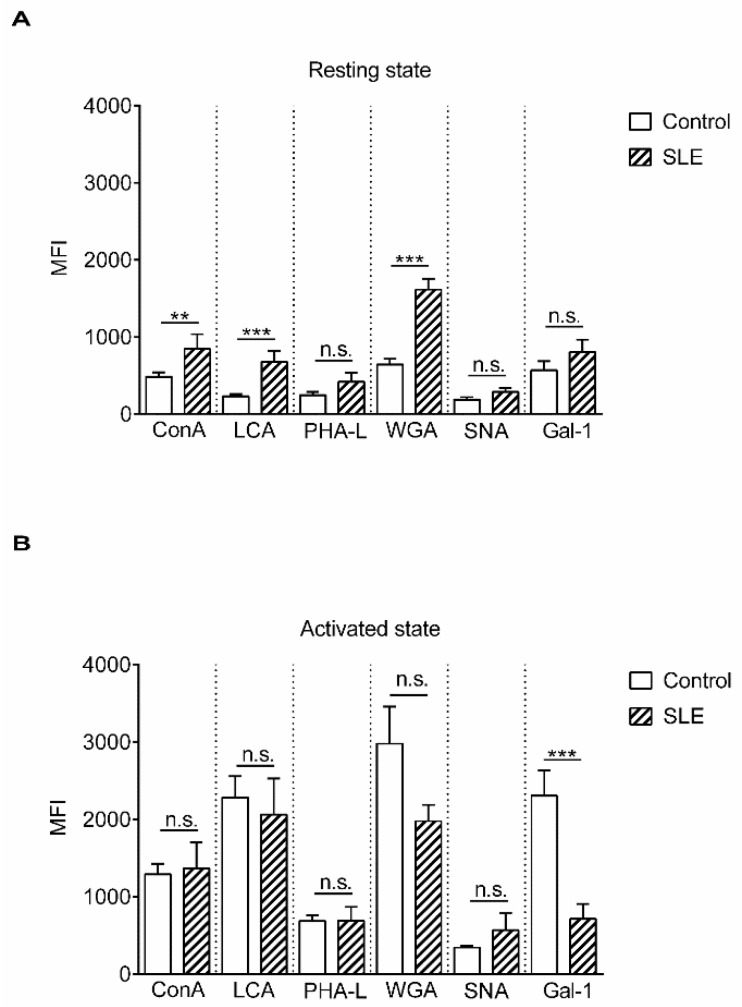
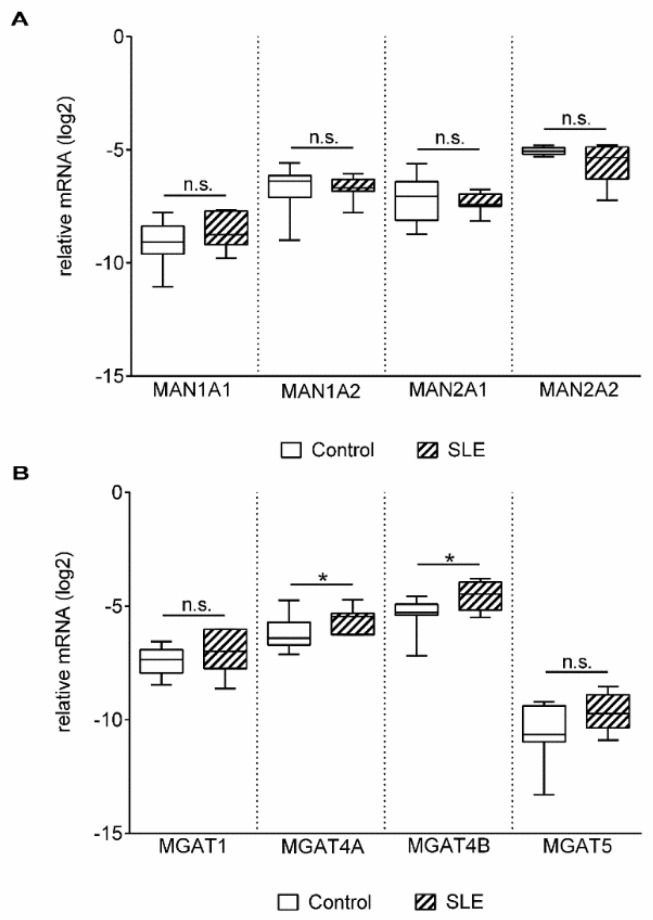
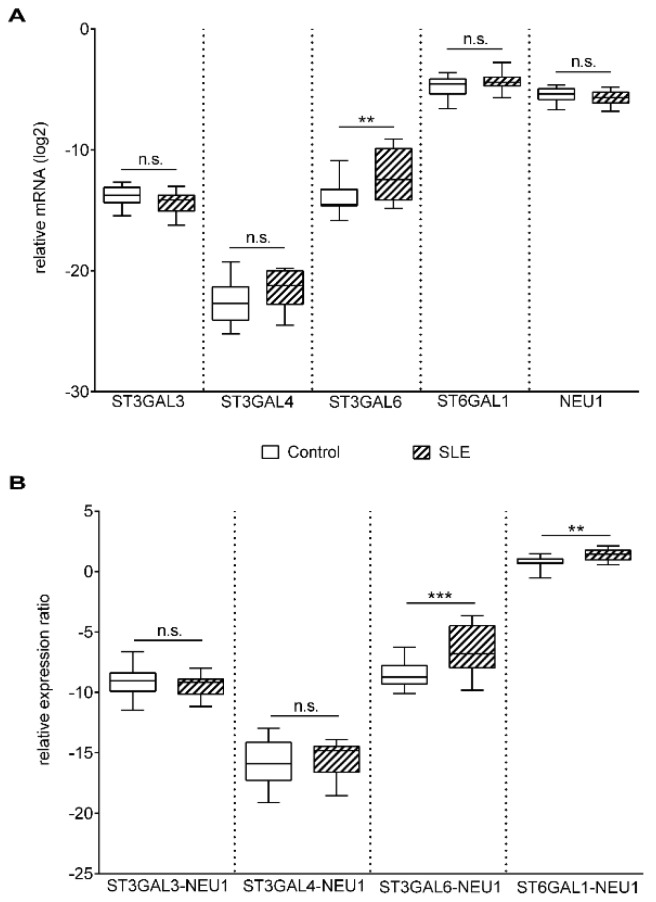
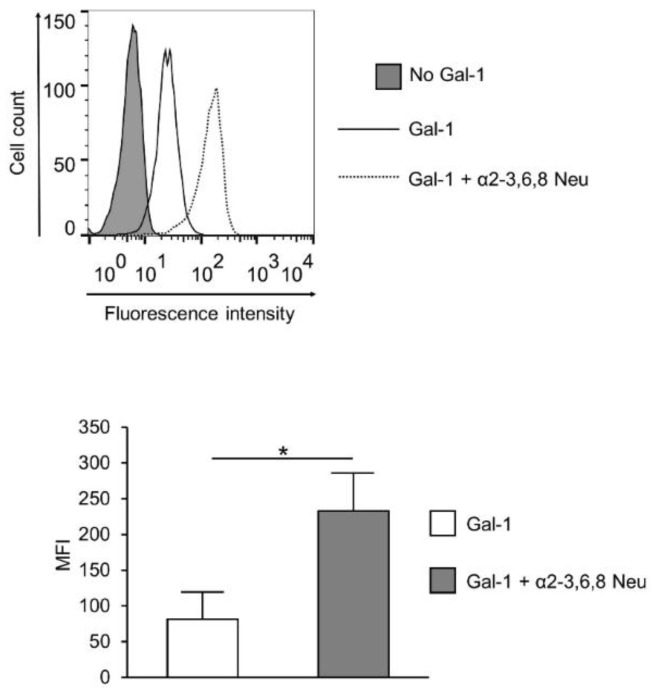
Altered cell surface glycosylation in congenital and acquired diseases has been shown to affect cell differentiation and cellular responses to external signals. Hence, it may have an important role in immune regulation; however, T cell surface glycosylation has not been studied in systemic lupus erythematosus (SLE), a prototype of autoimmune diseases. Analysis of the glycosylation of T cells from patients suffering from SLE was performed by lectin-binding assay, flow cytometry, and quantitative real-time PCR. The results showed that resting SLE T cells presented an activated-like phenotype in terms of their glycosylation pattern. Additionally, activated SLE T cells bound significantly less galectin-1 (Gal-1), an important immunoregulatory lectin, while other lectins bound similarly to the controls. Differential lectin binding, specifically Gal-1, to SLE T cells was explained by the increased gene expression ratio of sialyltransferases and neuraminidase 1 (NEU1), particularly by elevated ST6 beta-galactosamide alpha-2,6-sialyltranferase 1 (ST6GAL1)/NEU1 and ST3 beta-galactoside alpha-2,3-sialyltransferase 6 (ST3GAL6)/NEU1 ratios. These findings indicated an increased terminal sialylation. Indeed, neuraminidase treatment of cells resulted in the increase of Gal-1 binding. Altered T cell surface glycosylation may predispose the cells to resistance to the immunoregulatory effects of Gal-1, and may thus contribute to the pathomechanism of SLE.
Keywords: T cells; galectin 1; glycosylation; glycosylation enzymes; lectin binding; sialylation; systemic lupus erythematosus.
Conflict of interest statement
The authors declare no conflict of interest.
Figures
Similar articles
-
Identification of immune subsets with distinct lectin binding signatures using multi-parameter flow cytometry: correlations with disease activity in systemic lupus erythematosus.Front Immunol. 2024 May 7;15:1380481. doi: 10.3389/fimmu.2024.1380481. eCollection 2024. Front Immunol. 2024. PMID: 38774868 Free PMC article.
-
Galectin-1-mediated cell adhesion, invasion and cell death in human anaplastic large cell lymphoma: regulatory roles of cell surface glycans.Int J Oncol. 2014 May;44(5):1433-42. doi: 10.3892/ijo.2014.2319. Epub 2014 Mar 4. Int J Oncol. 2014. PMID: 24589677 Free PMC article.
-
[Glycoprotein sialylation and NEU1 and ST6GAL1 expressions in erythremia].Fiziol Zh (1994). 2014;60(5):14-22. Fiziol Zh (1994). 2014. PMID: 25566667 Ukrainian.
-
The Role of B Cell and T Cell Glycosylation in Systemic Lupus Erythematosus.Int J Mol Sci. 2023 Jan 3;24(1):863. doi: 10.3390/ijms24010863. Int J Mol Sci. 2023. PMID: 36614306 Free PMC article. Review.
-
Systemic lupus erythematosus in the light of the regulatory effects of galectin-1 on T-cell function.Lupus. 2017 Apr;26(4):339-347. doi: 10.1177/0961203316686846. Epub 2017 Jan 18. Lupus. 2017. PMID: 28100106 Review.
Cited by
-
NEU1-Mediated Extracellular Vesicle Glycosylation in Alzheimer's Disease: Mechanistic Insights into Intercellular Communication and Therapeutic Targeting.Pharmaceuticals (Basel). 2025 Jun 19;18(6):921. doi: 10.3390/ph18060921. Pharmaceuticals (Basel). 2025. PMID: 40573316 Free PMC article. Review.
-
RNA-binding proteins potentially regulate alternative splicing of immune/inflammatory-associated genes during the progression of generalized pustular psoriasis.Arch Dermatol Res. 2024 Aug 19;316(8):538. doi: 10.1007/s00403-024-03283-8. Arch Dermatol Res. 2024. PMID: 39158708
-
Galectin-1: A Traditionally Immunosuppressive Protein Displays Context-Dependent Capacities.Int J Mol Sci. 2023 Mar 30;24(7):6501. doi: 10.3390/ijms24076501. Int J Mol Sci. 2023. PMID: 37047471 Free PMC article. Review.
-
Identification of immune subsets with distinct lectin binding signatures using multi-parameter flow cytometry: correlations with disease activity in systemic lupus erythematosus.Front Immunol. 2024 May 7;15:1380481. doi: 10.3389/fimmu.2024.1380481. eCollection 2024. Front Immunol. 2024. PMID: 38774868 Free PMC article.
-
Metabolic preconditioning in CD4+ T cells restores inducible immune tolerance in lupus-prone mice.JCI Insight. 2021 Oct 8;6(19):e143245. doi: 10.1172/jci.insight.143245. JCI Insight. 2021. PMID: 34403367 Free PMC article.
References
MeSH terms
Substances
Grants and funding
LinkOut - more resources
Full Text Sources
Medical
Research Materials
