. 2019 Sep 10;20(18):4459.
doi: 10.3390/ijms20184459.

A Novel Tanshinone Analog Exerts Anti-Cancer Effects in Prostate Cancer by Inducing Cell Apoptosis, Arresting Cell Cycle at G2 Phase and Blocking Metastatic Ability

Affiliations

A Novel Tanshinone Analog Exerts Anti-Cancer Effects in Prostate Cancer by Inducing Cell Apoptosis, Arresting Cell Cycle at G2 Phase and Blocking Metastatic Ability

Mengling Wang et al. Int J Mol Sci. .

Abstract

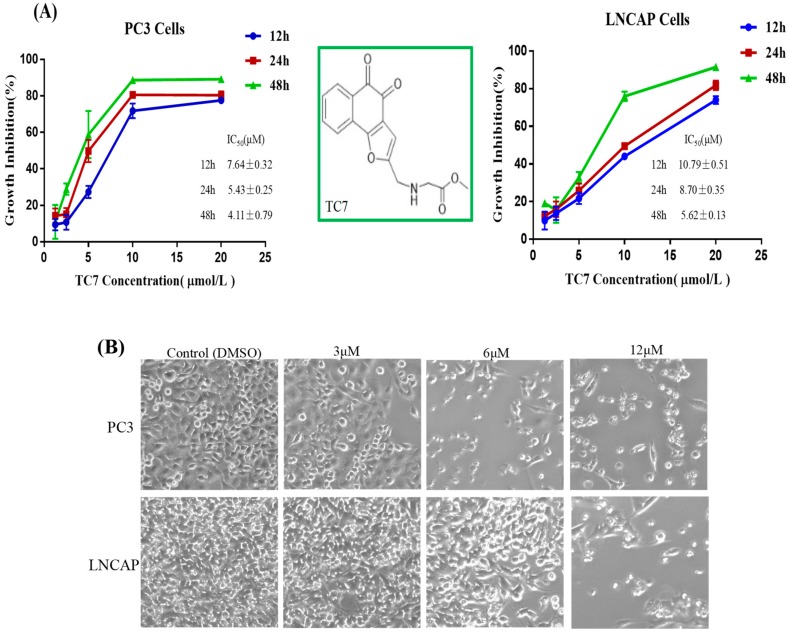
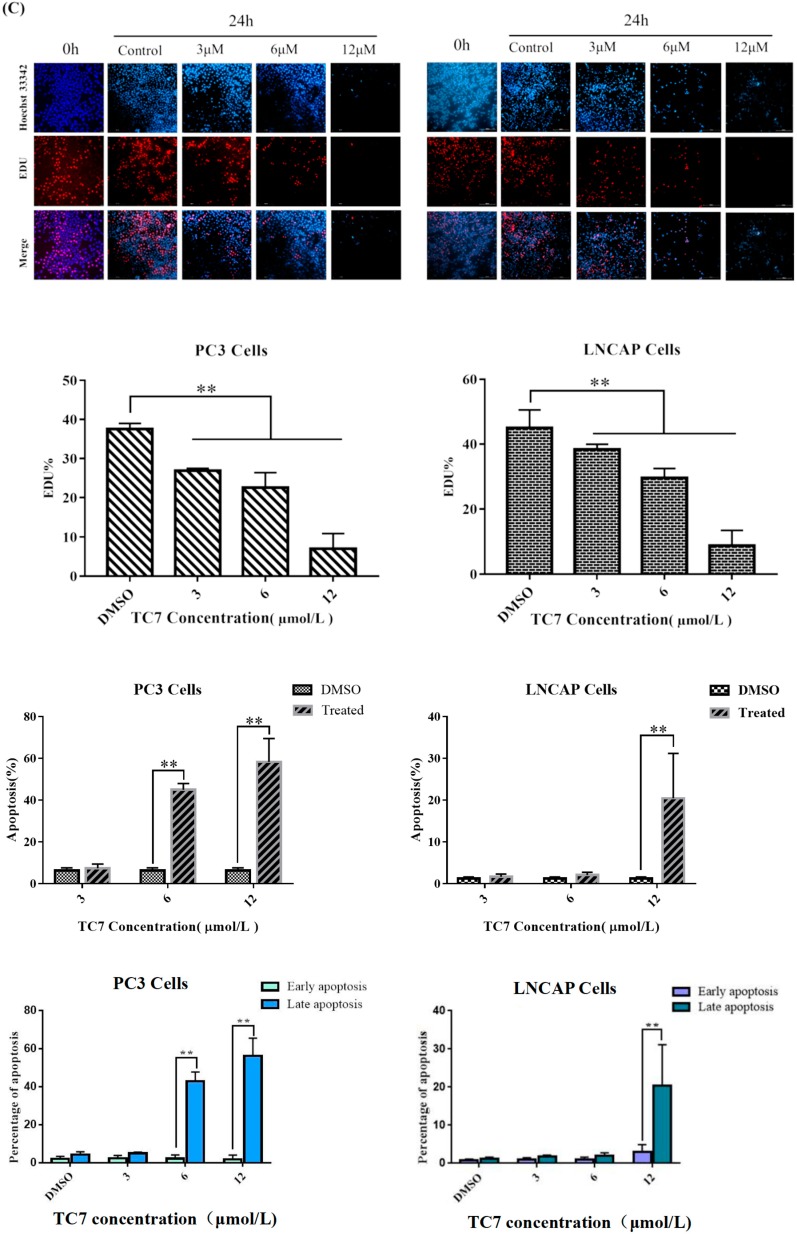
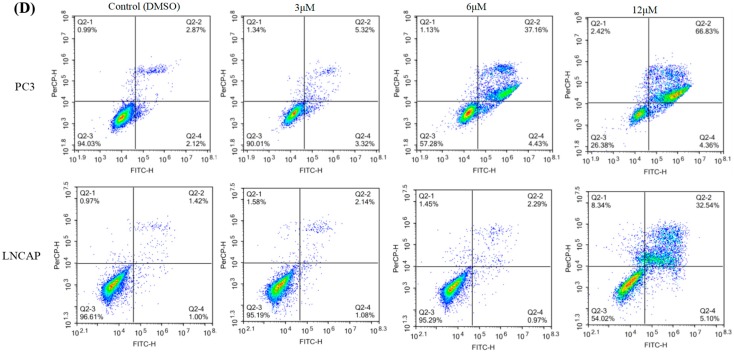
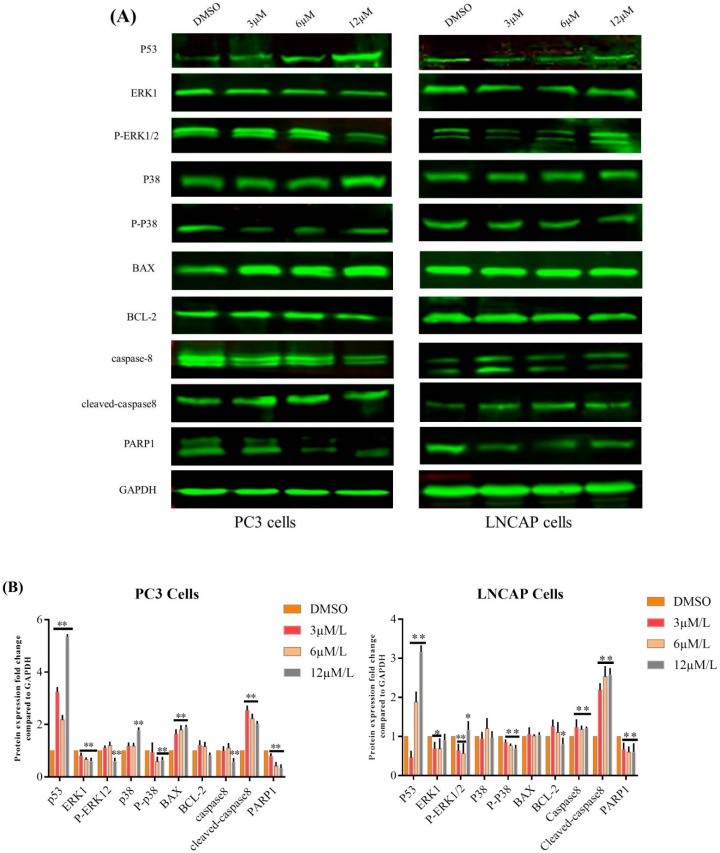
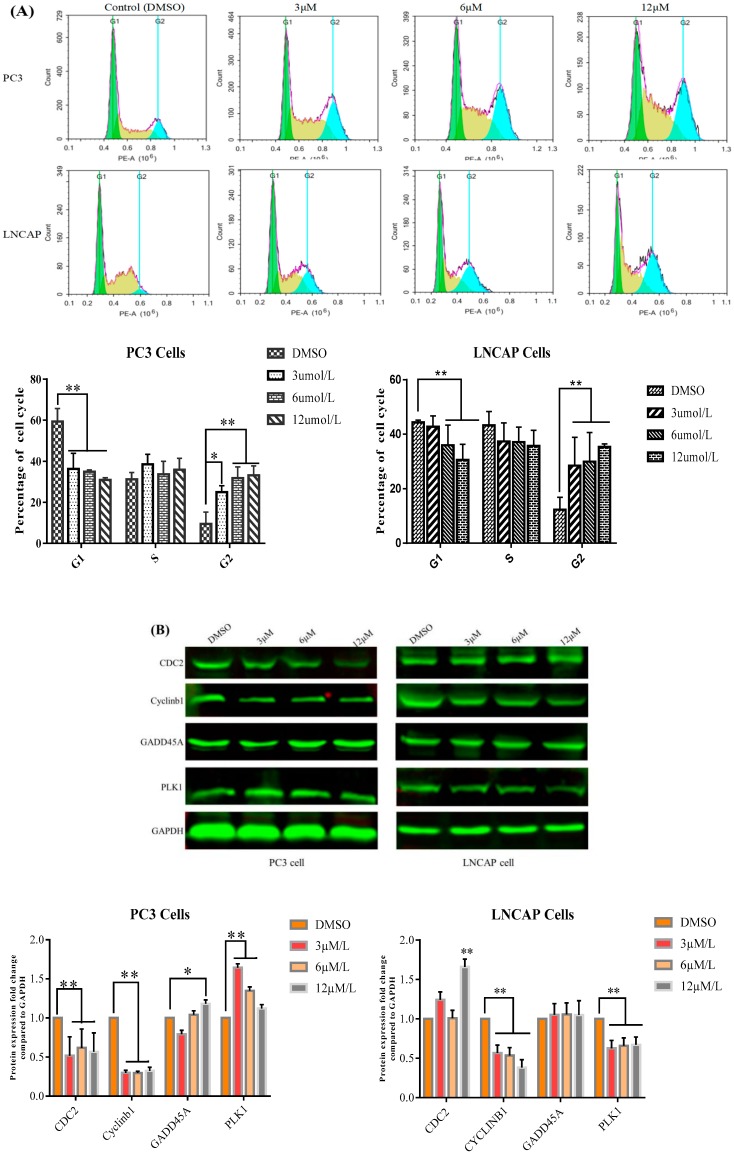
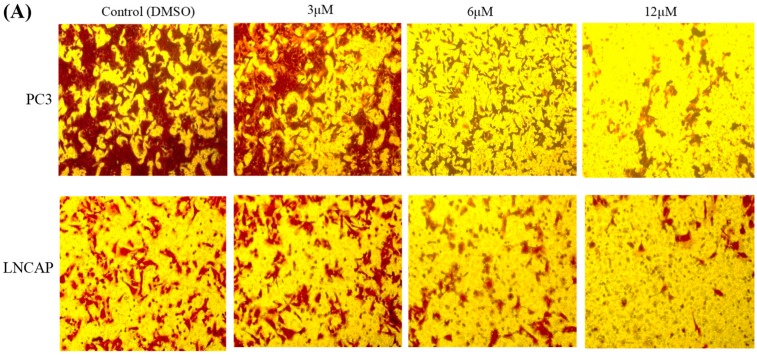
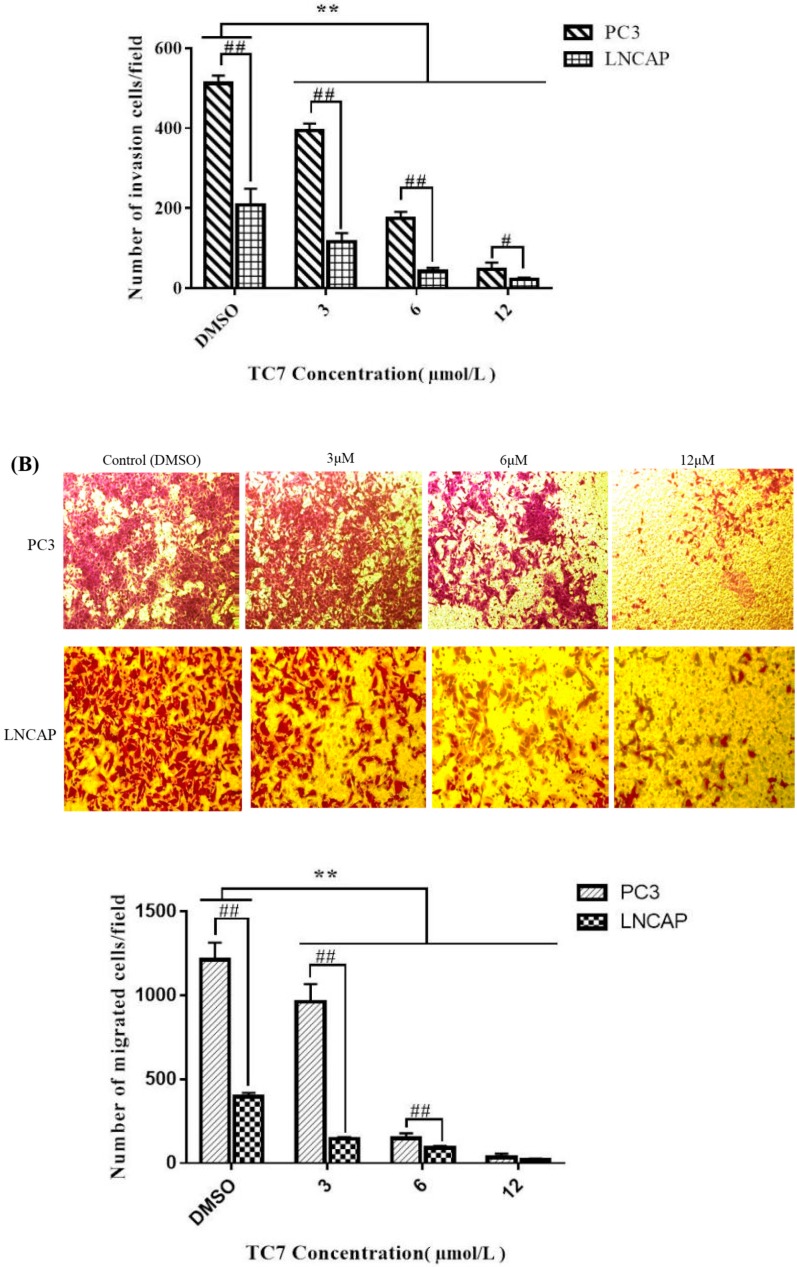
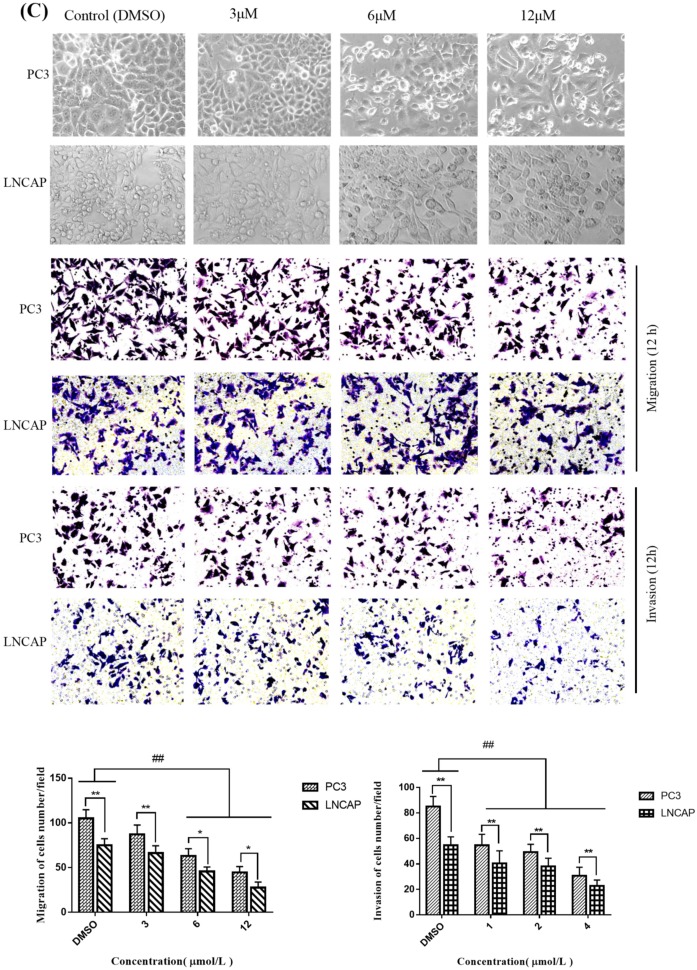
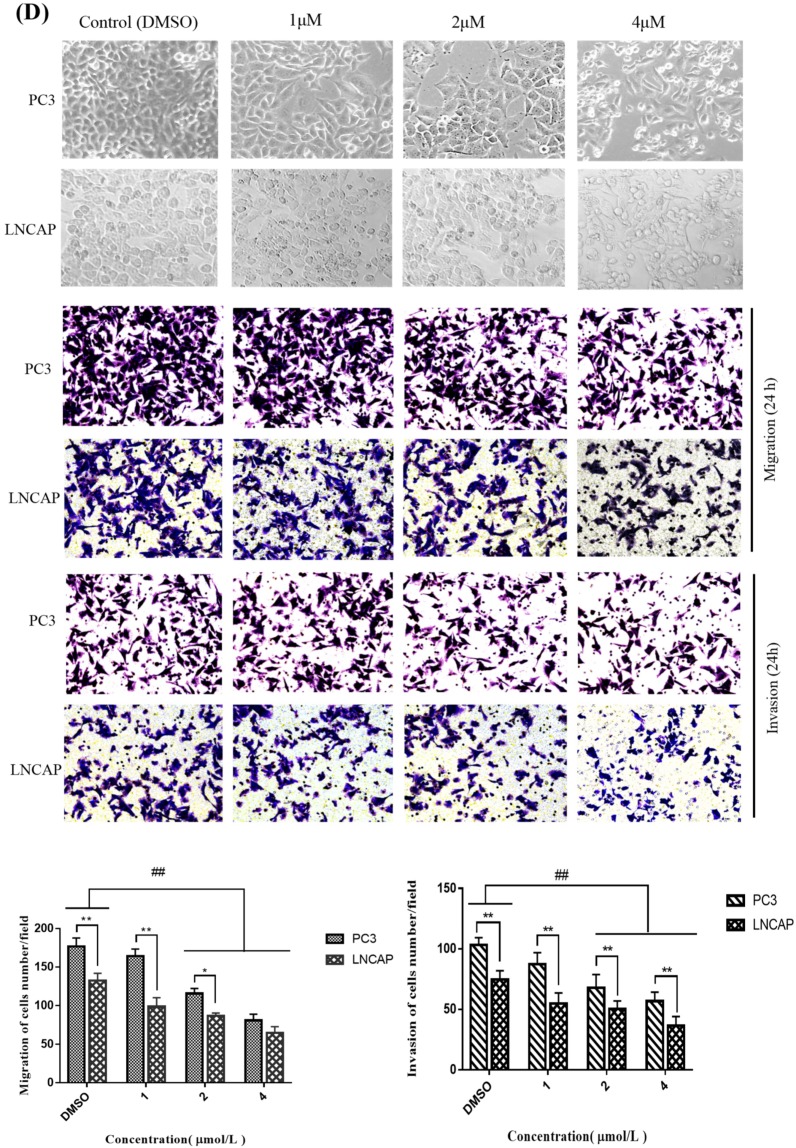
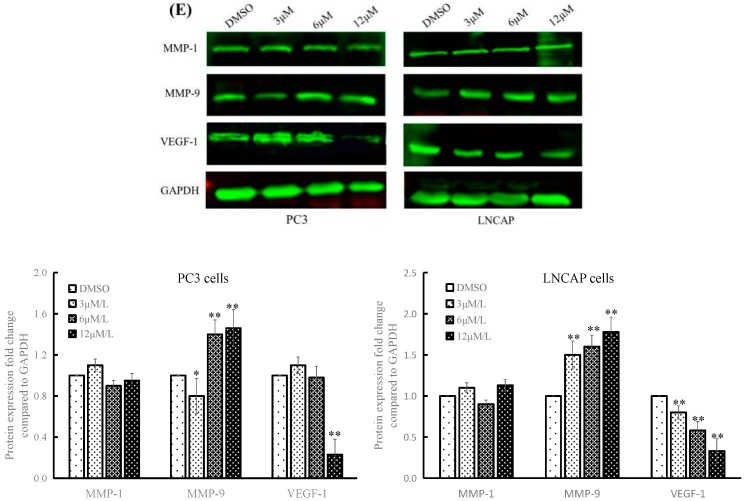
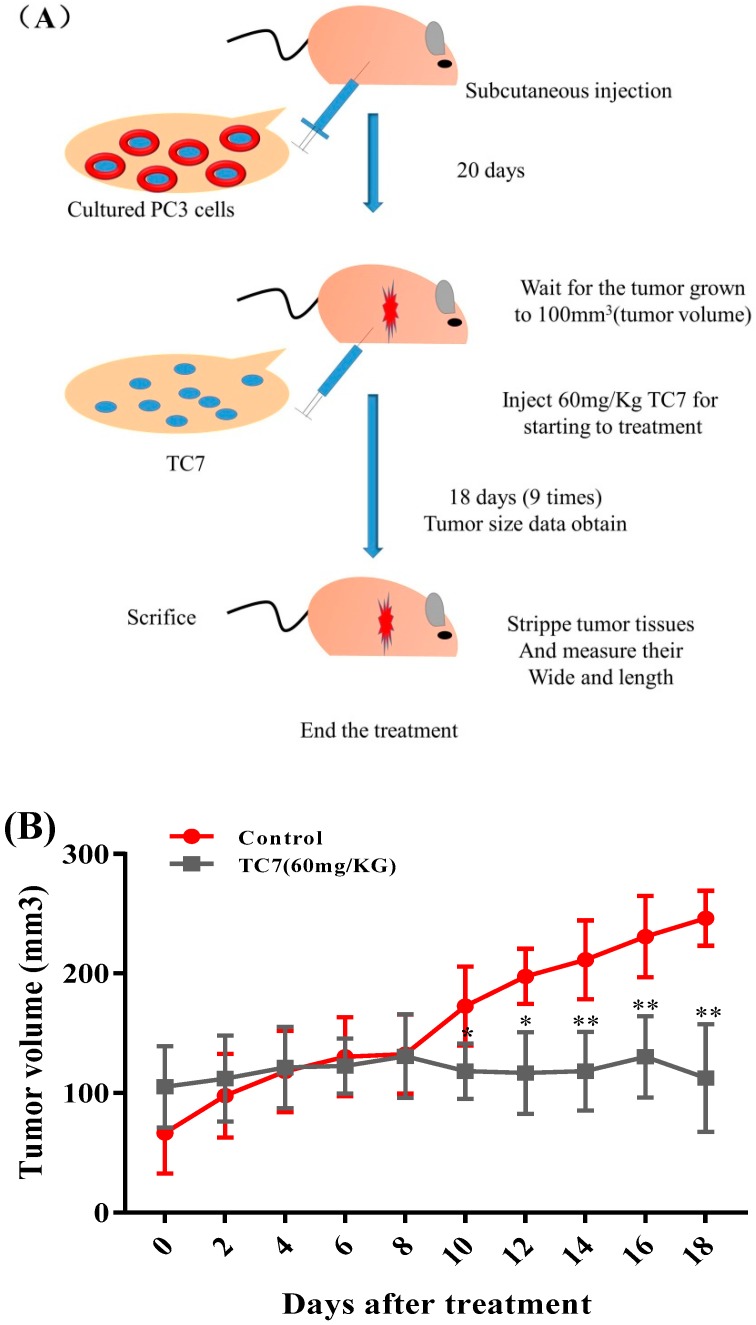
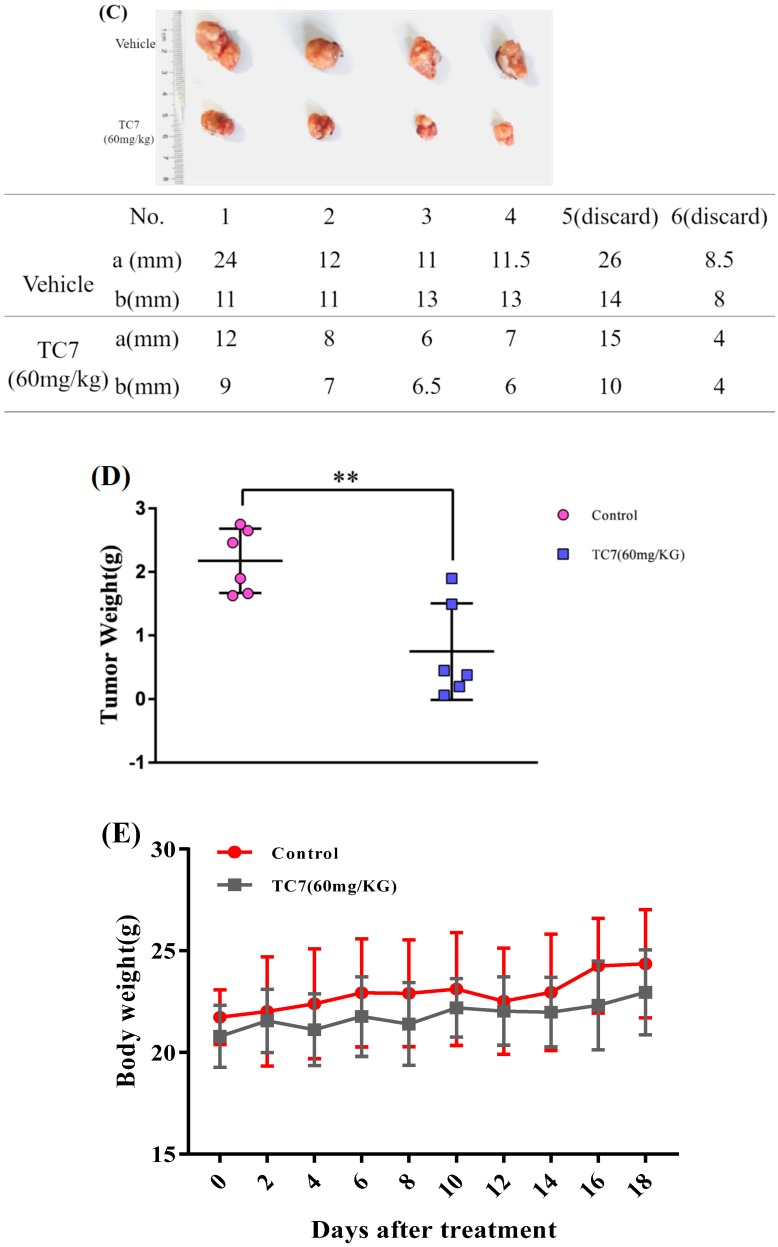
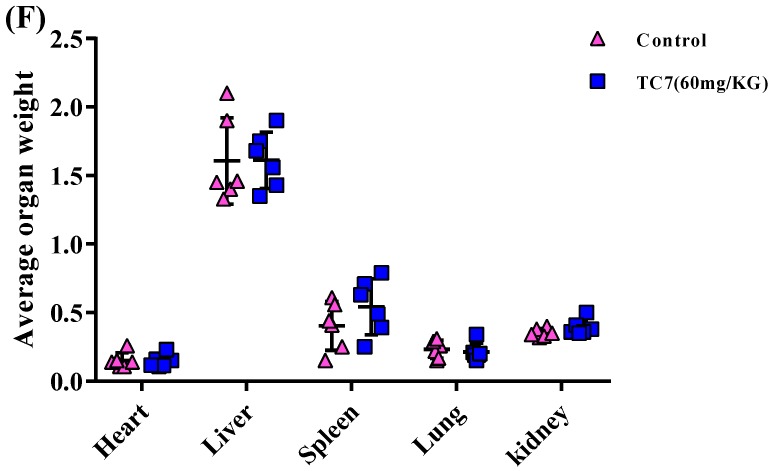
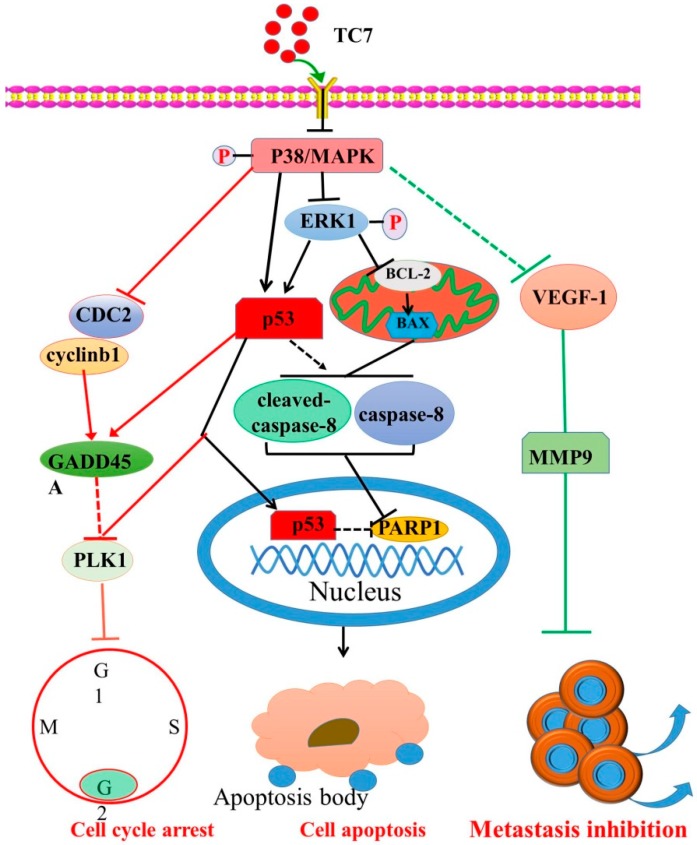
Prostate cancer (PCa), an epithelial malignant tumor, is the second common cause of cancer death among males in western countries. Thus, the development of new strategies is urgently needed. Tanshinones isolated from Salvia miltiorrhiza and its synthetic analogs show various biological activities including anticancer effects. Among them, the tanshinone analog 2-((Glycine methyl ester)methyl)-naphtho (TC7) is the most effective, with better selectivity and lower toxicity. Therefore, in this work, the effect of TC7 against PCa was investigated through assessing the molecular mechanisms regulating the growth, metastasis, and invasion of PCa cells. Human PCa cells, PC3 and LNCAP, were used to evaluate TC7 mechanisms of action in vitro, while male BALB/c nude mice were used for in vivo experiments by subjecting each mouse to a subcutaneous injection of PC3 cells into the right flank to evaluate TC7 effects on tumor volume. Our in vitro results showed that TC7 inhibited cell proliferation by arresting the cell cycle at G2/M through the regulation of cyclin b1, p53, GADD45A, PLK1, and CDC2/cyclin b1. In addition, TC7 induced cell apoptosis by regulating apoptosis-associated genes such as p53, ERK1, BAX, p38, BCL-2, caspase-8, cleaved-caspase-8, PARP1, and the phosphorylation level of ERK1 and p38. Furthermore, it decreased DNA synthesis and inhibited the migration and invasion ability by regulating VEGF-1 and MMP-9 protein expression. Our in vivo evidence supports the conclusion that TC7 could be considered as a potential promising chemotherapeutic candidate in the treatment of PCa.

Keywords: cell apoptosis; cell cycle arrest; metastasis potency; prostate cancer; quinone analog.


Conflict of interest statement

The authors declare no conflict of interest.

Figures

Figure 1
Figure 1
Effects of 2-((Glycine methyl ester)methyl)-naphtho[1,2-b]furan-4,5-dione (TC7) on PCa cell growth and apoptosis. (A) Growth inhibition induced by TC7 on PC3 and LNCAP cells by MTT assay. IC50 values (μM) of TC7 were determined according to these curves at different incubation times. (B) Cell number and morphological appearance of the two types of cells treated with TC7 at 3, 6, and 12 μM observed by a fluorescent inverted microscope after 24 h. (C) DNA synthesis inhibition by TC7 on PCa cells by EDU-DNA assay. The zero-hour image was intended to demonstrate that the cells exhibited the higher level of DNA replication before treatment with TC7. (D) Cell apoptosis induced by TC7 by flow cytometry. Scale bar = 100 μM in all images. All experiments were performed in triplicate. Results are presented as mean ± SEM. * p < 0.05, ** p < 0.01 (n = 3) compared with the control.
Figure 1
Figure 1
Effects of 2-((Glycine methyl ester)methyl)-naphtho[1,2-b]furan-4,5-dione (TC7) on PCa cell growth and apoptosis. (A) Growth inhibition induced by TC7 on PC3 and LNCAP cells by MTT assay. IC50 values (μM) of TC7 were determined according to these curves at different incubation times. (B) Cell number and morphological appearance of the two types of cells treated with TC7 at 3, 6, and 12 μM observed by a fluorescent inverted microscope after 24 h. (C) DNA synthesis inhibition by TC7 on PCa cells by EDU-DNA assay. The zero-hour image was intended to demonstrate that the cells exhibited the higher level of DNA replication before treatment with TC7. (D) Cell apoptosis induced by TC7 by flow cytometry. Scale bar = 100 μM in all images. All experiments were performed in triplicate. Results are presented as mean ± SEM. * p < 0.05, ** p < 0.01 (n = 3) compared with the control.
Figure 2
Figure 2
Effects of TC7 on apoptotic protein expression in PCa and LNCAP cells. Cells were incubated with TC7 at different concentrations (3, 6, 12 μM) for 24 h, then total proteins were extracted. (A) The expression of apoptotic proteins was detected using western blot in the cells treated with TC7. (B) Quantitative analysis of the protein expression by Image J software. GAPDH was used as a loading control. Experiments were performed in triplicate. Results are presented as mean ± SEM. * p < 0.05 (n = 3) compared with the control, ** p < 0.01 (n = 3) compared with the control.
Figure 3
Figure 3
Effect of TC7 on cell cycle of PCa and LNCAP cells. Cells were treated with TC7 at different concentrations (3, 6, and 12 μM) for 24 h. (A) Effect of TC7 on the cell cycle of PCa and LNCAP cells by flow cytometry. Cells were fixed and stained with propidium iodide (PI) to analyze the DNA content by flow cytometry. The bar graph shows PC3 and LNCAP cells percentage in different phases of the cell cycle. (B) TC7 effect on the expression of proteins involved in the cell cycle of PCa and LNCAP cells by western blot and quantitatively analyzed by Image J software. Results are presented as mean ± SD from three independent experiments. * p < 0.05 (n = 3); ** p < 0.01 (n = 3), compared with the control group.
Figure 4
Figure 4
Effect of TC7 on migration and invasion ability of PCa cells. Migration (B) and invasion (A) of PC3 and LNCAP cells was evaluated by Transwell assay. Cells were treated with TC7 at different concentrations (3, 6, and 12 μM) for 24 h. The number of migrated and invading cells were quantified and compared with the DMSO group. Scale bar = 100 μm in all images. (C,D) Effect of lower concentrations of TC7 at relatively short treatment times on the invasion and migration of cancer cells. (E) Effect of TC7 on the expression of proteins involved in migration and invasion by western blot and quantified by Image J software. Results are presented as mean ± SD from three independent experiments. * p < 0.05 (n = 3); ** p < 0.01 (n = 3), compared with the control group; ## p < 0.01 (n = 3), compared between two cancer cell lines.
Figure 4
Figure 4
Effect of TC7 on migration and invasion ability of PCa cells. Migration (B) and invasion (A) of PC3 and LNCAP cells was evaluated by Transwell assay. Cells were treated with TC7 at different concentrations (3, 6, and 12 μM) for 24 h. The number of migrated and invading cells were quantified and compared with the DMSO group. Scale bar = 100 μm in all images. (C,D) Effect of lower concentrations of TC7 at relatively short treatment times on the invasion and migration of cancer cells. (E) Effect of TC7 on the expression of proteins involved in migration and invasion by western blot and quantified by Image J software. Results are presented as mean ± SD from three independent experiments. * p < 0.05 (n = 3); ** p < 0.01 (n = 3), compared with the control group; ## p < 0.01 (n = 3), compared between two cancer cell lines.
Figure 5
Figure 5
Effect of TC7 on tumor growth in vivo. (A) The xenotopic tumor model in nude mice injected with PC3 cells were divided into two groups; one was intraperitoneally treated with TC7 (60 mg/kg), and the control group was treated with 0.1% DMSO every two days, nine times in total, as indicated in (A). (B) The tumor size in the TC7-treated and the control group was measured at three-day intervals as soon as TC7 was injected. (C) Tumors from the TC7-treated and the control group after 18 days treatment with TC7. (D) Tumor size in the TC7-treated and the control group after 18 days treatment with TC7. (E) Mice body weight was monitored at two-day intervals as soon as the TC7 was injected. (F) Weight change in the main organs in the mice of the TC7-treated and the control group after 18 days treatment with TC7. Results are presented as mean ± SD from three independent experiments. * p < 0.05 (n = 3); ** p < 0.01 (n = 3), compared with the control group.
Figure 5
Figure 5
Effect of TC7 on tumor growth in vivo. (A) The xenotopic tumor model in nude mice injected with PC3 cells were divided into two groups; one was intraperitoneally treated with TC7 (60 mg/kg), and the control group was treated with 0.1% DMSO every two days, nine times in total, as indicated in (A). (B) The tumor size in the TC7-treated and the control group was measured at three-day intervals as soon as TC7 was injected. (C) Tumors from the TC7-treated and the control group after 18 days treatment with TC7. (D) Tumor size in the TC7-treated and the control group after 18 days treatment with TC7. (E) Mice body weight was monitored at two-day intervals as soon as the TC7 was injected. (F) Weight change in the main organs in the mice of the TC7-treated and the control group after 18 days treatment with TC7. Results are presented as mean ± SD from three independent experiments. * p < 0.05 (n = 3); ** p < 0.01 (n = 3), compared with the control group.
Figure 6
Figure 6
The proposed cell signaling pathways used by TC7 to induce PCa cell apoptosis, cell cycle arrest, and metastasis inhibition through the regulation of p38/cyclin b1/CDC2, and p53-dependent GADD45A/PLK1, p38/P53/caspase 8, and p38/VEGF-1/MMP-9 signaling pathway.

Similar articles

Cited by

References

    1. Wang G., Zhao D., Spring D.J., Depinho R.A. Genetics and biology of prostate cancer. Genome Res. 2018;32:1105–1140. doi: 10.1101/gad.315739.118. - DOI - PMC - PubMed
    1. Narayanan S., Srinivas S., Feldman D. Androgen–glucocorticoid interactions in the era of novel prostate cancer therapy. Nat. Rev. Urol. 2015;13:47–60. doi: 10.1038/nrurol.2015.254. - DOI - PubMed
    1. Castanares M.A., Copeland B.T., Chowdhury W.H., Liu M.M., Rodriguez R., Pomper M.G., Lupold S.E., Foss C.A. Characterization of a novel metastatic prostate cancer cell line of LNCaP origin. Prostate. 2016;76:215–225. doi: 10.1002/pros.23115. - DOI - PMC - PubMed
    1. Ishikura N., Kawata H., Nishimoto A., Nakamura R., Ishii N., Aoki Y. Establishment and characterization of an androgen receptor-dependent, androgen-independent human prostate cancer cell line, LNCaP-CS10. Prostate. 2010;70:457–466. doi: 10.1002/pros.21079. - DOI - PubMed
    1. Lee S.O., Dutt S.S., Nadiminty N., Pinder E., Liao H., Gao A.C. Development of an androgen-deprivation induced and androgen suppressed human prostate cancer cell line. Prostate. 2007;67:1293–1300. doi: 10.1002/pros.20621. - DOI - PubMed

MeSH terms