

Dimensionality Reduction and Subspace Clustering in Mixed Reality for Condition Monitoring of High-Dimensional Production Data
- PMID: 31510064
- PMCID: PMC6767007
- DOI: 10.3390/s19183903
Dimensionality Reduction and Subspace Clustering in Mixed Reality for Condition Monitoring of High-Dimensional Production Data
Abstract
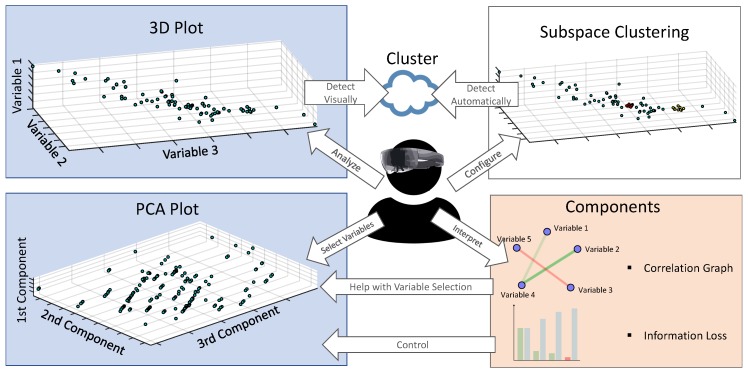
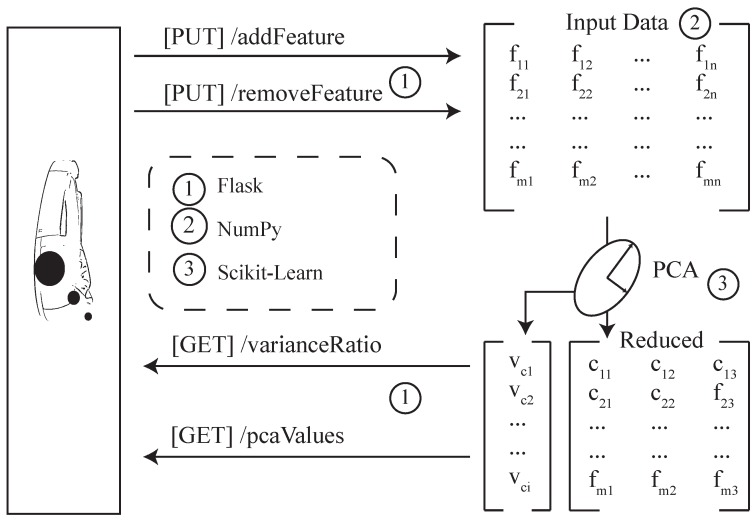
Visual analytics are becoming increasingly important in the light of big data and related scenarios. Along this trend, the field of immersive analytics has been variously furthered as it is able to provide sophisticated visual data analytics on one hand, while preserving user-friendliness on the other. Furthermore, recent hardware developments such as smart glasses, as well as achievements in virtual-reality applications, have fanned immersive analytic solutions. Notably, such solutions can be very effective when they are applied to high-dimensional datasets. Taking this advantage into account, the work at hand applies immersive analytics to a high-dimensional production dataset to improve the digital support of daily work tasks. More specifically, a mixed-reality implementation is presented that will support manufacturers as well as data scientists to comprehensively analyze machine data. As a particular goal, the prototype will simplify the analysis of manufacturing data through the usage of dimensionality reduction effects. Therefore, five aspects are mainly reported in this paper. First, it is shown how dimensionality reduction effects can be represented by clusters. Second, it is presented how the resulting information loss of the reduction is addressed. Third, the graphical interface of the developed prototype is illustrated as it provides (1) a correlation coefficient graph, (2) a plot for the information loss, and (3) a 3D particle system. In addition, an implemented voice recognition feature of the prototype is shown, which was considered to be being promising to select or deselect data variables users are interested in when analyzing the data. Fourth, based on a machine learning library, it is shown how the prototype reduces computational resources using smart glasses. The main idea is based on a recommendation approach as well as the use of subspace clustering. Fifth, results from a practical setting are presented, in which the prototype was shown to domain experts. The latter reported that such a tool is actually helpful to analyze machine data daily. Moreover, it was reported that such a system can be used to educate machine operators more properly. As a general outcome of this work, the presented approach may constitute a helpful solution for the industry as well as other domains such as medicine.
Keywords: covariance graph; dimensionality reduction; immersive analytics; mixed reality; subspace clustering.
Conflict of interest statement
The authors declare no conflict of interest.
Figures


References
-
- Gilchrist A. Industry 4.0: The Industrial Internet of Things. Apress; New York, NY, USA: 2016.
-
- Hoppenstedt B., Pryss R., Stelzer B., Meyer-Brötz F., Kammerer K., Treß A., Reichert M. Techniques and Emerging Trends for State of the Art Equipment Maintenance Systems—A Bibliometric Analysis. Appl. Sci. 2018;8:916. doi: 10.3390/app8060916. - DOI
-
- Chandler T., Cordeil M., Czauderna T., Dwyer T., Glowacki J., Goncu C., Klapperstueck M., Klein K., Marriott K., Schreiber F., et al. Immersive analytics; Proceedings of the 2015 Big Data Visual Analytics (BDVA); Hobart, Australia. 22–25 September 2015; pp. 1–8.
-
- Milgram P., Takemura H., Utsumi A., Kishino F. Telemanipulator and Telepresence Technologies. Volume 2351. International Society for Optics and Photonics; Boston, MA, USA: 1995. Augmented reality: A class of displays on the reality-virtuality continuum; pp. 282–293.
-
- Izadi S., Kim D., Hilliges O., Molyneaux D., Newcombe R., Kohli P., Shotton J., Hodges S., Freeman D., Davison A., et al. KinectFusion: Real-time 3D reconstruction and interaction using a moving depth camera; Proceedings of the 24th Annual ACM Symposium on User Interface Software and Technology; Santa Barbara, CA, USA. 16–19 October 2011; pp. 559–568.
LinkOut - more resources
Full Text Sources
Research Materials
