

Genome-Wide Identification and Expression Profiles of Late Embryogenesis-Abundant (LEA) Genes during Grain Maturation in Wheat (Triticum aestivum L.)
- PMID: 31510067
- PMCID: PMC6770980
- DOI: 10.3390/genes10090696
Genome-Wide Identification and Expression Profiles of Late Embryogenesis-Abundant (LEA) Genes during Grain Maturation in Wheat (Triticum aestivum L.)
Abstract
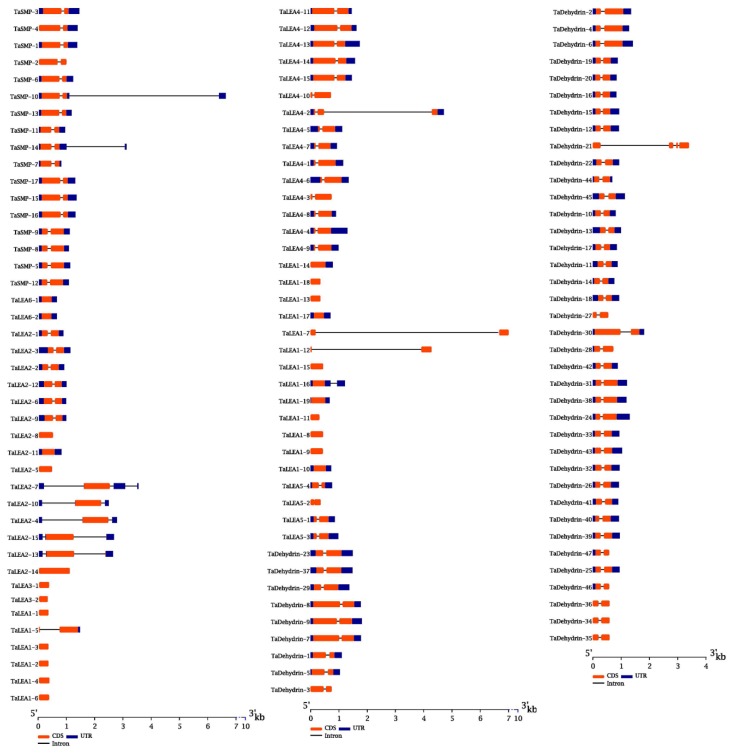
Late embryogenesis-abundant (LEA) genes play important roles in plant growth and development, especially the cellular dehydration tolerance during seed maturation. In order to comprehensively understand the roles of LEA family members in wheat, we carried out a series of analyses based on the latest genome sequence of the bread wheat Chinese Spring. 121 Triticum aestivum L. LEA (TaLEA) genes, classified as 8 groups, were identified and characterized. TaLEA genes are distributed in all chromosomes, most of them with a low number of introns (≤3). Expression profiles showed that most TaLEA genes expressed specifically in grains. By qRT-PCR analysis, we confirmed that 12 genes among them showed high expression levels during late stage grain maturation in two spring wheat cultivars, Yangmai16 and Yangmai15. For most genes, the peak of expression appeared earlier in Yangmai16. Statistical analysis indicated that expression level of 8 genes in Yangmai 16 were significantly higher than Yangmai 15 at 25 days after anthesis. Taken together, our results provide more knowledge for future functional analysis and potential utilization of TaLEA genes in wheat breeding.
Keywords: genome-wide identification; grain maturation; late embryogenesis-abundant gene; wheat (Triticum aestivum L.).
Conflict of interest statement
The authors declare no conflict of interest. The funders had no role in the design of the study; in the collection, analyses, or interpretation of data; in the writing of the manuscript, or in the decision to publish the results.
Figures


Similar articles
-
Genome-wide identification and characterization of late embryogenesis abundant protein-encoding gene family in wheat: Evolution and expression profiles during development and stress.Gene. 2020 Apr 30;736:144422. doi: 10.1016/j.gene.2020.144422. Epub 2020 Jan 31. Gene. 2020. PMID: 32007584
-
Genome-wide identification of and functional insights into the late embryogenesis abundant (LEA) gene family in bread wheat (Triticum aestivum).Sci Rep. 2019 Sep 16;9(1):13375. doi: 10.1038/s41598-019-49759-w. Sci Rep. 2019. PMID: 31527624 Free PMC article.
-
Identification of quantitative trait loci for abscisic acid responsiveness in the D-genome of hexaploid wheat.J Plant Physiol. 2014 Jun 15;171(10):830-41. doi: 10.1016/j.jplph.2014.02.003. Epub 2014 Feb 22. J Plant Physiol. 2014. PMID: 24877675
-
Physiology and Molecular Breeding in Sustaining Wheat Grain Setting and Quality under Spring Cold Stress.Int J Mol Sci. 2022 Nov 15;23(22):14099. doi: 10.3390/ijms232214099. Int J Mol Sci. 2022. PMID: 36430598 Free PMC article. Review.
-
An Overview of Factors Affecting the Functional Quality of Common Wheat (Triticum aestivum L.).Int J Mol Sci. 2023 Apr 19;24(8):7524. doi: 10.3390/ijms24087524. Int J Mol Sci. 2023. PMID: 37108683 Free PMC article. Review.
Cited by
-
Genome-Wide Identification and Low Temperature Responsive Pattern of Actin Depolymerizing Factor (ADF) Gene Family in Wheat (Triticum aestivum L.).Front Plant Sci. 2021 Feb 24;12:618984. doi: 10.3389/fpls.2021.618984. eCollection 2021. Front Plant Sci. 2021. PMID: 33719289 Free PMC article.
-
Genome-wide identification and characterization of members of the LEA gene family in Panax notoginseng and their transcriptional responses to dehydration of recalcitrant seeds.BMC Genomics. 2023 Mar 17;24(1):126. doi: 10.1186/s12864-023-09229-0. BMC Genomics. 2023. PMID: 36932328 Free PMC article.
-
Genome-wide search and structural and functional analyses for late embryogenesis-abundant (LEA) gene family in poplar.BMC Plant Biol. 2021 Feb 24;21(1):110. doi: 10.1186/s12870-021-02872-3. BMC Plant Biol. 2021. PMID: 33627082 Free PMC article.
-
Genome-wide identification and expression analysis of late embryogenesis abundant protein-encoding genes in rye (Secale cereale L.).PLoS One. 2021 Apr 8;16(4):e0249757. doi: 10.1371/journal.pone.0249757. eCollection 2021. PLoS One. 2021. PMID: 33831102 Free PMC article.
-
Genome-Wide Identification and Expression Pattern Analysis of the Late Embryogenesis Abundant (LEA) Family in Foxtail Millet (Setaria italica L.).Genes (Basel). 2025 Aug 4;16(8):932. doi: 10.3390/genes16080932. Genes (Basel). 2025. PMID: 40869980 Free PMC article.
References
-
- Roberts E.H. Predicting the storage life of seeds. Seed Sci. Technol. 1973;1:499–514.
Publication types
MeSH terms
Substances
LinkOut - more resources
Full Text Sources
