. 2019 Jul 15;35(14):i436-i445.
doi: 10.1093/bioinformatics/btz363.

Comprehensive evaluation of transcriptome-based cell-type quantification methods for immuno-oncology

Affiliations

Comprehensive evaluation of transcriptome-based cell-type quantification methods for immuno-oncology

Gregor Sturm et al. Bioinformatics. .

Abstract

Motivation: The composition and density of immune cells in the tumor microenvironment (TME) profoundly influence tumor progression and success of anti-cancer therapies. Flow cytometry, immunohistochemistry staining or single-cell sequencing are often unavailable such that we rely on computational methods to estimate the immune-cell composition from bulk RNA-sequencing (RNA-seq) data. Various methods have been proposed recently, yet their capabilities and limitations have not been evaluated systematically. A general guideline leading the research community through cell type deconvolution is missing.

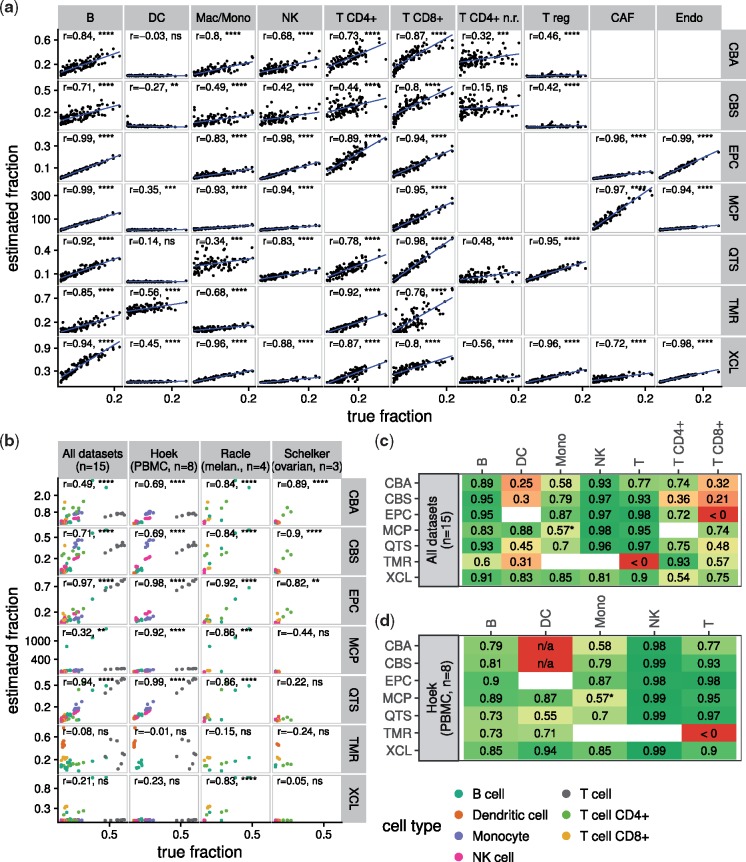
Results: We developed a systematic approach for benchmarking such computational methods and assessed the accuracy of tools at estimating nine different immune- and stromal cells from bulk RNA-seq samples. We used a single-cell RNA-seq dataset of ∼11 000 cells from the TME to simulate bulk samples of known cell type proportions, and validated the results using independent, publicly available gold-standard estimates. This allowed us to analyze and condense the results of more than a hundred thousand predictions to provide an exhaustive evaluation across seven computational methods over nine cell types and ∼1800 samples from five simulated and real-world datasets. We demonstrate that computational deconvolution performs at high accuracy for well-defined cell-type signatures and propose how fuzzy cell-type signatures can be improved. We suggest that future efforts should be dedicated to refining cell population definitions and finding reliable signatures.

Availability and implementation: A snakemake pipeline to reproduce the benchmark is available at https://github.com/grst/immune_deconvolution_benchmark. An R package allows the community to perform integrated deconvolution using different methods (https://grst.github.io/immunedeconv).

Supplementary information: Supplementary data are available at Bioinformatics online.


Figures

Fig. 1.
Fig. 1.
(a) Correlation of predicted versus known cell type fractions on 100 simulated bulk RNA-seq samples generated from single cell RNA-seq. Pearson’s r is indicated in each panel. Due to the lack of a corresponding signature, we estimated macrophages/monocytes with EPIC using the ‘macrophage’ signature and with MCP-counter using the ‘monocytic lineage’ signature as a surrogate. (b) Performance of the methods on three independent datasets that provide immune cell quantification by FACS. Different cell types are indicated in different colors. Pearson’s r has been computed as a single correlation on all cell types simultaneously. Note that only methods that allow both inter- and intra-sample comparisons (i.e. EPIC, quanTIseq, CIBERSORT absolute mode) can be expected to perform well here. (c–d) Performance on the three validation datasets per cell type. Schelker’s and Racle’s dataset have too few samples to be considered individually. The values indicate Pearson correlation of the predictions with the cell type fractions determined using FACS. Blank squares indicate that the method does not provide a signature for the respective cell type. ‘n/a’ values indicate that no correlation could be computed because all predictions were zero. The asterisk (*) indicates that the ‘monocytic lineage’ signature was used as a surrogate to predict monocyte content. P-values: **** < 0.0001; *** < 0.001; ** < 0.01; * < 0.05; ns 0.05. P-values are not adjusted for multiple testing. Method abbreviations: see Table 1
Fig. 2.
Fig. 2.
Minimal detection fraction and background prediction level. For each panel, we created simulated bulk RNA-seq samples with an increasing amount of the cell type of interest and a background of 1000 cells randomly sampled from the other cell types. The dots show the mean predicted score across five independently simulated samples for each fraction of spike-in cells. The grey ribbon indicates the 95% confidence interval. The red line refers to the minimal detection fraction, i.e. the minimal fraction of an immune cell type needed for a method to reliably detect its abundance as significantly different from the background (P-value < 0.05, one-sided t-test). The blue line refers to the background prediction level, i.e. the average estimate of a method while the cell type of interest is absent. Method abbreviations: see Table 1
Fig. 3.
Fig. 3.
Spillover analysis. All methods were applied to simulated bulk RNA-seq samples containing only cells of one of the nine immune and non-immune cell types. The outer circle indicates the different samples, the connections within refer to the methods’ predictions. The size of a border segment is reflective of the predicted score on that cell type. A connection leading to a border segment of the same color indicates a correctly predicted cell type fraction; a connection leading to a different color indicates spillover, i.e. a prediction of a different cell type than actually present. Note that not all methods provide signatures for all cell types, in that case the connections are indicative of the cell types wrongly predicted when a method is confronted with cell types it has not been optimized for. CD4+ T cell samples are an aggregate of regulatory and non-regulatory CD4+ T cells. The numbers in the center indicate the overall noise ratio, i.e. the fraction of predictions that are attributed to a wrong cell type. Method abbreviations: Table 1
Fig. 4.
Fig. 4.
(a) Background prediction level of quanTIseq before and after removing nonspecific signature genes. This plot is based on the same five simulated samples used to determine the background prediction level in the Mac/Mono panel of Figure 2. (b) B cell score on ten simulated pDC samples before and after removing nonspecific signature genes. Method abbreviations: Table 1

Similar articles

Cited by

References

    1. Aran D. (2018) xcell repository on GitHub. https://github.com/dviraran/xCell/blob/ce4d43121c4a161b1e72a50dc875e43d9... (20 September 2018, date last accessed).
    1. Aran D. et al. (2017) xcell: digitally portraying the tissue cellular heterogeneity landscape. Genome Biol., 18, 220.. - PMC - PubMed
    1. Avila Cobos F. et al. (2018) Computational deconvolution of transcriptomics data from mixed cell populations. Bioinformatics, 34, 1969–1979. - PubMed
    1. Azizi E. et al. (2018) Single-cell map of diverse immune phenotypes in the breast tumor microenvironment. Cell, 174, 1293–1308. - PMC - PubMed
    1. Becht E. et al. (2016) Estimating the population abundance of tissue-infiltrating immune and stromal cell populations using gene expression. Genome Biol., 17, 218.. - PMC - PubMed

Publication types