. 2019 Jul 15;35(14):i99-i107.
doi: 10.1093/bioinformatics/btz317.

hicGAN infers super resolution Hi-C data with generative adversarial networks

Affiliations

hicGAN infers super resolution Hi-C data with generative adversarial networks

Qiao Liu et al. Bioinformatics. .

Abstract

Motivation: Hi-C is a genome-wide technology for investigating 3D chromatin conformation by measuring physical contacts between pairs of genomic regions. The resolution of Hi-C data directly impacts the effectiveness and accuracy of downstream analysis such as identifying topologically associating domains (TADs) and meaningful chromatin loops. High resolution Hi-C data are valuable resources which implicate the relationship between 3D genome conformation and function, especially linking distal regulatory elements to their target genes. However, high resolution Hi-C data across various tissues and cell types are not always available due to the high sequencing cost. It is therefore indispensable to develop computational approaches for enhancing the resolution of Hi-C data.

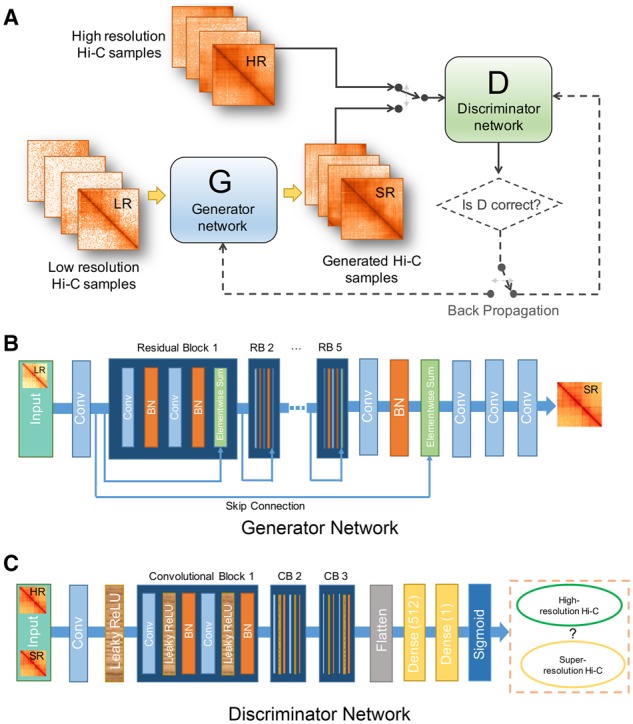
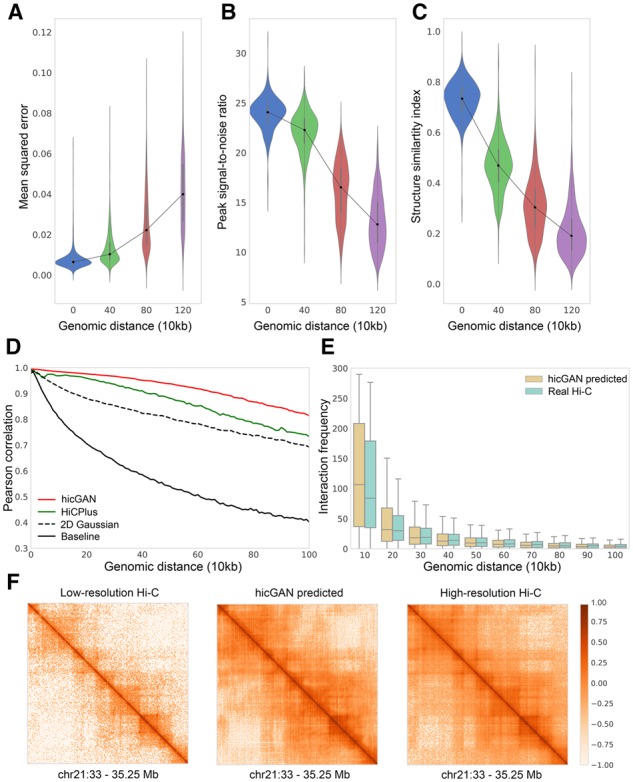
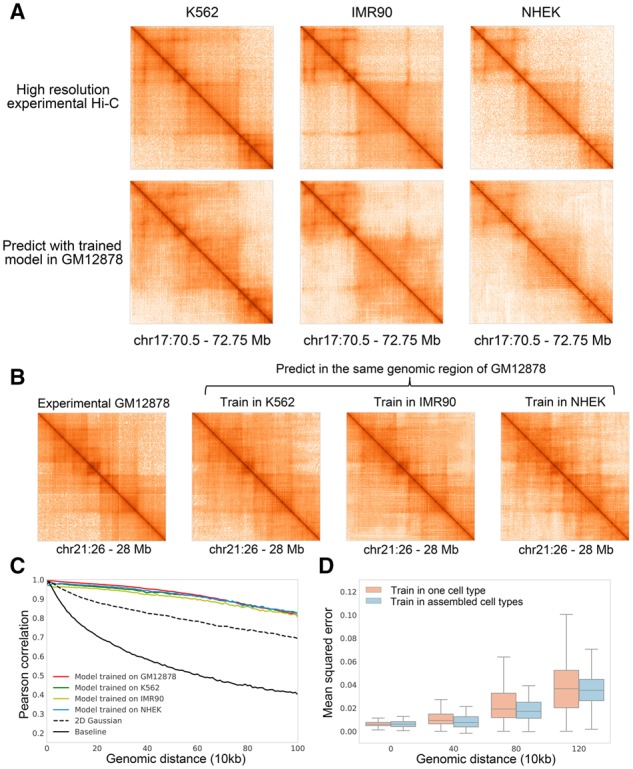
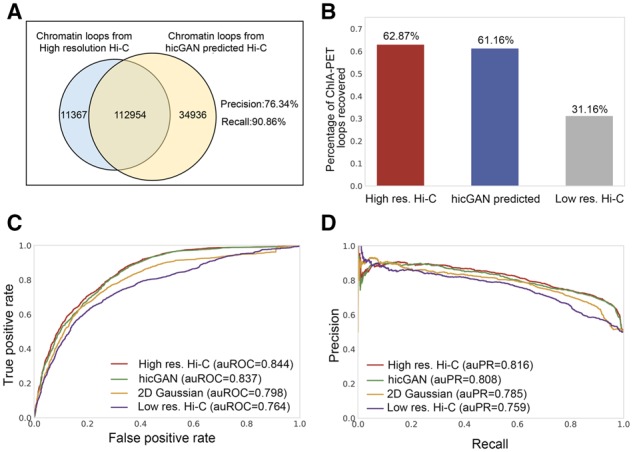
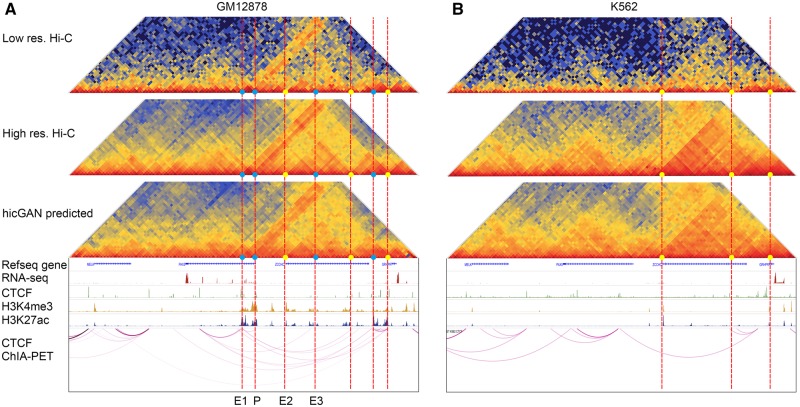
Results: We proposed hicGAN, an open-sourced framework, for inferring high resolution Hi-C data from low resolution Hi-C data with generative adversarial networks (GANs). To the best of our knowledge, this is the first study to apply GANs to 3D genome analysis. We demonstrate that hicGAN effectively enhances the resolution of low resolution Hi-C data by generating matrices that are highly consistent with the original high resolution Hi-C matrices. A typical scenario of usage for our approach is to enhance low resolution Hi-C data in new cell types, especially where the high resolution Hi-C data are not available. Our study not only presents a novel approach for enhancing Hi-C data resolution, but also provides fascinating insights into disclosing complex mechanism underlying the formation of chromatin contacts.

Availability and implementation: We release hicGAN as an open-sourced software at https://github.com/kimmo1019/hicGAN.

Supplementary information: Supplementary data are available at Bioinformatics online.


Figures

Fig. 1.
Fig. 1.
The overall schematic of hicGAN. (A) hicGAN consists of two competitive networks. G tries to generate super resolution samples that are highly similar to real high resolution samples while D tries to discriminate generated super resolution samples from real high resolution Hi-C samples. Parameters of G and D are updated through an adversarial training process. (B) The architecture of the generator network. Generator network adopts a novel dual-stream residual architecture which contains five inner residual blocks (RBs) and an outer skip connection. Rectangles with different colors represent different functional layers. Blue denotes convolutional layer, orange denotes batch normalization layer and green denotes an operation of element-wise summation of the previous layer’s output and the output of the skipped layer. It outputs a super resolution Hi-C sample given an insufficient sequenced Hi-C sample as input. (C) The architecture of discriminator network. Discriminator network is a typical deep convolutional neural network. The convolutional part has been modularized as three convolutional blocks. It outputs the estimated probability that the input is a high resolution Hi-C sample
Fig. 2.
Fig. 2.
Evaluation of Hi-C data generated by hicGAN in GM12878 cell type. Model training was performed on chromosomes 1–17, model evaluation was performed on chromosomes 18–22. (A-C) Mean squared error (MSE), peak signal-to-noise ratio (PSNR) and structure similarity index (SSIM) measurements between high resolution Hi-C samples and super resolution samples generated by hicGAN. (D) The Pearson correlation coefficients (PCCs) between real Hi-C data and predicted Hi-C data under different genomic distance. hicGAN significantly outperforms other methods in different genomic distance. (E) The distribution of interaction frequency within different genomic ranges (e.g. 0–10 kb, 10–20 kb, etc.) observed from real high resolution Hi-C data and Hi-C data predicted by hicGAN. The distribution of interaction frequency captured by hicGAN is highly consistent with real Hi-C data. (F) An example shows the low resolution Hi-C sample (left), Hi-C sample predicted by hicGAN (middle) and high resolution Hi-C sample (right). Hi-C sample generated by hicGAN is highly similar to high resolution Hi-C sample
Fig. 3.
Fig. 3.
Cross-cell-type experiments by hicGAN. Training data is obtained from chromosomes 1–17 and test data is obtained from chromosomes 18–22. (A) hicGAN model trained in GM12878 cell type was used for generating super resolution Hi-C samples (chr17: 70.5–72.75Mb) in three other cell types (K562, IMR90 and NHEK). The generated Hi-C samples are highly similar to the high resolution Hi-C samples in the corresponding cell type. (B) hicGAN model was trained in three cell types (K562, IMR90 and NHEK), respectively. Then the trained hicGAN model in each cell type was used for predicted in the same genomic region of GM12878 (chr21: 26–28 Mb). No matter which cell type the hicGAN was trained in, it can generate Hi-C sample that is highly consistent to the original high resolution Hi-C sample in GM12878. (C) We trained four hicGAN models on chromosomes 1–17 of GM12878, K562, IMR90 and NHEK, respectively. Then we used the four trained hicGAN model to predict Hi-C samples on chromosomes 18–22 of GM12878. The performance of model trained in K562, IMR90 and NHEK drops slightly compared to model trained in GM12878. The four hicGAN models outperform 2D Gaussian and baseline by a large margin. (D) We pooled the Hi-C samples on chromosomes 1–17 of four cell types (K562, IMR90, GM12878 and NHEK) together and trained a hicGAN with the constructed assembled Hi-C dataset. For comparison, we trained a baseline hicGAN model on chromosomes 1–17 of K562 cell types. We used the above two hicGAN models to predict Hi-C samples on chromosomes 18–22 of K562 cell type. Model trained in assembled cell types achieves slightly lower mean squared error and lower variance, especially at long genomic distance
Fig. 4.
Fig. 4.
Evaluation of significant chromatin loop inferred from Hi-C data predicted by hicGAN model. (A) The Venn plot of the significant chromatin loops from high resolution Hi-C data and Hi-C data predicted by hicGAN model in GM12878 cell type using Fit-Hi-C software with a strict threshold (q-value < 1e−06). More than 90 percent of the significant chromatin loops from real high resolution Hi-C data can be also identified in Hi-C data predicted by hicGAN. (B) High resolution Hi-C data and Hi-C data predicted recovers comparable percentage of ChIA-PET chromatin loops while down-sampled low resolution Hi-C data recovers much less ChIA-PET chromatin loops. (C) The receiver operating characteristic (ROC) curve in discerning ChIA-PET chromatin loops from random pairs of CTCF ChIP-seq peaks. High resolution H-C data and Hi-C data predicted by hicGAN model achieve comparable results with the areas under ROC curve (auROCs) 0.844 versus 0.837, which outperform 2D Gaussian and down-sampled low resolution Hi-C. (D) The precision-recall curve in discerning ChIA-PET chromatin loops from random pairs of CTCF ChIP-seq peaks. The areas under precision-recall curve (auPRs) implicates the consistent conclusion
Fig. 5.
Fig. 5.
Three types of Hi-C data extracted from a differential genomic region (chr9: 36.5–37.5 M) between GM12878 and K562 cell type. Several annotation tracks, including RNA-seq, ChIP-seq with CTCF, ChIP-seq with two histone modifications and ChIA-PET with CTCF target across two cell types were also shown below the Hi-C data. The high resolution Hi-C data and Hi-C data predicted by hicGAN have significantly clearer chromatin contact boundaries compared to down-sampled low resolution Hi-C data. We observed that a B cell important regulator, Pax5, only expressed in GM12878 cell type. Hi-C data also reveals promoter-enhancer interactions which is highly consistent with the signals from the two histone markers (a promoter P and three potential enhancers E1-E3 were denoted in GM12878). More importantly, we noticed that the above two cell types contain common contact domain boundaries and cell-type specific contact domain boundaries (GM12878 specific contact boundaries were shown with blue dots and the common domain boundaries were shown with yellow dots). (A) Hi-C maps and annotation tracks in GM12878 cell type. (B) Hi-C maps and annotation tracks in K562 cell type

References

    1. Abadi M. et al. (2016) Tensorflow: a system for large-scale machine learning In: OSDI, Savannah, GA, USA, pp. 265–283. USENIX.
    1. Alipanahi B. et al. (2015) Predicting the sequence specificities of DNA- and RNA-binding proteins by deep learning. Nat. Biotechnol., 33, 831–838. - PubMed
    1. Ay F. et al. (2014) Statistical confidence estimation for Hi-C data reveals regulatory chromatin contacts. Genome Res., 24, 999–1011. - PMC - PubMed
    1. Consortium E.P. (2012) An integrated encyclopedia of DNA elements in the human genome. Nature, 489, 57–74. - PMC - PubMed
    1. Dekker J. et al. (2002) Capturing chromosome conformation. Science, 295, 1306–1311. - PubMed

Publication types