. 2019 Nov 1;294(44):16095-16108.
doi: 10.1074/jbc.RA119.009049. Epub 2019 Sep 11.

Unexpected roles for ADH1 and SORD in catalyzing the final step of erythritol biosynthesis

Affiliations

Unexpected roles for ADH1 and SORD in catalyzing the final step of erythritol biosynthesis

Lisa Schlicker et al. J Biol Chem. .

Abstract

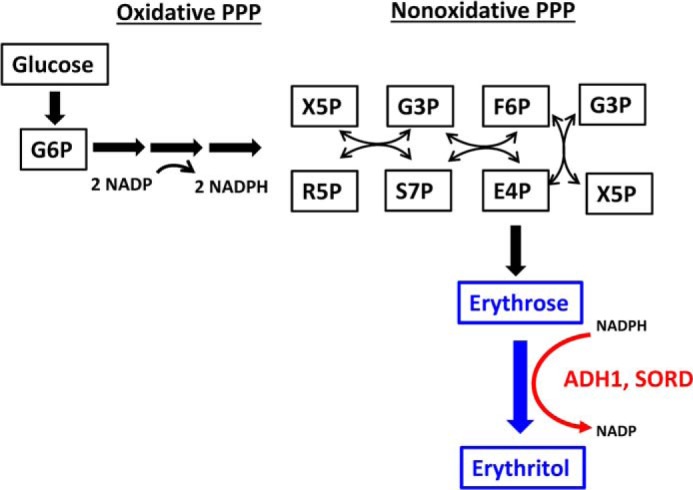
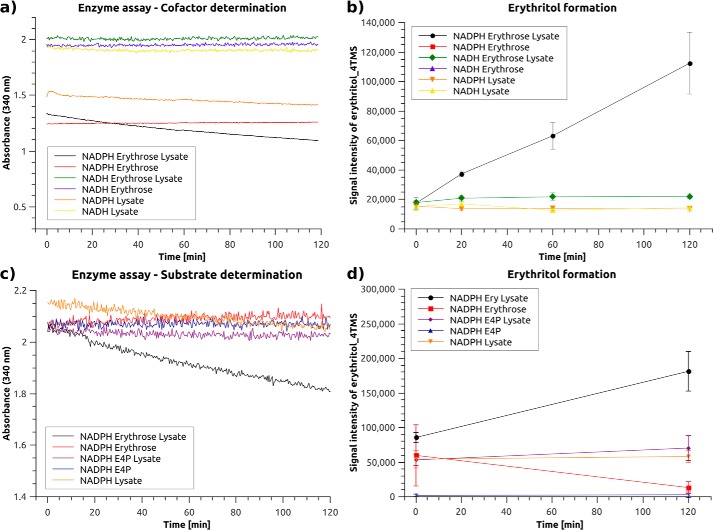
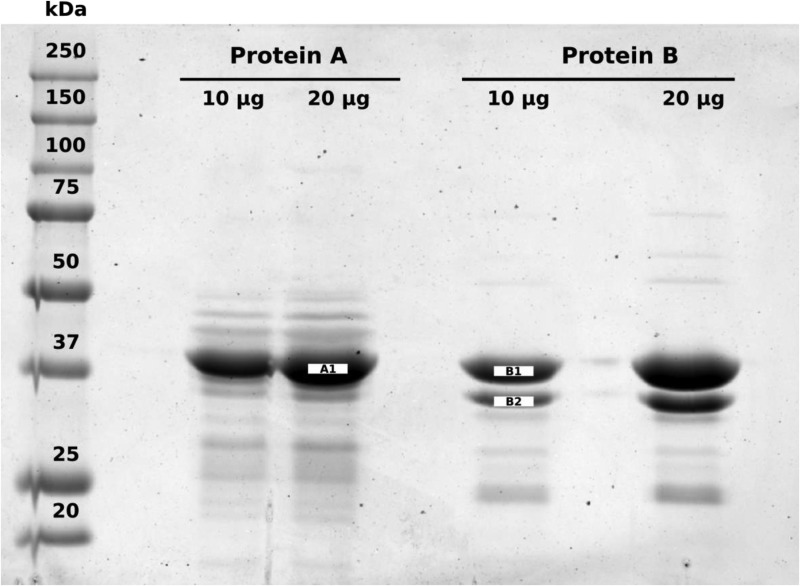
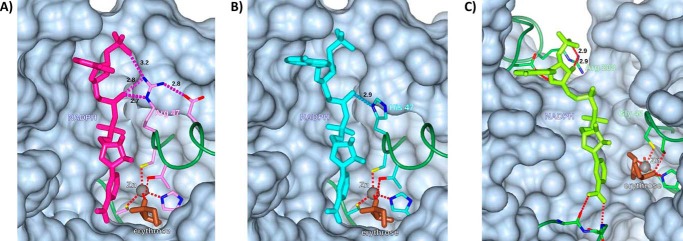
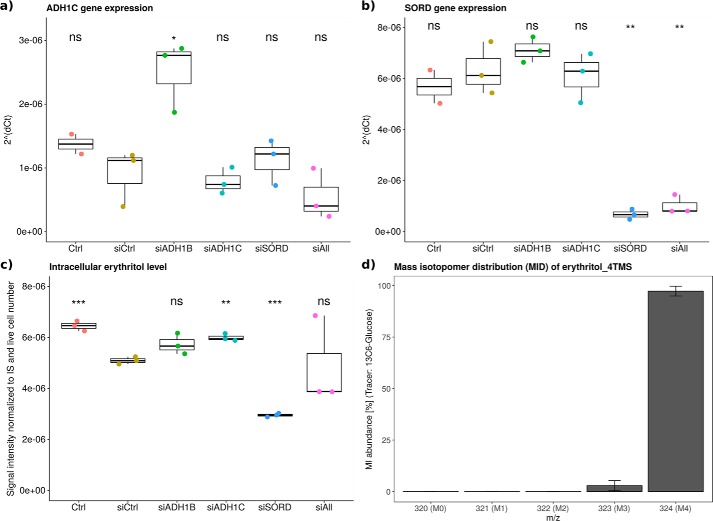
The low-calorie sweetener erythritol is endogenously produced from glucose through the pentose phosphate pathway in humans. Erythritol is of medical interest because elevated plasma levels of this polyol are predictive for visceral adiposity gain and development of type 2 diabetes. However, the mechanisms behind these associations remain unknown because the erythritol biosynthesis pathway, particularly the enzyme catalyzing the final step of erythritol synthesis (reduction of erythrose to erythritol), is not characterized. In this study, we purified two enzymes from rabbit liver capable of catalyzing the conversion of erythrose to erythritol: alcohol dehydrogenase 1 (ADH1) and sorbitol dehydrogenase (SORD). Both recombinant human ADH1 and SORD reduce erythrose to erythritol, using NADPH as a co-factor, and cell culture studies indicate that this activity is primarily NADPH-dependent. We found that ADH1 variants vary markedly in both their affinity for erythrose and their catalytic capacity (turnover number). Interestingly, the recombinant protein produced from the ADH1B2 variant, common in Asian populations, is not active when NADPH is used as a co-factor in vitro We also confirmed SORD contributes to intracellular erythritol production in human A549 lung cancer cells, where ADH1 is minimally expressed. In summary, human ADH1 and SORD catalyze the conversion of erythrose to erythritol, pointing to novel roles for two dehydrogenase proteins in human glucose metabolism that may contribute to individual responses to diet. Proteomics data are available via ProteomeXchange with identifier PXD015178.

Keywords: alcohol dehydrogenase (ADH); biomarker; enzyme catalysis; enzyme kinetics; erythritol; glucose metabolism; sorbitol dehydrogenase.


Conflict of interest statement

The authors declare that they have no conflicts of interest with the contents of this article

Figures

Figure 1.
Figure 1.
Conversion of glucose to erythritol via the pentose phosphate pathway. Stable isotope tracers indicated that glucose was converted to erythritol through the pentose phosphate pathway in human cells (3). Here we demonstrate that the substrate for erythritol synthesis is erythrose, not erythrose-4-phosphate and that the required cofactor in human cells is NADPH. In addition, this reaction is catalyzed by ADH1 and SORD. F6P, fructose 6-phosphate; G3P, glyceraldehyde 3-phosphate; G6P, glucose 6-phosphate; R5P, ribose 5-phosphate; S7P, sedoheptulose 7-phosphate; X5P, xylulose 5-phosphate.
Figure 2.
Figure 2.
The cofactor NADPH is required for erythritol synthesis activity in A549 lung cancer cell lysate. Enzyme activity assay for (a) cofactor (NADH or NADPH) and (c) substrate (erythrose or E4P) determination using A549 lung cancer cell lysate; b and d, GC-MS measurement of erythritol_4TMS extracted from the enzyme activity assay mixture of all tested conditions tested at specified time points to confirm the production of erythritol (n = 3, representative results).
Figure 3.
Figure 3.
Two protein fractions (A and B) purified from rabbit liver exhibit erythrose reduction activity. Each pure protein fraction was loaded in duplicate (10 and 20 μg of total protein) on a 10% Tris glycine SDS-PAGE gel and visualized using Coomassie Brilliant Blue R-250. Molecular weights are defined by Precision Plus ProteinTM All Blue Prestained Protein Standards (Bio-Rad). The 37-kDa band from the 20 μg lane for protein A and the 10 μg lane for protein B were excised, digested, and analyzed using LC-MS/MS. In addition, the smaller band in “fraction B” was also analyzed and determined to be a degradation product of the 37-kDa protein due to the high degree of identity of identified peptides between the 37- and 35-kDa bands.
Figure 4.
Figure 4.
Active site model of the ADH1B1, ADH1B2, SORD, erythrose, and NADPH complex. Modeled NADP(H) binding sites for (A) ADH1B1, (B) ADH1B2, and (C) SORD. In ADH1B1, residue Arg-47 makes 3 H-bonds with NADP(H); in the B2 variant the corresponding residue, His-47, makes only one. In SORD, the corresponding residue is Gly-45; it makes no contacts with NADP(H), but residue Arg-208 is in position for H-bonding. Modeled H-bonds are labeled with their lengths, in Ångstroms. Zinc (gray) and a modeled bound erythrose (brown) are included, with their coordinating residues. The main chain is shown as a green “worm” except for residues involved in coordinating ligands. Protein surrounding the active site is shown as a gray surface, with portions in front of the ligands omitted for clarity. The figure was prepared with the program CCP4MG.
Figure 5.
Figure 5.
SORD contributes to intracellular erythritol in A549 lung cancer cells. Validation of gene expression knockdown, intracellular erythritol levels, and erythritol labeling from [U-13C]glucose. mRNA levels were determined by quantitative real-time PCR for (a) ADH1C and (b) SORD, (c) resulting intracellular erythritol levels represented by the measurement of the derivative erythritol_4TMS: signal intensity was normalized to internal standard (IS) d6-pentanedioic acid and live cell number. d, MID of erythritol_4TMS (mean ± S.E.) after 30 h of [U-13C]glucose labeling in A549 lung cancer cells, extraction and derivatization; obtained p values compared with siCtrl using Welch's t test and Bonferroni correction (n = 5) to adjust for multiple comparison: *, p < 0.05; **, p < 0.01; ***, p < 0.001 (n = 4, representative results).

References

    1. Rzechonek D. A., Dobrowolski A., Rymowicz W., and Mirończuk A. M. (2018) Recent advances in biological production of erythritol. Crit. Rev. Biotechnol 38, 620–633 10.1080/07388551.2017.1380598 - DOI - PubMed
    1. Munro I., Bernt W., Borzelleca J., Flamm G., Lynch B. S., Kennepohl E., Bär E. A., Modderman J., and Bernt W. O. (1998) Erythritol: an interpretive summary of biochemical, metabolic, toxicological and clinical data. Food Chem. Toxicol. 36, 1139–1174 10.1016/S0278-6915(98)00091-X - DOI - PubMed
    1. Hootman K. C., Trezzi J.-P., Kraemer L., Kraemer L., Burnwell L. S., Dong X., Guertin K. A., Jaeger C., Stober P. J., Hiller K., and Cassano P. A. (2017) Erythritol is a pentose-phosphate pathway metabolite and associated with adiposity gain in young adults. Proc. Natl. Acad. Sci. U.S.A. 114, E4233–E4240 10.1073/pnas.1620079114 - DOI - PMC - PubMed
    1. Rebholz C. M., Yu B., Zheng Z., Chang P., Tin A., Köttgen A., Wagenknecht L. E., Coresch J., Boerwinkle E., and Selvin E. (2018) Serum metabolomic profile of incident diabetes. Diabetologia 61, 1046–1054 10.1007/s00125-018-4573-7 - DOI - PMC - PubMed
    1. Hiele M., Ghoos Y., Rutgeerts P., and Vantrappen G. (1993) Metabolism of erythritol in humans: Comparison with glucose and lactitol. Br. J. Nutr. 69, 169 10.1079/BJN19930019 - DOI - PubMed

Publication types