

Spontaneous whole-genome duplication restores fertility in interspecific hybrids
- PMID: 31511504
- PMCID: PMC6739354
- DOI: 10.1038/s41467-019-12041-8
Spontaneous whole-genome duplication restores fertility in interspecific hybrids
Abstract
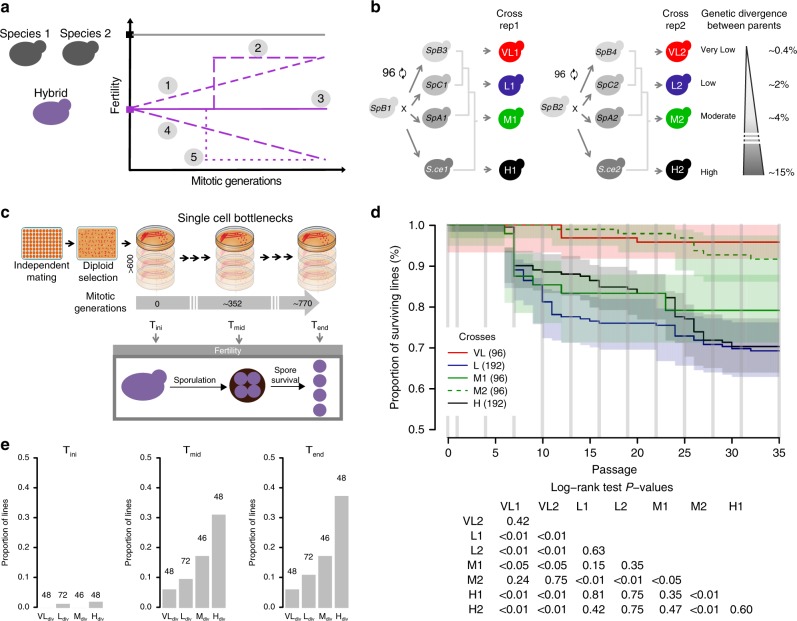
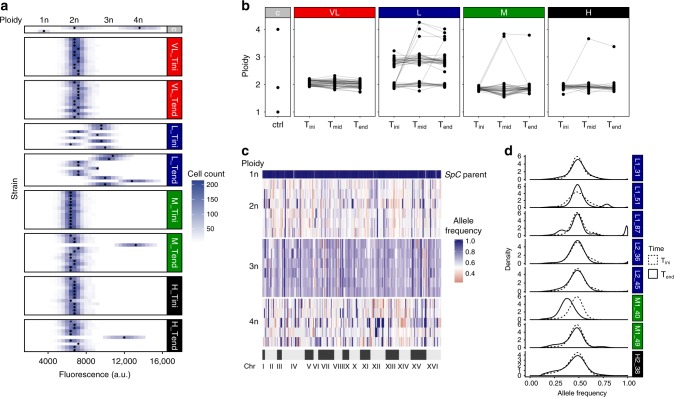
Interspecies hybrids often show some advantages over parents but also frequently suffer from reduced fertility, which can sometimes be overcome through sexual reproduction that sorts out genetic incompatibilities. Sex is however inefficient due to the low viability or fertility of hybrid offspring and thus limits their evolutionary potential. Mitotic cell division could be an alternative to fertility recovery in species such as fungi that can also propagate asexually. Here, to test this, we evolve in parallel and under relaxed selection more than 600 diploid yeast inter-specific hybrids that span from 100,000 to 15 M years of divergence. We find that hybrids can recover fertility spontaneously and rapidly through whole-genome duplication. These events occur in both hybrids between young and well-established species. Our results show that the instability of ploidy in hybrid is an accessible path to spontaneous fertility recovery.
Conflict of interest statement
The authors declare no competing interests.
Figures


Similar articles
-
Effect of Whole-Genome Duplication on the Evolutionary Rescue of Sterile Hybrid Monkeyflowers.Plant Commun. 2020 Jul 3;1(6):100093. doi: 10.1016/j.xplc.2020.100093. eCollection 2020 Nov 9. Plant Commun. 2020. PMID: 33367262 Free PMC article.
-
Evolutionary restoration of fertility in an interspecies hybrid yeast, by whole-genome duplication after a failed mating-type switch.PLoS Biol. 2017 May 16;15(5):e2002128. doi: 10.1371/journal.pbio.2002128. eCollection 2017 May. PLoS Biol. 2017. PMID: 28510588 Free PMC article.
-
The neutral rate of whole-genome duplication varies among yeast species and their hybrids.Nat Commun. 2021 May 25;12(1):3126. doi: 10.1038/s41467-021-23231-8. Nat Commun. 2021. PMID: 34035259 Free PMC article.
-
Evolutionary role of interspecies hybridization and genetic exchanges in yeasts.Microbiol Mol Biol Rev. 2012 Dec;76(4):721-39. doi: 10.1128/MMBR.00022-12. Microbiol Mol Biol Rev. 2012. PMID: 23204364 Free PMC article. Review.
-
Polyploidy and interspecific hybridization: partners for adaptation, speciation and evolution in plants.Ann Bot. 2017 Aug 1;120(2):183-194. doi: 10.1093/aob/mcx079. Ann Bot. 2017. PMID: 28854567 Free PMC article. Review.
Cited by
-
The Role of Structural Variation in Adaptation and Evolution of Yeast and Other Fungi.Genes (Basel). 2021 May 8;12(5):699. doi: 10.3390/genes12050699. Genes (Basel). 2021. PMID: 34066718 Free PMC article. Review.
-
Interspecific hybridization as a driver of fungal evolution and adaptation.Nat Rev Microbiol. 2021 Aug;19(8):485-500. doi: 10.1038/s41579-021-00537-4. Epub 2021 Mar 25. Nat Rev Microbiol. 2021. PMID: 33767366 Review.
-
A yeast living ancestor reveals the origin of genomic introgressions.Nature. 2020 Nov;587(7834):420-425. doi: 10.1038/s41586-020-2889-1. Epub 2020 Nov 11. Nature. 2020. PMID: 33177709
-
Hybrid adaptation is hampered by Haldane's sieve.Nat Commun. 2024 Nov 28;15(1):10319. doi: 10.1038/s41467-024-54105-4. Nat Commun. 2024. PMID: 39609385 Free PMC article.
-
Loss of Heterozygosity Spectrum Depends on Ploidy Level in Natural Yeast Populations.Mol Biol Evol. 2022 Nov 3;39(11):msac214. doi: 10.1093/molbev/msac214. Mol Biol Evol. 2022. PMID: 36205042 Free PMC article.
References
Publication types
MeSH terms
LinkOut - more resources
Full Text Sources
Molecular Biology Databases
Research Materials
