. 2019 Sep 11;10(1):4107.
doi: 10.1038/s41467-019-11400-9.

Circadian control of lung inflammation in influenza infection

Affiliations

Circadian control of lung inflammation in influenza infection

Shaon Sengupta et al. Nat Commun. .

Abstract

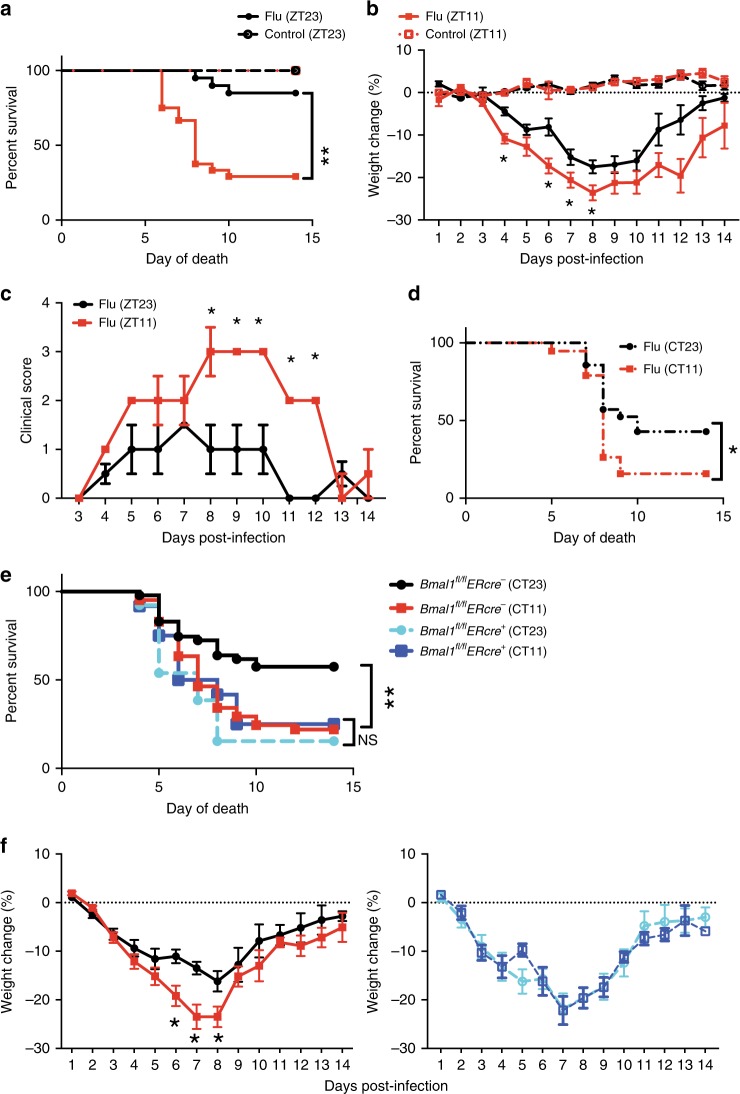
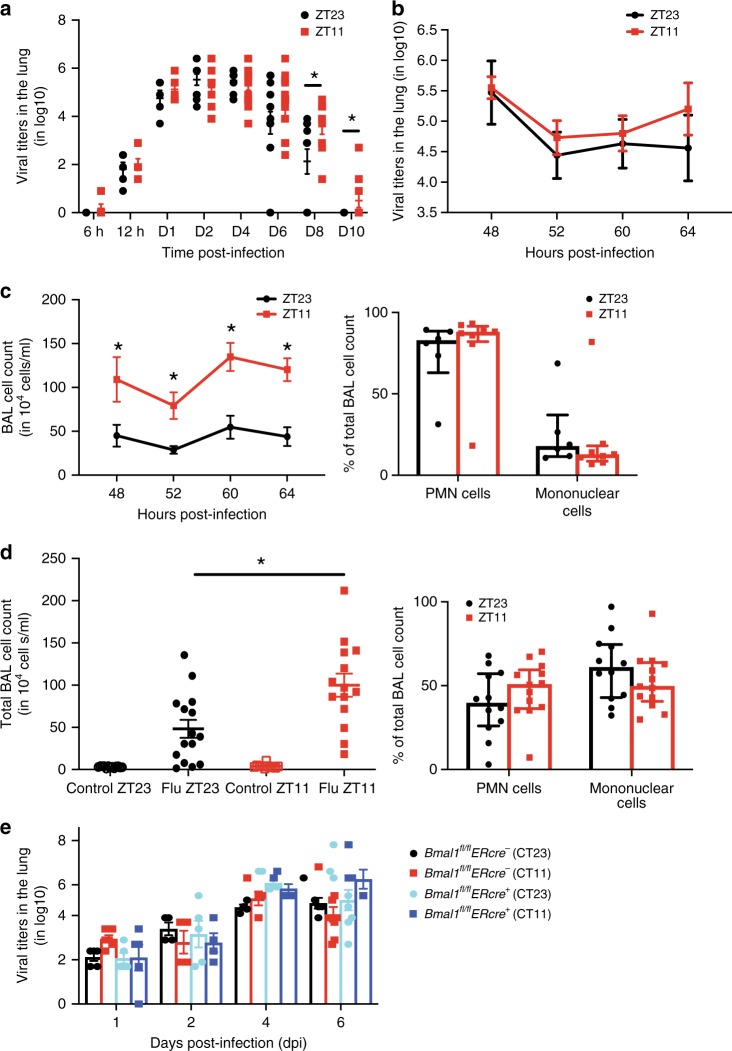
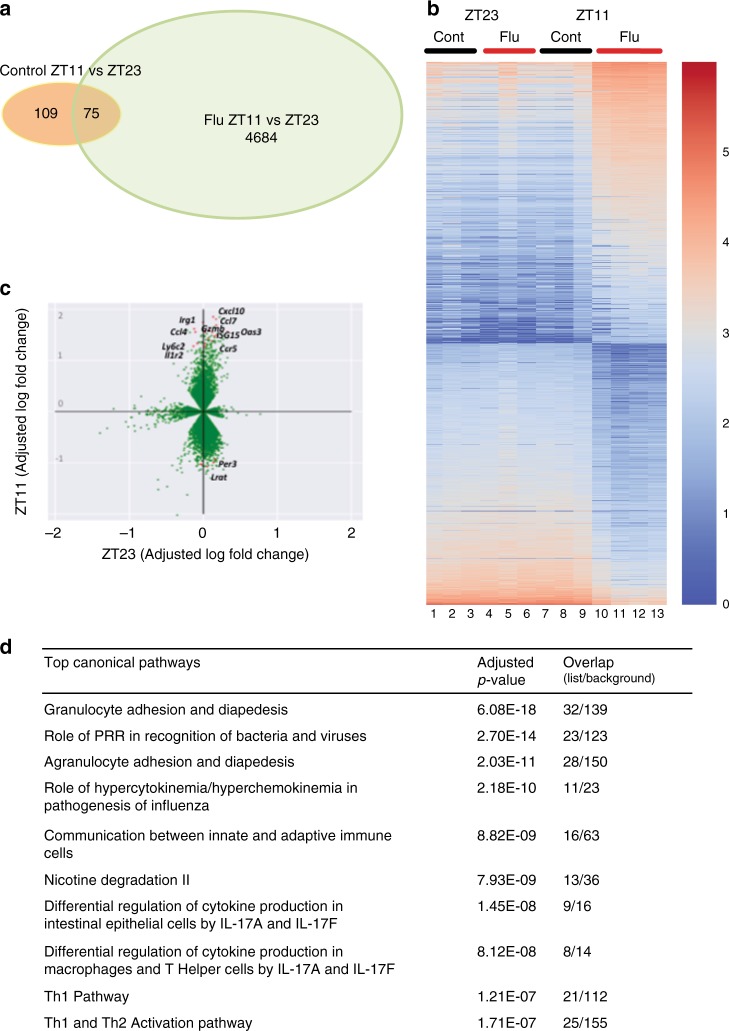
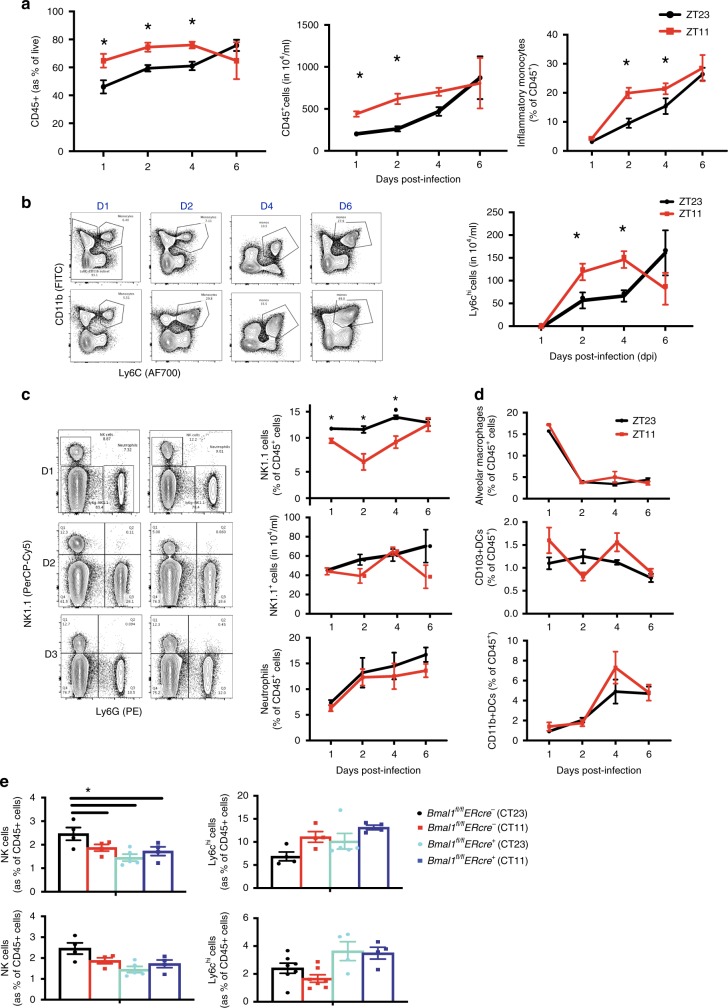
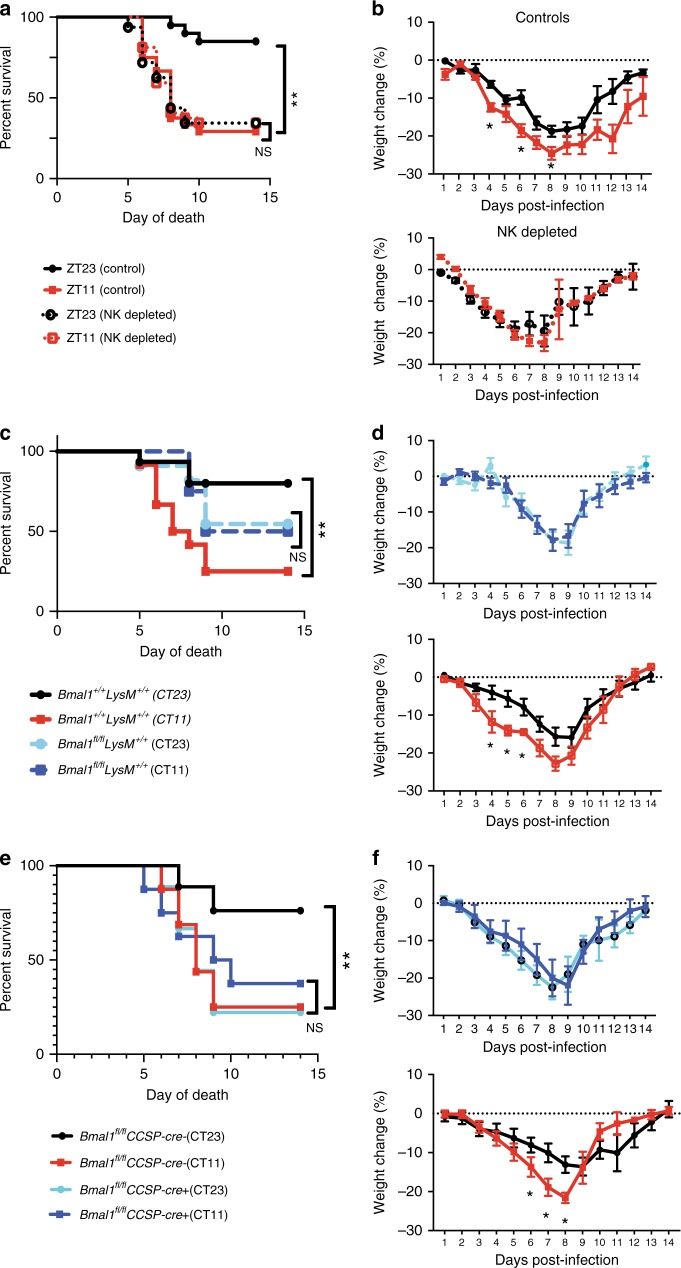
Influenza is a leading cause of respiratory mortality and morbidity. While inflammation is essential for fighting infection, a balance of anti-viral defense and host tolerance is necessary for recovery. Circadian rhythms have been shown to modulate inflammation. However, the importance of diurnal variability in the timing of influenza infection is not well understood. Here we demonstrate that endogenous rhythms affect survival in influenza infection. Circadian control of influenza infection is mediated by enhanced inflammation as proven by increased cellularity in bronchoalveolar lavage (BAL), pulmonary transcriptomic profile and histology and is not attributable to viral burden. Better survival is associated with a time dependent preponderance of NK and NKT cells and lower proportion of inflammatory monocytes in the lung. Further, using a series of genetic mouse mutants, we elucidate cellular mechanisms underlying circadian gating of influenza infection.


Conflict of interest statement

The authors declare no competing interests.

Figures

Fig. 1
Fig. 1
Time of infection affects survival in influenza A virus (IAV) disease. Experimental design: two groups of mice were maintained in 12 h light: dark cycles. Mice were infected with 40 PFU of IAV (PR8; H1N1) intransally (i.n.) at either the start of the light cycle (ZT23; ZT0 being the time at which light go on in a 12 h LD cycle) or at the start of the dark cycle (ZT11). Mice infected at ZT11 were always weighed and scored at ZT11 at serial time points following infection and likewise for ZT23 group. This ensured that the time from infection to evaluation was identical for both groups. a Survival curves are a composite of three independent experiments [total n = 8/control group; n = 20–24/IAV group, log-rank (Mantel–Cox) test, p < 0.0001]. b Disease progression is expressed as the percent of weight change following IAV infection. c Disease progression was also measured as clinical scores. The data represented as median ± SEM (total n = 17 per group; Student’s t test, *p < 0.05, **p < 0.01, ***p < 0.001). d Two groups of mice were maintained in constant darkness for 72 h, and were infected i.n. with 40 PFU of IAV (PR8) either at the times corresponding to start of the light cycle (CT23) or the start of dark cycle (CT11). Survival curves composite of two independent experiments [total n = 8–12 per group, log-rank (Mantel–Cox) test, *p < 0.05]. e, f Experimental design: Bmal1fl/fl ERcre+ mice and their cre littermates were treated with tamoxifen at 6–8 weeks of age, and acclimatized to reverse cycles of 12 h LD for 2 weeks. Thereafter, they were maintained in constant darkness for 2–4 days prior to administering IAV (PR8) at CT23 and CT11. e Survival (f) weight change trajectory [n = 12–13 in cre+ group and n = 41, 47 in cre group from three independent experiments]. Compiled data are expressed as mean ± SEM in panel b and f. Source data are provided as a Source Data file
Fig. 2
Fig. 2
The time of infection affect late-viral clearance, not early replication. Experimental design: after infecting mice at ZT23 or ZT11, viral titers were determined in the lungs harvested at serial time points, post infection. The time from infection to tissue collection was the identical for both groups. a Combined data for viral titers from 6 h to 10 day post infection (n = 5–12 mice per group, student's t test; *p < 0.05, ZT23 vs. ZT11; The data were pooled across 3–4 independent experiments). b Viral titers from ZT23 and ZT11 groups were determined at 48, 52, 60, and 64 h. c Bronchoalveolar lavage (BAL) was also collected at the same time points as in panel b, quantified and the differential was determined by staining cytospin preparations. Data were compiled from 4 independent experiments for both panels b and c, including one from reverse LD cycles (total n = 6–8 per time point, two-way ANOVA; *p < 0.05 for time of infection, NS for time of dissection). d Right panel: the total BAL cell count on day 6 p.i. from mice who received either IAV or PBS at ZT23 or ZT11. The data compiled from three independent experiments (total n = 11–13 per time point, one-way ANOVA; *p < 0.05, ZT23 vs. ZT11). Left panel: differential of the BAL cells from both IAV-infected groups. e Viral titers from Bmal1fl/flERcre+ mice and their cre littermates (treated as in Fig. 1e), and samples harvested on day 1, 2, 4, and 6 dpi. (total n = 4–9 per time point, two-way ANOVA; p < 0.05 for days after infection and N.S. time of infection i.e., CT11 vs. CT23. The data were pooled across four independent experiments). The data expressed as mean ± SEM. Source data are provided as a Source Data file
Fig. 3
Fig. 3
Temporal gating of IAV is associated with lung inflammation. a Top panel: representative micrographs of H&E stained lung sections 2 days after sham (PBS) or IAV (40 PFU) treatment (photomicrograph bar = 200 µm). Lower panel: severity of lung injury quantified using an objective histopathological scoring system by a researcher blinded to study group (n = 5–6/group; Wilcoxon rank-sum test; *p < 0.05, ZT23 vs. ZT11). b Top panel: representative micrographs of H&E-stained lung sections 6 days after sham (PBS) or IAV (40 PFU) treatment (photomicrograph bar = 200 µm). Lower panel: severity of lung injury quantified as above (n = 7–9 mice/group; Wilcoxon rank-sum test; **p < 0.01, ZT23 vs. ZT11). c Top panel: representative micrographs of H&E-stained lung sections 6 days after IAV (40 PFU) treatment of Bmal1fl/flERcre+ mice and their cre littermates (photomicrograph bar = 200 µm). Lower panel: severity of lung injury quantified as above (n = 4–8 mice/group; data as median, IQR; Wilcoxon rank-sum test; **p < 0.01, CT23 vs. CT11 for Cre+ versus Cre animals; pooled data from two independent experiments). The data expressed as median, IQR in panels ac. d Cytokine levels in BAL on day 6 post infection (n = 6/group. Student's t test; *p < 0.01 with post hoc correction for multiple comparisons; pooled data from three experiments). Source data are provided as a Source Data file
Fig. 4
Fig. 4
Transcriptomic analyses confirm disparate phenotype of the ZT23 and ZT11 groups. RNA samples from animals infected at ZT23 or ZT11, with either PBS or IAV, 6 days after infection were collected at ZT23 and ZT11 and used for RNA-Seq. a Venn diagram (sizes not to scale) depicting the number of differentially expressed genes. b Heatmap of the top 900 differentially expressed genes (color scheme reflects logarithmic gene expression of each group; highest in red and lowest in blue). c Plot of log-adjusted fold change for ZT11 and ZT23 showing directionality of the most differentially expressed genes. Flow cytometry-based enumeration of the different innate immune cell populations in dissociated lungs following IAV infection at either ZT23 or ZT11. d Ingenuity pathway analyses reveals the top ten (adjusted P < 0.05) phenotypes related to these genes. Overlap, the number of appearing genes/number of background genes. Source data are provided as a Source Data file
Fig. 5
Fig. 5
Ly6Chi monocytes, NKT, and NK cells in temporal gating of IAV infection. The left lung lobe was digested, dissociated, and analyzed by flow cytometry. a CD45+ cells (as a % of live) and CD45+ cell numbers. Two-way ANOVA, p < 0.01 for time of infection <0.05 for day of dissection and p < 0.05 for interaction. For p < 0.05 for time of dissection, time of infection and interaction. b Macrophages, two subsets of dendritic cells (CD11b + and CD103+) using gating strategies from Supplementary Fig. 10a. c Ly6Chi inflammatory monocytes with images from representative experiment. For monocytes, two-way ANOVA, p < 0.0001 for time of infection, p < 0.001 for day of dissection and N.S. for interaction. d Neutrophils (top panel) and absolute NK1.1+ cells (middle panel), and % of NK1.1+ cells (bottom panel). Two-way ANOVA. For % NK1.1+ cells, p < 0.05 for time of infection, <0.05 for day of dissection, and p < 0.05 for interaction. For neutrophils % and NK cell numbers, no comparisons were significant. For ad, representative results from one experiment are shown. Experiments were repeated with similar results three times. e NK cells and Ly6Chi cells (as % of total CD45 cells) from Bmal1fl/flERcre+ mice and their cre littermates. For NK cells two-way ANOVA, p = ns for time of infection, and p < 0.05 for day of time of dissection in Cre animals, but no difference in Cre+ groups and p < 0.05 for interaction. The experiment was done once. ce Using gating strategies from Supplementary Fig. 10b. The data expressed as mean ± SEM. Source data are provided as a Source Data file
Fig. 6
Fig. 6
Immune and lung clocks contribute to circadian gating of IAV infection. Experimental design: C57bl6 mice were maintained in reverse cycles of 12 h LD for 2 weeks. Thereafter, Nk1.1 antibody administered to deplete Nk1.1+ cells, and one day later the animals were infected with IAV (PR8) at ZT23 and ZT11. a Survival. b Weight change trajectory (N = 20–32/group form three independent experiments). Experimental design: Bmal1fl/flLysMcre+ mice (mice lacking Bmal1 in the myeloid cells) and their Bmal1+/+cre+/+ littermates were acclimatized to reverse cycles of 12 h LD for 2 weeks. Thereafter, they were maintained in constant darkness for 1 week prior to administering IAV (PR8) at CT23 and CT11. c Survival. d Weight change trajectory (n = 11–15/group from three independent experiments). Experimental design: Bmal1fl/flCCSPcre+ mice (mice lacking Bmal1 in club cells of the lung epithelium) and their cre littermates were acclimatized to reverse cycles of 12 h LD for 2 weeks. Thereafter, they were maintained in constant darkness for 1 week prior to administering IAV (PR8) at CT23 and CT11. e Survival (f) weight change trajectory (n = 9 in cre+ groups and n = 9–16 in the cre group in two independent experiments). Survival curves composite of 2–4 independent experiments (log-rank (Mantel–Cox) test, *p < 0.05). The data expressed as mean ± SEM in panels b, d, f. Source data are provided as a Source Data file

References

    1. Partch CL, Green CB, Takahashi JS. Molecular architecture of the mammalian circadian clock. Trends Cell Biol. 2014;24:90–99. doi: 10.1016/j.tcb.2013.07.002. - DOI - PMC - PubMed
    1. Man K, Loudon A, Chawla A. Immunity around the clock. Science. 2016;354:999–1003. doi: 10.1126/science.aah4966. - DOI - PMC - PubMed
    1. Nguyen KD, et al. Circadian gene Bmal1 regulates diurnal oscillations of Ly6C(hi) inflammatory monocytes. Science. 2013;341:1483–1488. doi: 10.1126/science.1240636. - DOI - PMC - PubMed
    1. Cermakian N, et al. Crosstalk between the circadian clock circuitry and the immune system. Chronobiol. Int. 2013;30:870–888. doi: 10.3109/07420528.2013.782315. - DOI - PMC - PubMed
    1. Curtis AM, Bellet MM, Sassone-Corsi P, O’Neill LA. Circadian clock proteins and immunity. Immunity. 2014;40:178–186. doi: 10.1016/j.immuni.2014.02.002. - DOI - PubMed

Publication types

MeSH terms