. 2019 Sep;573(7774):434-438.
doi: 10.1038/s41586-019-1553-0. Epub 2019 Sep 11.

SLC19A1 transports immunoreactive cyclic dinucleotides

Affiliations

SLC19A1 transports immunoreactive cyclic dinucleotides

Rutger D Luteijn et al. Nature. 2019 Sep.

Erratum in

Abstract

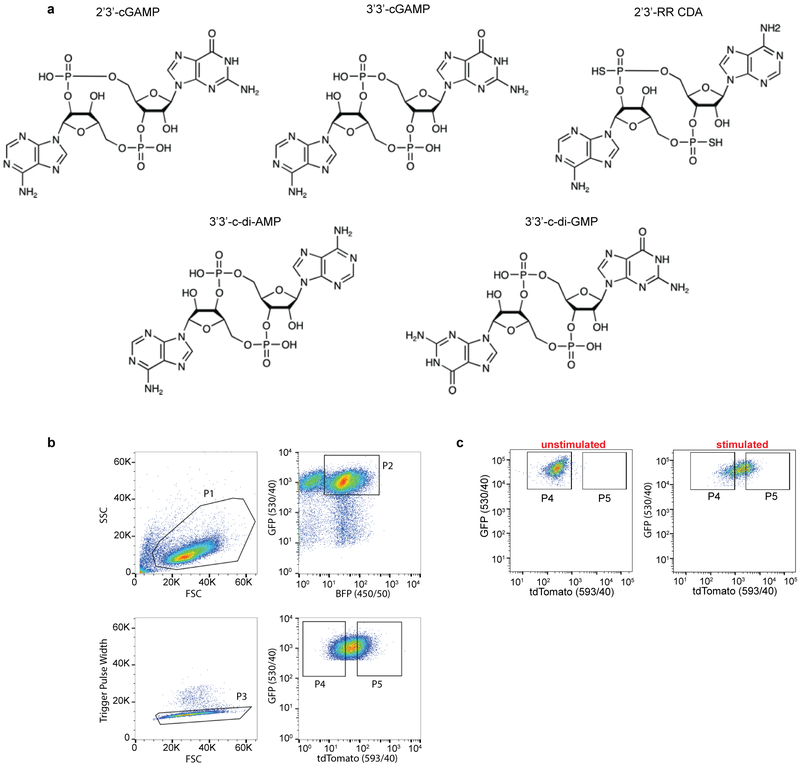
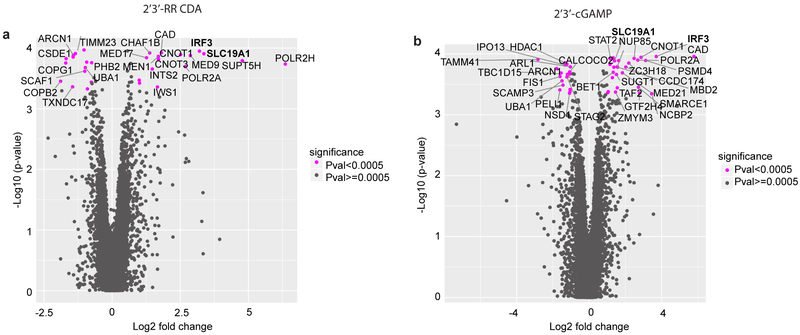
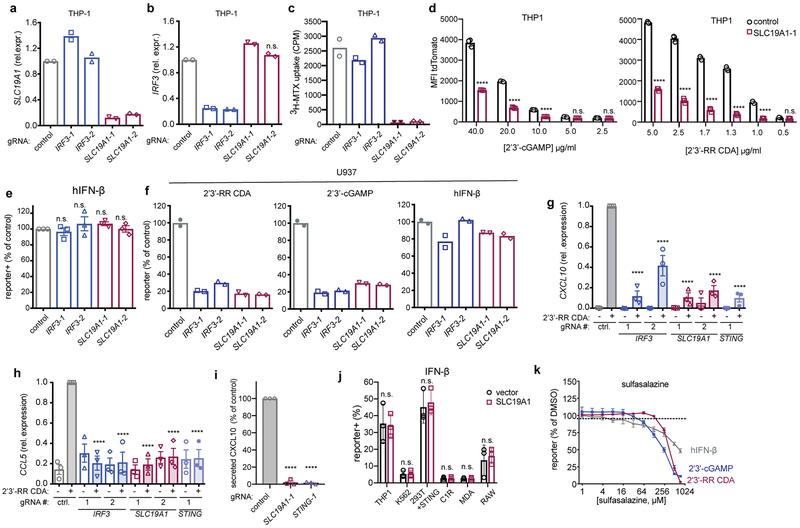
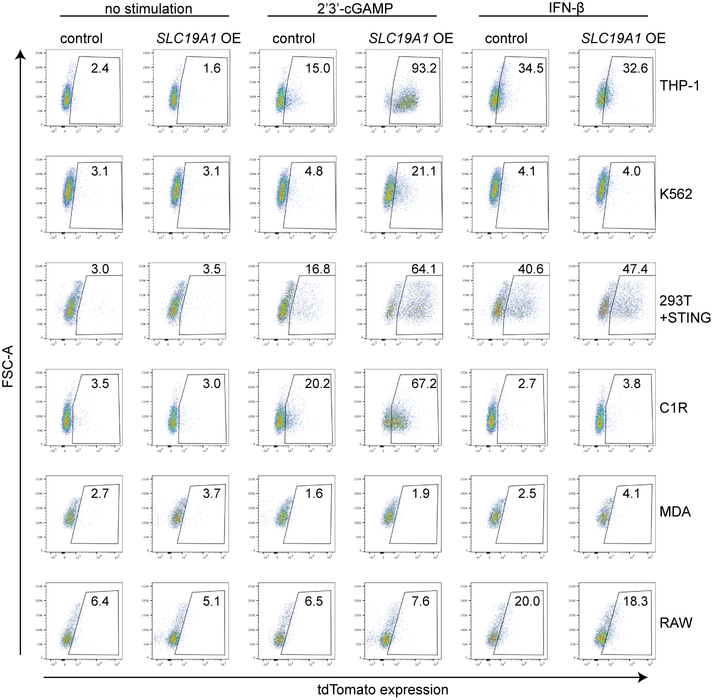
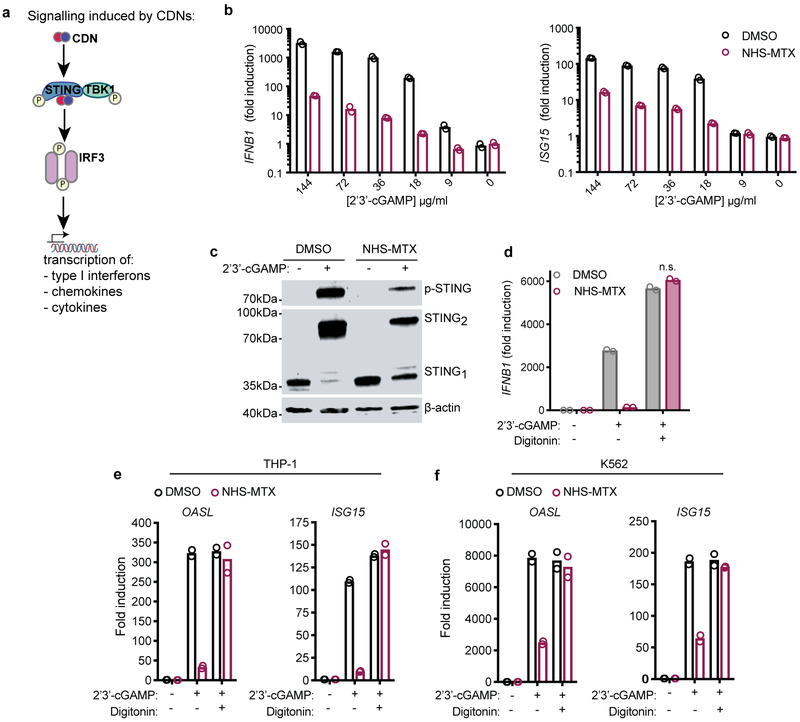
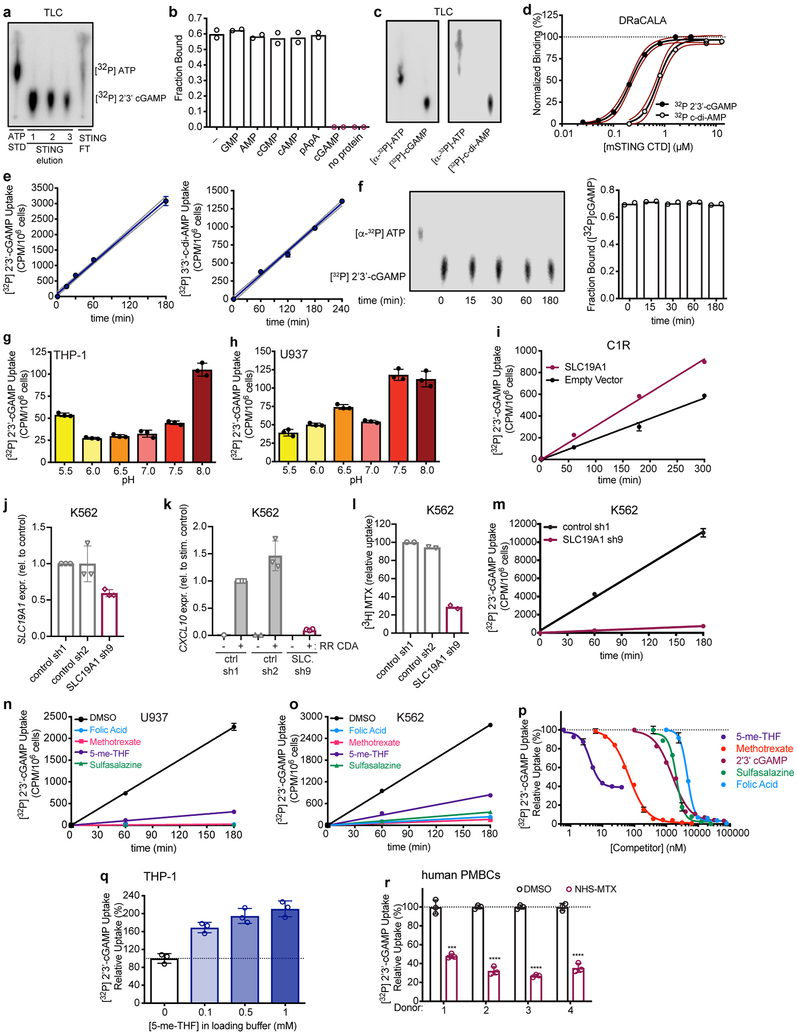
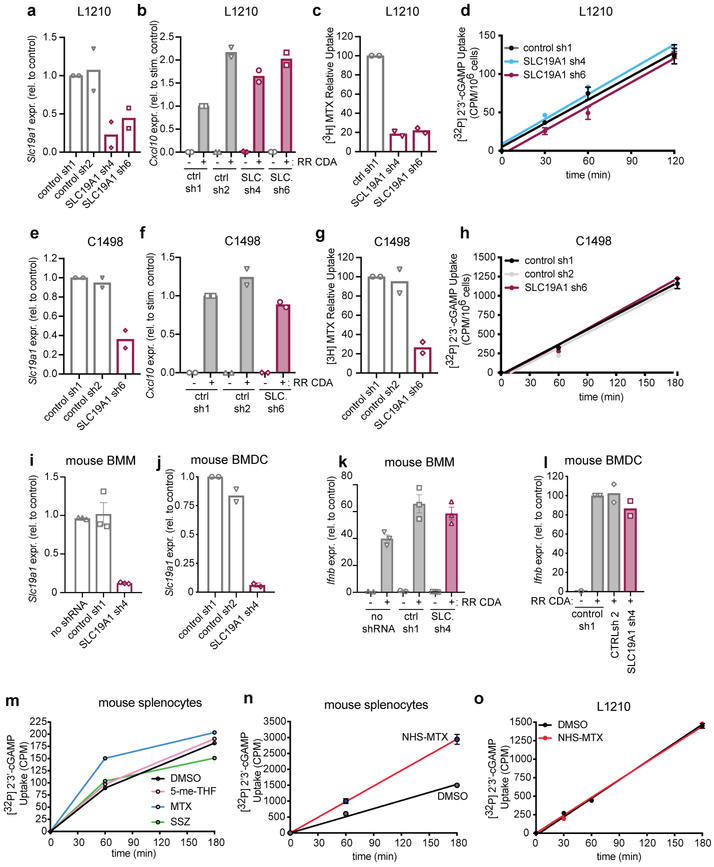
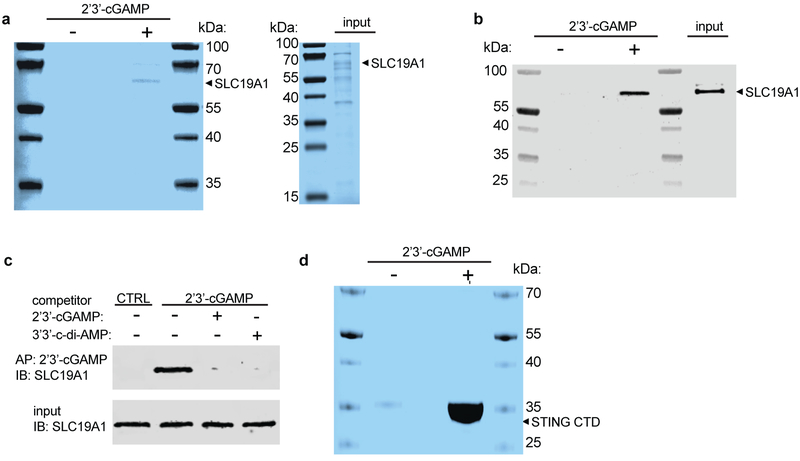
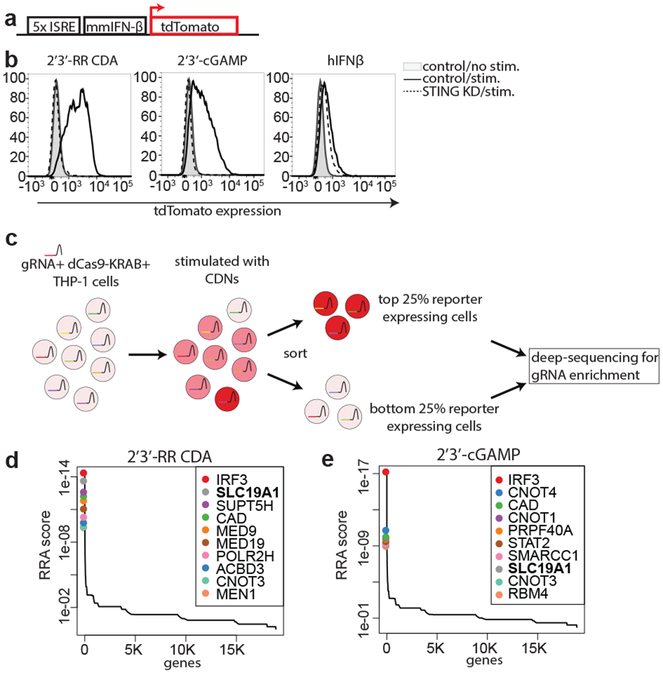
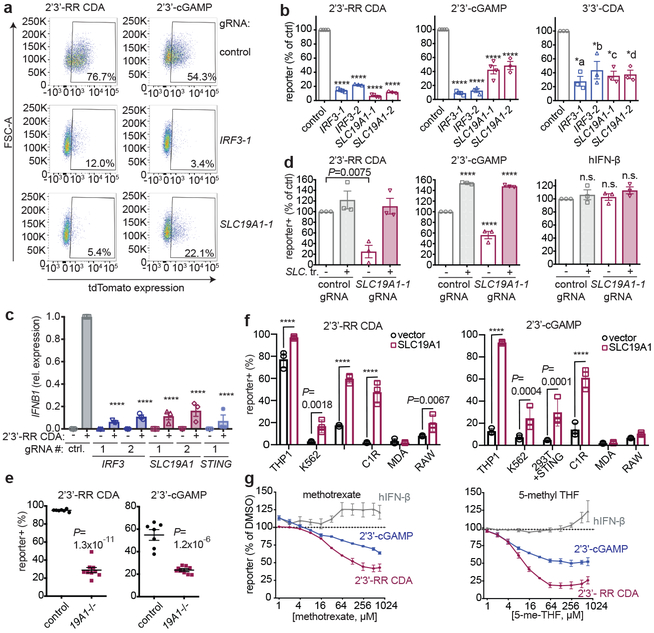
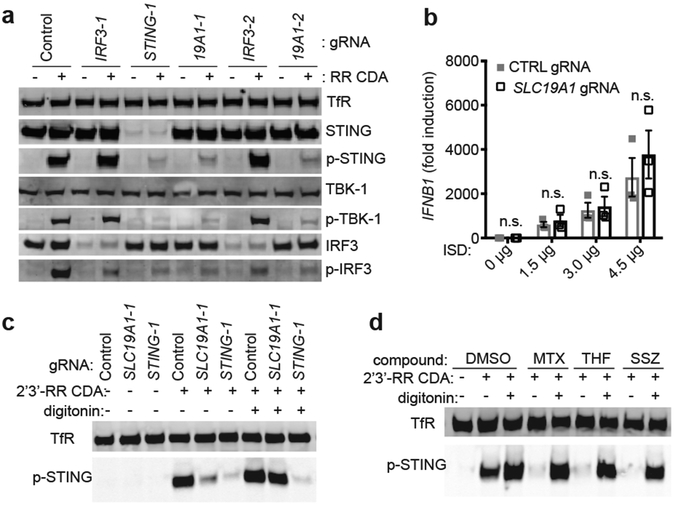
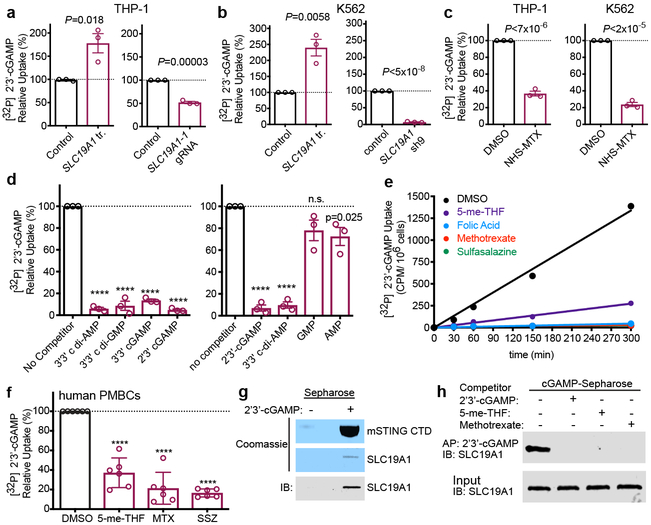
The accumulation of DNA in the cytosol serves as a key immunostimulatory signal associated with infections, cancer and genomic damage1,2. Cytosolic DNA triggers immune responses by activating the cyclic GMP-AMP synthase (cGAS)-stimulator of interferon genes (STING) pathway3. The binding of DNA to cGAS activates its enzymatic activity, leading to the synthesis of a second messenger, cyclic guanosine monophosphate-adenosine monophosphate (2'3'-cGAMP)4-7. This cyclic dinucleotide (CDN) activates STING8, which in turn activates the transcription factors interferon regulatory factor 3 (IRF3) and nuclear factor κ-light-chain-enhancer of activated B cells (NF-κB), promoting the transcription of genes encoding type I interferons and other cytokines and mediators that stimulate a broader immune response. Exogenous 2'3'-cGAMP produced by malignant cells9 and other CDNs, including those produced by bacteria10-12 and synthetic CDNs used in cancer immunotherapy13,14, must traverse the cell membrane to activate STING in target cells. How these charged CDNs pass through the lipid bilayer is unknown. Here we used a genome-wide CRISPR-interference screen to identify the reduced folate carrier SLC19A1, a folate-organic phosphate antiporter, as the major transporter of CDNs. Depleting SLC19A1 in human cells inhibits CDN uptake and functional responses, and overexpressing SLC19A1 increases both uptake and functional responses. In human cell lines and primary cells ex vivo, CDN uptake is inhibited by folates as well as two medications approved for treatment of inflammatory diseases, sulfasalazine and the antifolate methotrexate. The identification of SLC19A1 as the major transporter of CDNs into cells has implications for the immunotherapeutic treatment of cancer13, host responsiveness to CDN-producing pathogenic microorganisms11 and-potentially-for some inflammatory diseases.


Figures

Extended Data Figure 1.
Extended Data Figure 1.. Structures of cyclic dinucleotides (CDN) used in this study and gating strategy for the genome-wide CRISPRi screens.
a, Structures of the CDNs used in this study. b, Representative gating strategy for flow cytometry-based sorting of the CRISPRi library of reporter-expressing THP-1 cells stimulated with CDNs. Cells were gated based on their forward scatter (FSC) and side scatter (SSC) using gate P1. The P1 cells were subsequently selected for co-expression of blue fluorescent protein (BFP, fluorescent marker for the CRISPRi gRNAs) and GFP (marker for the expression of the reporter construct) (gate P2). Gate P3 excluded cell doublets present among P2 cells. Gate P4 selected for the lowest 25% of cells with respect to tdTomato expression and gate P5 selected for the highest 25%. c, Representative flow cytometry dot plots showing tdTomato expression in unstimulated cells or in cells stimulated for 20h with cells for 20h with CDN (2’3’-RR CDA). Data is representative of n=3 biological replicates.
Extended Data Figure 2.
Extended Data Figure 2.. Results of genome-wide CRISPRi screens for host factors crucial for CDN stimulation.
Volcano plots of the gRNA-targeted genes enriched or depleted in the tdTomato reporter-low versus reporter-high groups after stimulation with 2’3’-RR CDA (a), or 2’3’-cGAMP (b). FC: fold change. Each panel represent the combined results of two independent screens. Calculations of phenotypes and Mann-Whitney p-values were performed as described in the Methods section.
Extended Data Figure 3.
Extended Data Figure 3.. SLC19A1 is critical for CDN-induced gene expression.
a,b, mRNA expression levels of (a) SLC19A1 or (b) IRF3 in THP-1 cells expressing a CRISPRi vector and a control non-targeting gRNA or gRNAs targeting IRF3 or SLC19A1 (two gRNAs each). c, THP-1 cells described in panels a and b were exposed to [3H]-methotrexate (MTX). After 1h, radioactivity (counts per minute, CPM) in lysates of cell pellets was measured. CPMs were normalized to protein concentrations in the lysate. d, THP-1 cells expressing a control gRNA or SLC19A1 targeting gRNA were exposed to indicated concentrations of 2’3’-RR CDA or 2’3’-cGAMP. After 20h, the mean fluorescence intensity (MFI) of tdTomato was quantified by flow cytometry. e, THP-1 cells expressing the indicated CRISPRi gRNAs or non-targeting gRNA (control), were stimulated with hIFN-β (100 ng/ml). After 18-22h, tdTomato expression was quantified as in Fig. 2a. f, U937 cells expressing the indicated CRISPRi gRNAs or non-targeting gRNA (control), were stimulated with 2’3’-RR CDA (1.67 μg/ml), 2’3’-cGAMP (15 μg/ml), or hIFN-β (100 ng/ml). After 18–22h, tdTomato expression was quantified as in Fig. 2a. g, h, Induction of CXCL10 mRNA (g) or CCL5 mRNA (h) in control (non-targeting gRNA) THP-1 cells or THP-1 cells expressing the indicated CRISPRi gRNAs after 5h stimulation with 5 μg/ml 2’3’-RR CDA. i, CXCL10 protein expression in the supernatant of indicated gRNA-expressing THP-1 cells after exposure to 2 μg/ml 2’3’-RR CDA for 20h. j, Various cell lines expressing a control vector or an SLC19A1 expression vector were stimulated with hIFN-β (100 ng/ml). After 18-22h, tdTomato expression was quantified as in Fig. 2a. k, THP-1 cells were incubated with increasing concentrations of the non-competitive inhibitor sulfasalazine or DMSO as vehicle control, before stimulating with 2’3’-RR CDA (1.25 μg/ml), 2’3’-cGAMP (15 μg/ml) or hIFN-β (100 ng/ml). After 18-22h, tdTomato expression was quantified as in Fig. 2a. The data were normalized to the DMSO controls. In panels a-c and e-f, means of n=2 biological replicates are shown. In panel d and g-k, means ± SEM of n=3 biological replicates are shown. Statistical analyses were performed to compare each cell line to the control using a one-way ANOVA followed by Dunnetts’s post-test (panels d, and g-i), or a two-way ANOVA followed by uncorrected Fisher’s LSD tests (j). ****P ≤ 0.0001; n.s. not significant.
Extended Data Figure 4.
Extended Data Figure 4.. SLC19A1 overexpression increases the response to CDNs in various cell lines.
Various cell lines expressing a control vector or an SLC19A1 expression vector (SLC19A1 OE) stimulated with 2’3’-cGAMP (10 μg/ml) (e) or hIFN-β (100 ng/ml) (or 100 ng/ml murine IFN-β in the case of RAW cells). After 20h, reporter expression was quantified by flow cytometry. Representative flow plots of n=3 biological replicates shown in Fig. 2f and Extended Data Fig. 3j.
Extended Data Figure 5.
Extended Data Figure 5.. Covalent inhibition of SLC19A1 by NHS-methotrexate blocks STING activation.
a, Schematic overview of CDN-induced phosphorylation (P) of STING and downstream effectors TBK1 and IRF3. b, THP-1 monocytes pre-treated with DMSO or NHS-methotrexate (MTX) (5 μM) were treated with varying concentrations of 2’3’-cGAMP for 4h, and the amounts of IFNB1 or ISG15 transcripts were measured by RT-qPCR. c, Semi-native PAGE immunoblot analysis of STING dimerization and phosphorylation in DMSO and NHS-MTX (5 μM) pre-treated THP-1 monocytes stimulated with 100 μM 2’3’-cGAMP for 4h. For gel source data, see Supplementary Figure 1. d, DMSO and NHS-MTX (5 μM) treated THP-1 monocytes were treated with 100 μM 2’3’-cGAMP in the presence and absence of digitonin (5 μg/mL) for 4h, and the induction of IFNB1 mRNA was measured by RT-qPCR. e, f, DMSO () and NHS-MTX () (5 μM) pre-treated THP-1 monocytes (e) or K562 cells (f) were stimulated for 4h with 100 μM 2’3’-cGAMP, or not, in the presence or absence of digitonin (5 μg/mL), and the induction of OASL and ISG15 mRNA was measured by RT-qPCR. In panels b, d and e, data are means of n=2 technical replicates and data are representative of three independent experiments with similar results. In panel c, data are representative of three independent experiments with similar results.
Extended Data Figure 6.
Extended Data Figure 6.. SLC19A1 is critical for CDN uptake in human cell lines and primary cells.
a, Thin layer chromatography (TLC) analysis of [32P] ATP standard (STD) and enzymatically synthesized [32P] 2’3’-cGAMP. 2’3’-cGAMP was purified on STING resin. Unbound nucleotides flowed through the resin (STING FT). Following four washes, the bound [32P] 2’3’-cGAMP was eluted over three fractions. b, DRaCALA binding analysis of [32P] 2’3’-cGAMP to STING C-terminal domain (CTD) in the presence of competing unlabeled nucleotides (200 μM). c, Thin layer chromatography (TLC) analysis of [32P]-ATP and enzymatically synthesized [32P]-2’3’-cGAMP and [32P]-c-di-AMP. d, Binding titration of [32P] 2’3’-cGAMP or [32P] c-di-AMP to mSTING C-Terminal Domain (CTD), determined with DRaCALA assays. Red dashed lines represent the 95% confidence interval for the non-linear regression. e, Time course of [32P] 2’3’-cGAMP (left panel) or [32P] 3’3’-CDA (right panel) uptake in THP-1 monocytes. f, TLC analysis (left panel) and STING-binding (DRaCALA) (right panel) of [32P] ATP standard, or [32P] 2’3’-cGAMP recovered from supernatants of THP-1 monocytes at the indicated time points. g, h, Effect of cell culture medium pH on [32P] 2’3’-cGAMP uptake in THP-1 (g) monocytes or U937 monocytes (h). i, Time course of [32P] 2’3’-cGAMP uptake by CIR cells transduced (tr.) with empty vector or SLC19A1 expression vector. j, mRNA expression levels of SLC19A1 (SLC.) in K562 cells expressing control shRNAs (sh1 and sh2) or an SLC19A1-targeting shRNA (sh9). k, mRNA expression levels of CXCL10 in K562 cells described in panel j, stimulated with 5 μg/ml 2’3’-RR CDA (CDN) for 5h. l, [3H]-Methotrexate uptake in K562 cells described in panel j, 1h after exposure to [3H]-Methotrexate. m, Time course of [32P] 2’3’-cGAMP uptake in K562 cells described in panel j. n, Time course of [32P] 2’3’-cGAMP uptake in U937 monocytes in the presence or absence of 500 μM competing, unlabeled (anti-) folates and sulfasalazine. o. Time course of [32P] 2’3’-cGAMP uptake in K562 cells in the presence or absence of 500 μM competing, unlabeled (anti-) folates or sulfasalazine. p, Competition uptake assay of [32P] 2’3’-cGAMP uptake in THP-1 cells in the presence of varying concentrations of competing, unlabeled 5-me-THF (IC50 = 4.10 ± 0.16 nM), methotrexate (IC50 = 54.83 ± 5.08 nM), 2’3’-cGAMP (IC50 = 1.89 ± 0.11 μM), sulfasalazine ((IC50 = 2.06 ± 0.17 μM), and folic acid (IC50 = 4.79 ± 0.08 μM). q, Trans-stimulation of [32P] 2’3’-cGAMP influx in THP-1 cells by 5-me-THF. Cells were preloaded with indicated concentrations of 5-me-THF for 30 min. Cells were washed and incubated with [32P] 2’3’-cGAMP for one hour. r, Normalized [32P] 2’3’-cGAMP uptake after one hour in DMSO or NHS-methotrexate (MTX) (5 μM) treated human PBMCs from four healthy donors. In panel a and c, data are representative of three independent experiments with similar results. In panel b, data are means of n=2 technical replicates and are representative of three independent experiments. In panel d and f, data are means of n=2 technical replicates and are representative of two independent experiments. In panel e and m, data are means ± SD of n=3 technical replicates and are representative of three independent experiments. In panel g, h, i, and n-r, data are means ± n=3 technical replicates and are representative of two independent experiments. In panel j and k, data are means ± SEM of n=3 biologically independent experiments. In panel l, data are means of n=2 biologically independent experiments.
Extended Data Figure 7.
Extended Data Figure 7.. SLC19A1 expression or inhibition has no effect on CDN uptake and signaling in mouse cells.
a, mRNA expression levels of Slc19a1 in mouse L1210 cells expressing control shRNAs (sh1 and sh2) or Slc19a1-targeting shRNA (sh4 and sh6). b, mRNA expression levels of Cxcl10 in L1210 cells described in panel a stimulated with 5 μg/ml 2’3’-RR CDA (CDN) for 5h. c, [3H]-Methotrexate uptake in L1210 cells described in panel a 1h after exposure to [3H]-Methotrexate. d, Time course of [32P] 2’3’-cGAMP uptake in L1210 cells described in panel a. e, mRNA expression levels of Slc19a1 in mouse C1498 cells expressing control shRNAs (sh1 and sh2) or Slc19a1-targeting shRNA (sh6). f, mRNA expression levels of Cxcl10 in the C1498 cells described in panel e, stimulated with 5 μg/ml 2’3’-RR CDA (CDN) for 5h. g, [3H]-Methotrexate uptake in C1498 cells described in panel e 1h after exposure to [3H]-Methotrexate. h, Time course of [32P] 2’3’-cGAMP uptake in C1498 cells transduced with a non-targeting control shRNA (control) or Slc19a1 shRNA. i, j, mRNA expression levels of Slc19a1 in mouse bone marrow-derived macrophages (BMM) (i) or mouse bone marrow-derived dendritic cells (BMDCs) (j) transduced or not with control shRNAs (sh1 and 2) or an shRNA targeting Slc19a1. k, l, mRNA expression of the Cxcl10 in cells described in panels i and j stimulated with 5 μg/ml 2’3’-RR CDA (CDN) for 5h. m, Time course of [32P] 2’3’-cGAMP uptake in primary murine splenocytes in the presence and absence of 500 μM competing, unlabeled (anti-) folates and sulfasalazine. n, Time course of [32P] 2’3’-cGAMP uptake in primary murine splenocytes pretreated or not with NHS-methotrexate (MTX) (5 μM). o, Time course of [32P] 2’3’-cGAMP uptake in L1210 cells pretreated or not with NHS-MTX (5 μM). In panels a-c, e-g, j and l, data are means of n=2 biologically independent experiments. In panel d, h, i, k, n and o, data are means ± SD of n=3 technical replicates and are representative of two independent experiments. In panel m, data are means of n=2 technical replicates and are representative of two independent experiments. In time course experiments (d, h, m, n, o), data are presented as counts per minute (cpm) normalized to cell count.
Extended Data Figure 8.
Extended Data Figure 8.. 2’3’-cGAMP binds to SLC19A1.
a, Sodium dodecyl sulfate (SDS)-PAGE analysis followed by Coomassie blue staining of His-tagged human SLC19A1 (Ni-NTA affinity-purified) pull-downs with Sepharose beads coupled with 2’3’-cGAMP (+) or control Sepharose beads (−). Input is shown in the right panel. b, Western blots of the samples in a with anti-SLC19A1 antibody. c, Pull-downs of SLC19A1 competed with CDNs. His-tagged SLC19A1 was incubated with no CDN or with the indicated competing CDNs (250 μM) before pulldowns with 2’3’-cGAMP-Sepharose, followed by SDS-PAGE and Western blotting with an anti-SLC19A1 antibody. A pulldown with control Sepharose is shown for comparison. For gel source data, see Supplementary Figure 1. d, SDS-PAGE analysis followed by Coomassie blue staining of pull-downs of mSTING-C-Terminal Domain (CTD) with 2’3’-cGAMP (+) or control (−) Sepharose. In all panels, data are representative of two independent experiments with similar results.
Extended Data Figure 9.
Extended Data Figure 9.. RNA-Seq data of STING and SLC19A1 mRNA expression in 934 human cancer cell lines available at the Cancer Cell Line Encyclopedia website.
Expression is presented as transcripts per kilobase million (TPM). Data is downloaded from the European Bioinformatics Institute Gene expression Atlas (URL: https://www.ebi.ac.uk/gxa/home). The data set included three of the cell lines we examined, as shown.
Extended Data Figure 10.
Extended Data Figure 10.. The effect of SLC46A1 and SLC46A3 expression on CDN-induced reporter activation.
a-b, Enforced expression of SLC46A1 and SLC46A3 affects the responses of THP-1 cells to CDNs. Control THP-1 cells (transduced with empty expression vector) or SLC46A1-transduced THP-1 cells (a), or control THP-1 cells or SLC46A3-transduced cells (b) were stimulated with 2’3’-RR CDA (1.25 μg/ml), 2’3’-cGAMP (15 μg/ml) or hIFN-β (100 ng/ml). tdTomato reporter expression was measured by flow cytometry 18-22h after stimulation. c-d, SLC46A1 or SLC46A3 depletions had little or no effects on cellular responses to CDNs, and combining SLC46A1 or SLC46A3 depletions with SLC19A1 depletion, had no additional effect compared to SLC19A1-depletion by itself. THP-1 cells were transduced with non-targeting control CRISPRi gRNAs or SLC19A1-targeting CRISPRi gRNA in combination with a second control CRISPRi gRNA or SLC46A1-targeting CRISPRi gRNA in (c) or SLC46A3-targeting gRNA in (d). Cells were stimulated with 2’3’-RR CDA (1.67 μg/ml), 2’3’-cGAMP (10 μg/ml), or hIFN-β (100 ng/ml). tdTomato reporter expression was measured by flow cytometry 18-22h after stimulation. Combined data of three independent experiments. Statistical analysis was performed using unpaired two-tailed Student’s t tests (a-b), or one-way ANOVA followed by Tukey’s post-tests when comparing only the effects of depleting SLC46A1 (c) or SLC46A3 (d). Data are means ± SEM of n=3 independent replicates.
Figure 1.
Figure 1.
Genome-wide CRISPRi screen for host factors necessary for cyclic dinucleotide (CDN) stimulation. a, schematic overview of tdTomato-reporter. tdTomato expression is driven by interferon-stimulatory response elements (ISRE) followed by a mouse minimal interferon beta (mmIFN-β) promoter. b, Control THP-1 cells and STING-depleted THP-1 cells were incubated with 2’3’-RR CDA (1.67 μg/ml), 2’3’-cGAMP (10 μg/ml) or hIFN-β (100 ng/ml). After 20h, tdTomato reporter expression was analyzed by flow cytometry. Data are representative of three independent experiments with similar results. c, Schematic overview of the genome-wide CRISPRi screen. A genome-wide library of CRISPRi guide RNA (gRNA)-expressing THP-1 cells was stimulated with CDNs. 20h after stimulation, cells were sorted into a tdTomato-low group (lowest 25% of cells) and a tdTomato-high group (highest 25% of cells). DNA from the sorted cells was deep sequenced to reveal gRNA enrichment in the two groups. d-e, Distribution of the robust rank aggregation (RRA) score in the comparison of hits enriched in the reporter-low versus reporter-high groups of THP-1 cells stimulated with (d) 2’3’-RR CDA or (e) 2’3’-cGAMP. Each panel represents combined results of two independent screens.
Figure 2.
Figure 2.
SLC19A1 is required for CDN-induced reporter expression. a, dCas9-KRAB-expressing THP-1 cells transduced with non-targeting gRNA (control), IRF3-1 gRNA or SLC19A1-1 gRNA were exposed to 2’3’-RR CDA (1.67 μg/ml) or 2’3’-cGAMP (15 μg/ml). 20h later, tdTomato expression was analyzed by flow cytometry. Representative dot plots of three independent experiments are shown. b, THP-1 cells expressing the indicated CRISPRi gRNAs or non-targeting gRNA (control), were stimulated with 2’3’-RR CDA (1.67 μg/ml), 2’3’-cGAMP (10 μg/ml), or 3’3’-CDA (20 μg/ml). After 18-22h, tdTomato expression was quantified as in (a). c, Induction of IFNB mRNA in control (non-targeting gRNA) THP-1 cells or THP-1 cells expressing the indicated CRISPRi gRNAs after 5h stimulation with 5 μg/ml 2’3’-RR CDA. d, Control THP-1 cells and SLC19A1–1 gRNA expressing THP-1 cells transduced with SLC19A1 (SLC. tr.) were stimulated with 2’3’-RR CDA (1.67 μg/ml), 2’3’-cGAMP (15 μg/ml), or hIFN-β (100 ng/ml) and analyzed as in (a). e, Control THP-1 cells (n=7 clonal lines) and SLC19A1−/− cells (19A1−/−; n=9 clonal lines) were exposed to 2’3’-RR CDA (2.22 μg/ml), 2’3’-cGAMP (10 μg/ml), and tdTomato reporter expression was analyzed as in (a). Mean ± SEM are shown. f, Various cell lines expressing a control vector or an SLC19A1 expression vector were stimulated and analyzed as in (b). g, THP-1 cells were incubated with increasing concentrations of the competitive inhibitors methotrexate, 5-methyl tetrahydrofolate (5-me-THF) or DMSO as vehicle control, before stimulating with 2’3’-RR CDA (1.25 μg/ml), 2’3’-cGAMP (15 μg/ml) or hIFN-β (100 ng/ml). Cells were analyzed as in (a). For each stimulant, the data were normalized to the DMSO controls. In panels b-d and f-g, mean ± SEM of n=3 biological replicates are shown. Statistical analyses were performed using one-way ANOVA followed by Dunnett’s post-test for the comparison to stimulated control cells (b-d), unpaired two-tailed Student’s t tests for (e), or two-way ANOVA followed by uncorrected Fisher’s LSD tests (f). *a P = 0.0002; *b P = 0.0013; *c P = 0.0005; *d P =0.0006; ****P ≤ 0.0001; n.s. not significant.
Figure 3.
Figure 3.
SLC19A1 is critical for STING-dependent responses to exogenous CDNs but not when CDNs are provided intracellularly. a, Immunoblot analysis of (phospho-) protein expression in control THP-1 cells or THP-1 cells expressing the indicated CRISPRi gRNAs. Cells were stimulated for 2h with 10 μg/ml 2’3’-RR CDA (RR CDA) or left unstimulated. TransferrinR.: Transferrin receptor; p-TBK1: TKB1 phosphorylated at position Ser172; p-IRF3: IRF3 phosphorylated at position Ser296; p-STING: STING phosphorylated at position Ser366. b, Control THP-1 cells or SLC19A1-depleted THP-1 cells were transfected with increasing amounts of interferon-stimulatory DNA (ISD) for 3h and the induction of IFNB1 mRNA was measured by RT-qPCR. c, cells were stimulated as in (a) in the absence or presence of digitonin (5 μg/ml). d, control THP-1 cells were stimulated as in (c) with the addition of the indicated SLC19A1 inhibitors (all at 750 μM): methotrexate, 5-methyl tetrahydrofolate (5-me-THF), or sulfasalazine or DMSO as vehicle control. Panels a, c, and d are representative of n=3 biological replicates; for gel source data, see Supplementary Figure 1. In panel b, data are means ± SEM of n=3 biological replicates and statistical analyses were performed using a two-way ANOVA followed by Sidak’s post-test (n.s. not significant).
Figure 4.
Figure 4.
SLC19A1 transports CDNs. a, Normalized [32P] 2’3’-cGAMP uptake after one hour by THP-1 monocytes transduced with empty vector (control) or SLC19A1 expression vector (left panel), or transduced with a non-targeting control CRISPRi gRNA or SLC19A1 CRISPRi gRNA (right panel). b, Normalized [32P] 2’3’-cGAMP uptake after one hour by K562 cells transduced with empty vector (control) or SLC19A1 expression vector (left panel), or transduced with a non-targeting control shRNA (control) or SLC19A1 shRNA (right panel). c, Normalized [32P] 2’3’-cGAMP uptake after one hour in DMSO or NHS-methotrexate (MTX) (5 μM) treated THP-1 (left panel) and K562 (right panel) cells. d, Normalized [32P] 2’3’-cGAMP uptake after one hour by THP-1 monocytes in the presence and absence of 100 μM competing, unlabeled cyclic dinucleotides (left panel) or 200 μM competing, unlabeled nucleotides (right panel). e, Time course of [32P] 2’3’-cGAMP uptake in THP-1 monocytes in the presence and absence of 500 μM competing, unlabeled (anti-) folates and sulfasalazine. f, Normalized [32P] 2’3’-cGAMP uptake after three hours in human PBMCs from six healthy donors in the presence and absence of 500 μM competing, unlabeled (anti-) folates and sulfasalazine. g, Coomassie staining and western blot analysis of pulldowns by 2’3’-cGAMP (+) or control (−) Sepharose of mSTING-CTD or hSLC19A1. h, Western blot analysis of hSLC19A1 affinity purification (AP) with 2’3’-cGAMP Sepharose in the absence (−) or presence (+) of free, unbound 2’3’-cGAMP, 5-me-THF, or methotrexate (250 μM). In panels a-d, data are means ± SEM of n=3 biological replicates. In panel e, data are means ± SD of n=3 technical replicates and data are representative of three independent experiments. In panel f, data are means ± SD of n=6 healthy donors conducted over two independent experiments. Panels g and h are representative of two independent experiments; for gel source data, see Supplementary Figure 1. Statistical analyses were performed using unpaired, two-tailed Student’s t-tests (a-d), or a one-way ANOVA followed by a Tukey’s post-test (f). ****P ≤ 0.0001.

References

    1. Ishii KJ et al. A toll-like receptor-independent antiviral response induced by double-stranded B-form DNA. Nat. Immunol. 7, 40–48 (2006). - PubMed
    1. Stetson DB & Medzhitov R Recognition of cytosolic DNA activates an IRF3-dependent innate immune response. Immunity 24, 93–103 (2006). - PubMed
    1. Li T & Chen ZJ The cGAS–cGAMP–STING pathway connects DNA damage to inflammation, senescence, and cancer. J. Exp. Med. 215, 1287–1299 (2018). - PMC - PubMed
    1. Sun L, Wu J, Du F, Chen X & Chen ZJ Cyclic GMP-AMP synthase is a cytosolic DNA sensor that activates the type I interferon pathway. Science 339, 786–91 (2013). - PMC - PubMed
    1. Gao P et al. Cyclic [G(2′,5′)pA(3′,5′)p] is the metazoan second messenger produced by DNA-activated cyclic GMP-AMP synthase. Cell 153, 1094–1107 (2013). - PMC - PubMed

Publication types