

Mechanisms underlying TNFα-induced enhancement of force generation in airway smooth muscle
- PMID: 31512410
- PMCID: PMC6739507
- DOI: 10.14814/phy2.14220
Mechanisms underlying TNFα-induced enhancement of force generation in airway smooth muscle
Abstract
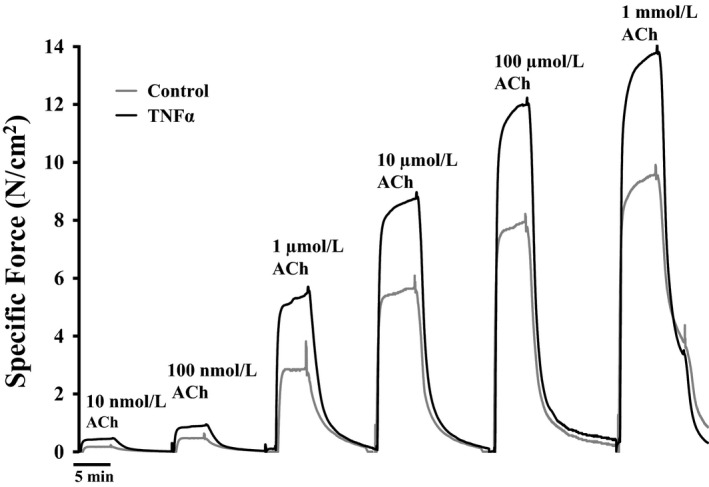
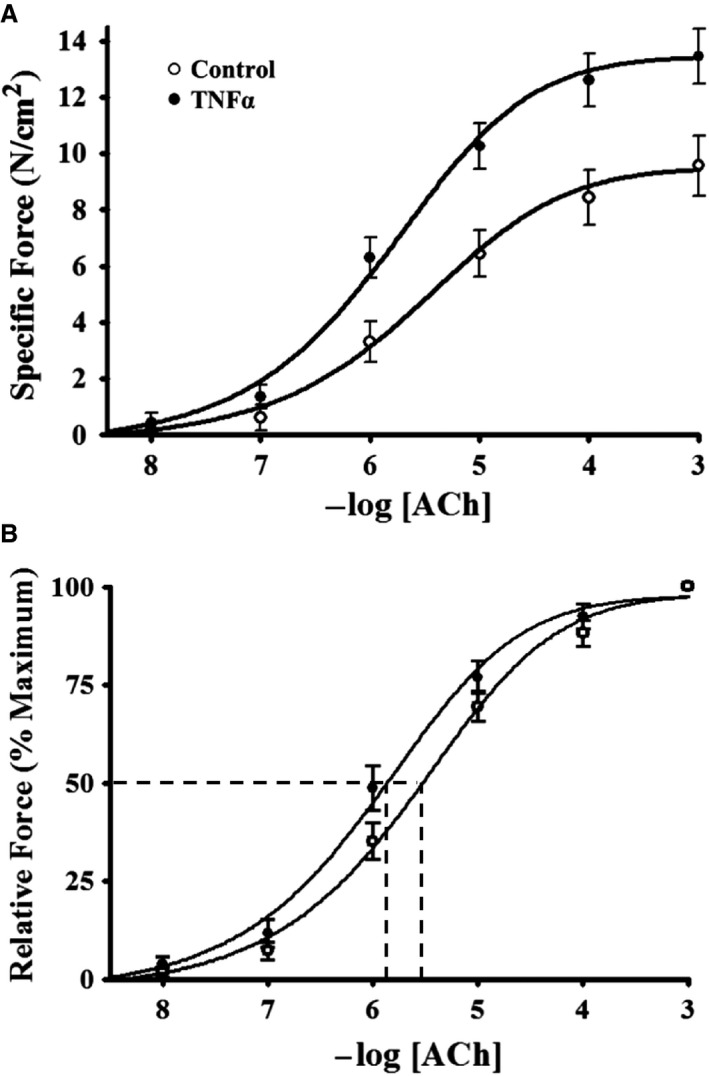
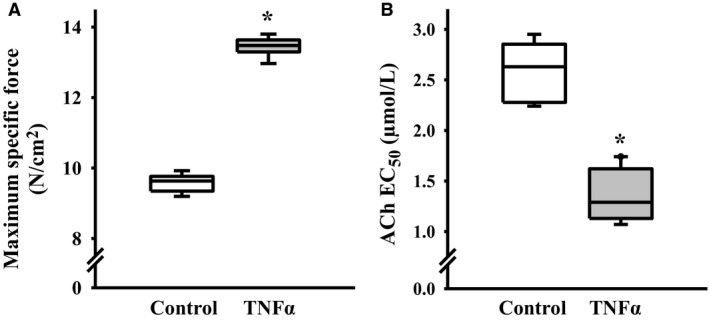
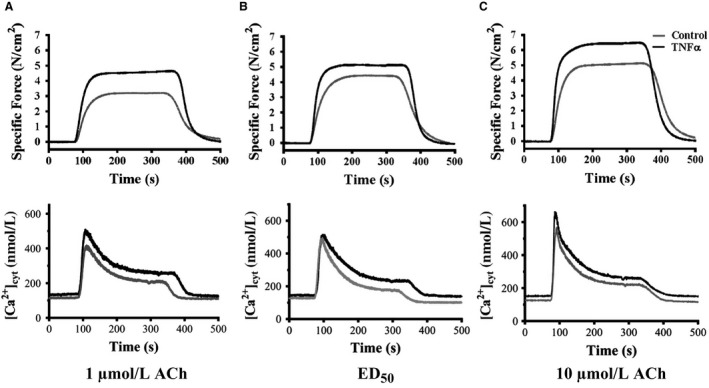
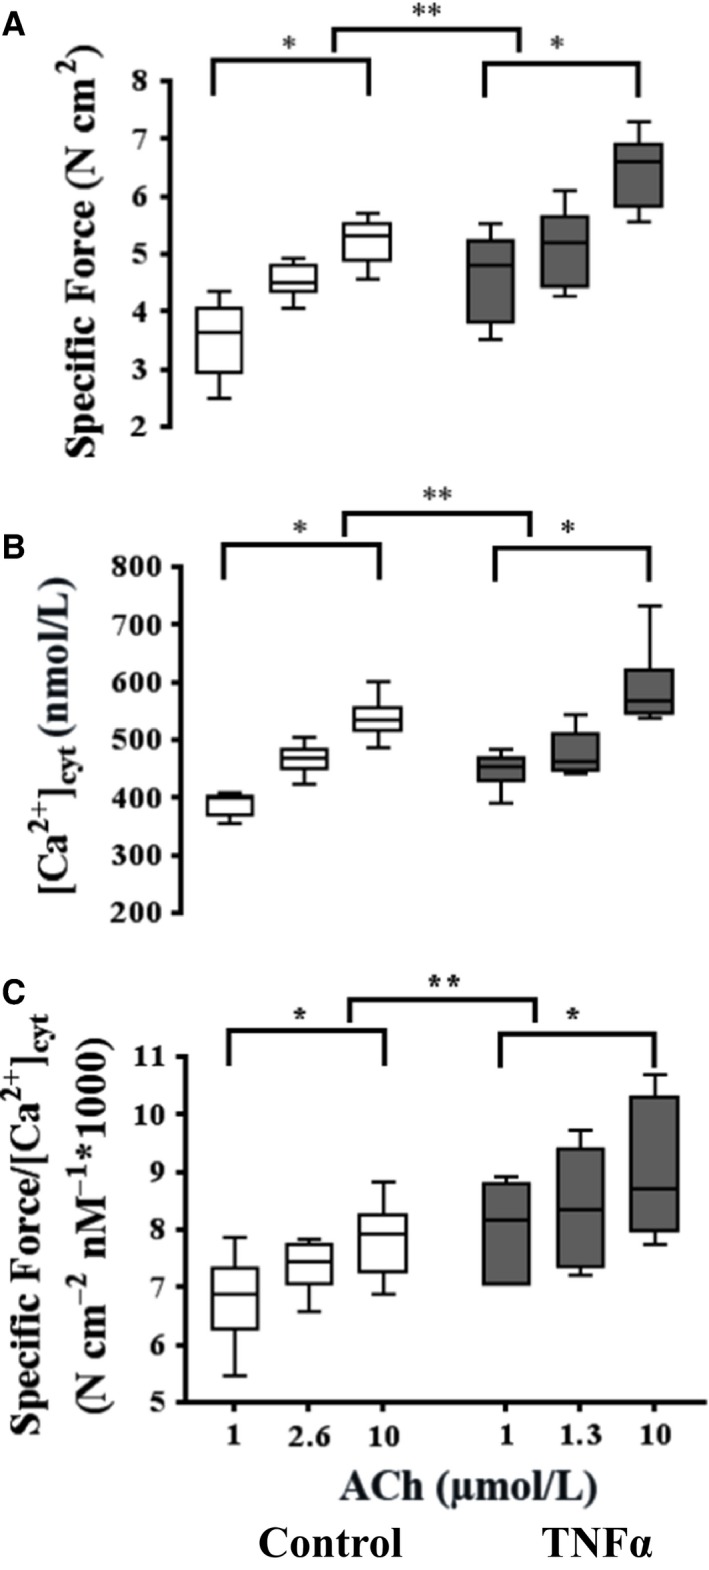
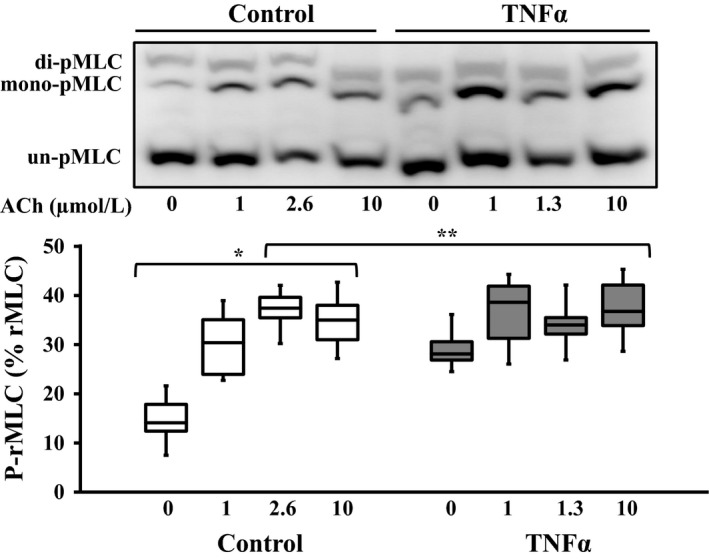
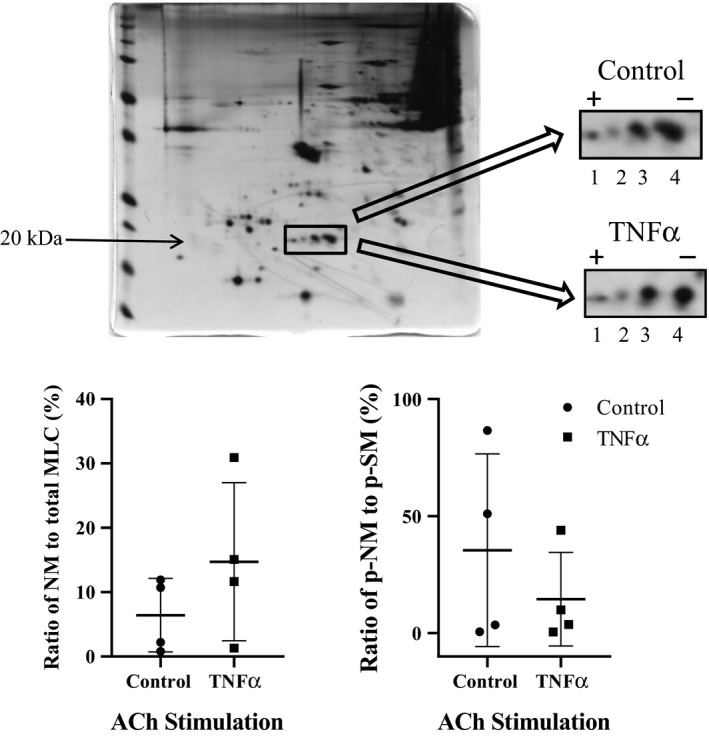
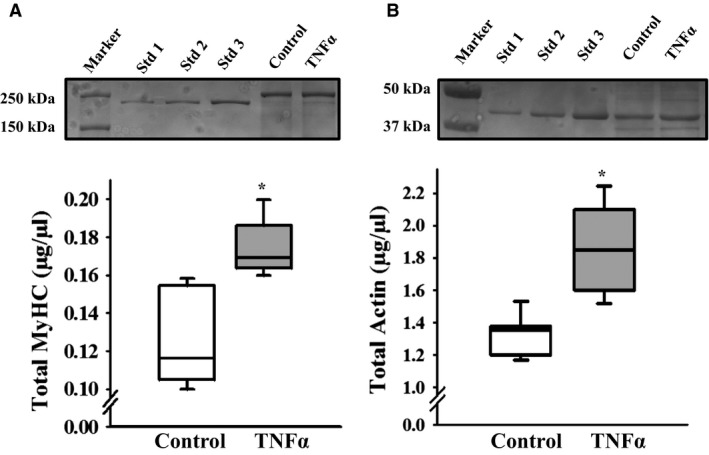
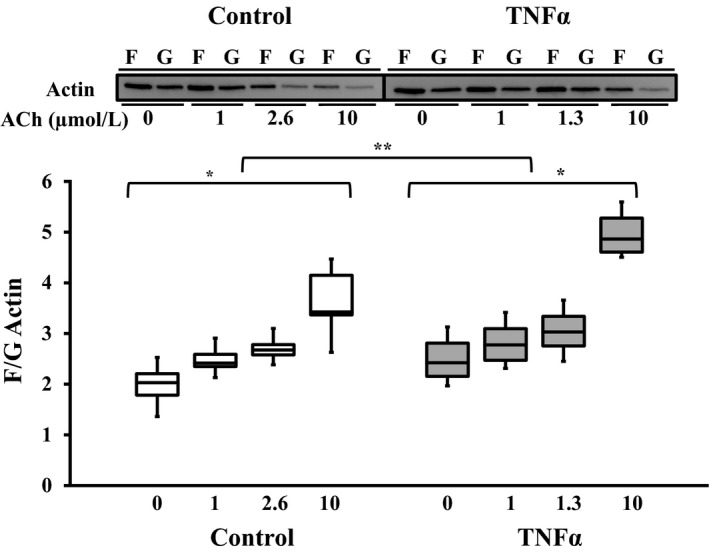
Airway diseases such as asthma are triggered by inflammation and mediated by proinflammatory cytokines such as tumor necrosis factor alpha (TNFα). Our goal was to systematically examine the potential mechanisms underlying the effect of TNFα on airway smooth muscle (ASM) contractility. Porcine ASM strips were incubated for 24 h with and without TNFα. Exposure to TNFα increased maximum ASM force in response to acetylcholine (Ach), with an increase in ACh sensitivity (hyperreactivity), as reflected by a leftward shift in the dose-response curve (EC50 ). At the EC50 , the [Ca2+ ]cyt response to ACh was similar between TNFα and control ASM, while force increased; thus, Ca2+ sensitivity appeared to increase. Exposure to TNFα increased the basal level of regulatory myosin light chain (rMLC) phosphorylation in ASM; however, the ACh-dependent increase in rMLC phosphorylation was blunted by TNFα with no difference in the extent of rMLC phosphorylation at the EC50 ACh concentration. In TNFα-treated ASM, total actin and myosin heavy chain concentrations increased. TNFα exposure also enhanced the ACh-dependent polymerization of G- to F-actin. The results of this study confirm TNFα-induced hyperreactivity to ACh in porcine ASM. We conclude that the TNFα-induced increase in ASM force, cannot be attributed to an enhanced [Ca2+ ]cyt response or to an increase in rMLC phosphorylation. Instead, TNFα increases Ca2+ sensitivity of ASM force generation due to increased contractile protein content (greater number of contractile units) and enhanced cytoskeletal remodeling (actin polymerization) resulting in increased tethering of contractile elements to the cortical cytoskeleton and force translation to the extracellular matrix.
Keywords: Actin polymerization; inflammation; myosin heavy chain; myosin light chain phosphorylation.
© 2019 The Authors. Physiological Reports published by Wiley Periodicals, Inc. on behalf of The Physiological Society and the American Physiological Society.
Conflict of interest statement
The authors have no conflicts of interests.
Figures
Similar articles
-
TNFα enhances force generation in airway smooth muscle.Am J Physiol Lung Cell Mol Physiol. 2017 Jun 1;312(6):L994-L1002. doi: 10.1152/ajplung.00550.2016. Epub 2017 Apr 6. Am J Physiol Lung Cell Mol Physiol. 2017. PMID: 28385814 Free PMC article.
-
Relationship between force and regulatory myosin light chain phosphorylation in airway smooth muscle.Am J Physiol Lung Cell Mol Physiol. 2000 Jul;279(1):L52-8. doi: 10.1152/ajplung.2000.279.1.L52. Am J Physiol Lung Cell Mol Physiol. 2000. PMID: 10893202
-
Effects of TNFα on Dynamic Cytosolic Ca2 + and Force Responses to Muscarinic Stimulation in Airway Smooth Muscle.Front Physiol. 2021 Jul 30;12:730333. doi: 10.3389/fphys.2021.730333. eCollection 2021. Front Physiol. 2021. PMID: 34393833 Free PMC article.
-
Molecular mechanics of smooth muscle contractile proteins in airway hyperresponsiveness and asthma.Proc Am Thorac Soc. 2008 Jan 1;5(1):40-6. doi: 10.1513/pats.200704-053VS. Proc Am Thorac Soc. 2008. PMID: 18094083 Review.
-
Regulation of the contractile element of airway smooth muscle.Am J Physiol. 1991 Aug;261(2 Pt 1):L15-28. doi: 10.1152/ajplung.1991.261.2.L15. Am J Physiol. 1991. PMID: 1872409 Review.
Cited by
-
[Effects of inhibition of Rho/ROCK pathway on proliferation and migration of airway smooth muscle cells and related mechanisms].Zhongguo Dang Dai Er Ke Za Zhi. 2024 Sept 15;26(9):974-981. doi: 10.7499/j.issn.1008-8830.2405119. Zhongguo Dang Dai Er Ke Za Zhi. 2024. PMID: 39267514 Free PMC article. Chinese.
-
Targeting cytoskeletal biomechanics to modulate airway smooth muscle contraction in asthma.J Biol Chem. 2025 Jan;301(1):108028. doi: 10.1016/j.jbc.2024.108028. Epub 2024 Nov 28. J Biol Chem. 2025. PMID: 39615690 Free PMC article. Review.
-
Research advances in airway remodeling in asthma: a narrative review.Ann Transl Med. 2022 Sep;10(18):1023. doi: 10.21037/atm-22-2835. Ann Transl Med. 2022. PMID: 36267708 Free PMC article. Review.
-
The Role of Eosinophil-Derived Neurotoxin and Vascular Endothelial Growth Factor in the Pathogenesis of Eosinophilic Asthma.Cells. 2023 May 6;12(9):1326. doi: 10.3390/cells12091326. Cells. 2023. PMID: 37174726 Free PMC article. Review.
-
Integrative Roles of Pro-Inflammatory Cytokines on Airway Smooth Muscle Structure and Function in Asthma.Immunol Rev. 2025 Mar;330(1):e70007. doi: 10.1111/imr.70007. Immunol Rev. 2025. PMID: 39991781 Free PMC article. Review.
References
-
- Amrani, Y. 2014. Modulation of airway smooth muscle contractile function by TNFα and IL‐13 and airway hyperresponsiveness in asthma Pp. 423–439 in Wang Y.‐X., ed. Calcium signaling in airway smooth muscle cells. Springer International Publishing, Cham, Switzerland.
-
- Chiba, Y. , Nakazawa S., Todoroki M., Shinozaki K., Sakai H., and Misawa M.. 2009. Interleukin‐13 augments bronchial smooth muscle contractility with an up‐regulation of RhoA protein. Am. J. Respir. Cell Mol. Biol. 40:159–167. - PubMed
-
- Chitano, P. , Wang L., Tin G. Y. Y., Ikebe M., Pare P. D., and Seow C. Y.. 2017. Smooth muscle function and myosin polymerization. J. Cell. Sci. 130:2468–2480. - PubMed
-
- Croxton, T. L. , Lande B., and Hirshman C. A.. 1998. Role of G proteins in agonist‐induced Ca2+ sensitization of tracheal smooth muscle. Am. J. Physiol. 275:L748–L755. - PubMed
Publication types
MeSH terms
Substances
Grants and funding
LinkOut - more resources
Full Text Sources
Miscellaneous
