

The Association between Supraphysiologic Arterial Oxygen Levels and Mortality in Critically Ill Patients. A Multicenter Observational Cohort Study
- PMID: 31513754
- PMCID: PMC6884048
- DOI: 10.1164/rccm.201904-0849OC
The Association between Supraphysiologic Arterial Oxygen Levels and Mortality in Critically Ill Patients. A Multicenter Observational Cohort Study
Abstract
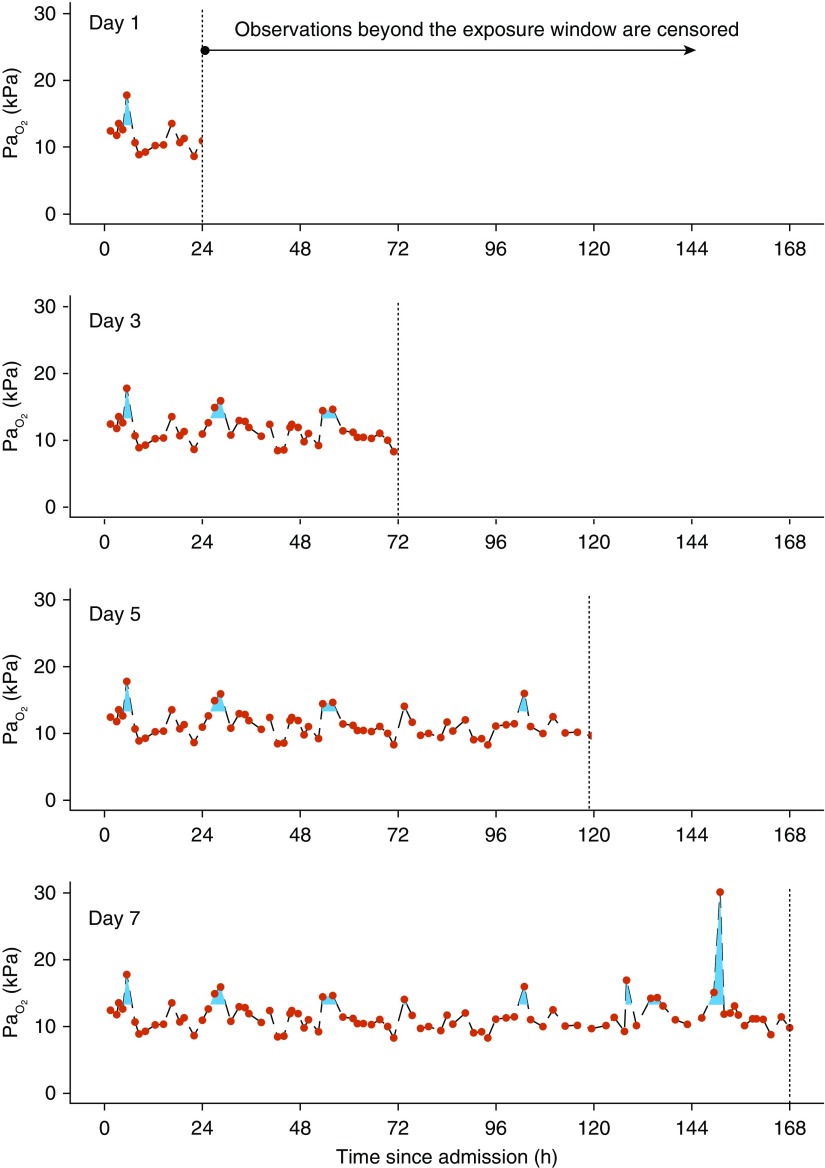
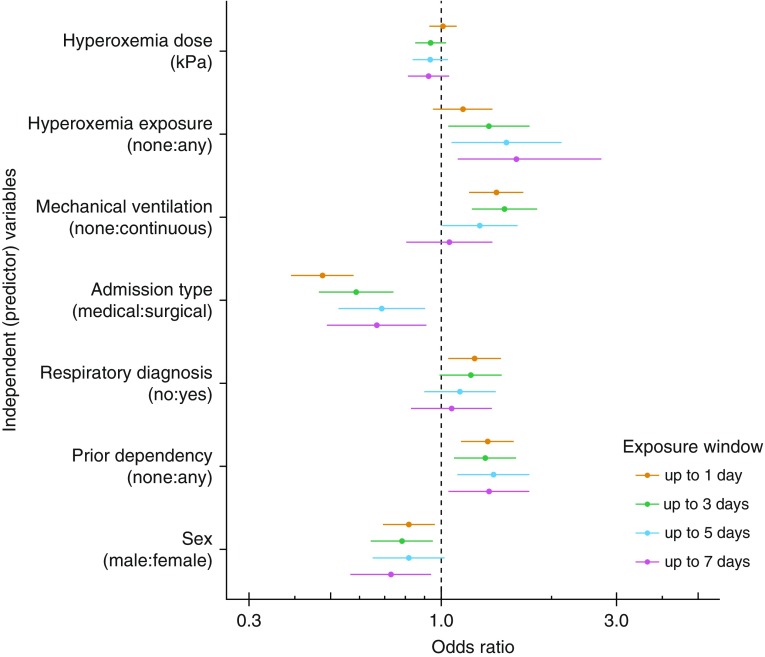
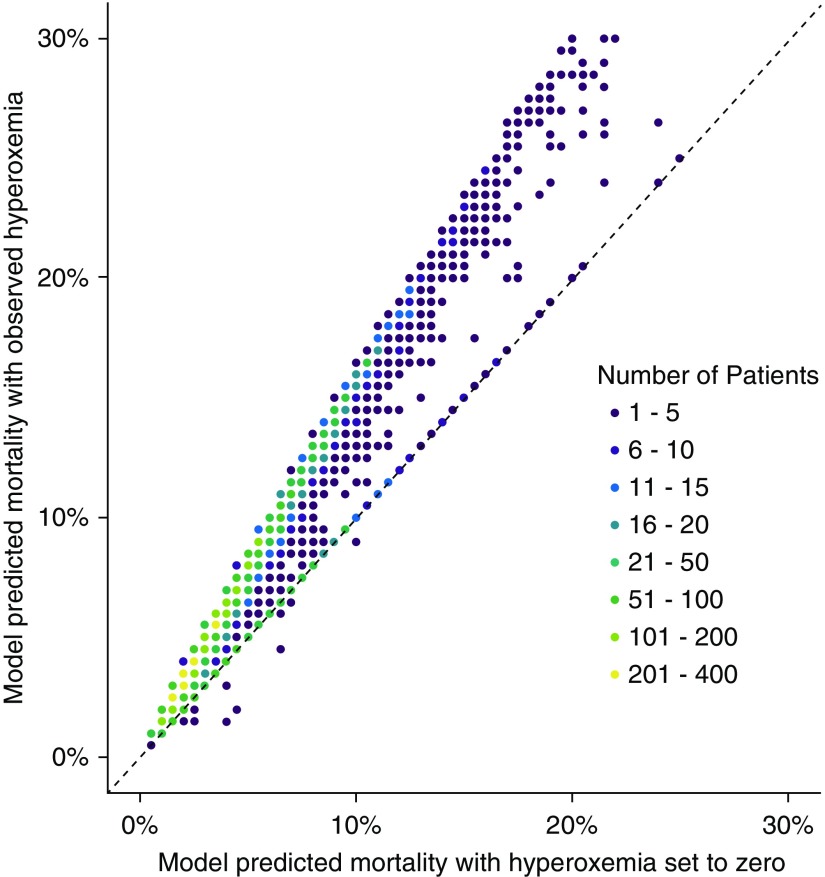
Rationale: There is conflicting evidence on harm related to exposure to supraphysiologic PaO2 (hyperoxemia) in critically ill patients.Objectives: To examine the association between longitudinal exposure to hyperoxemia and mortality in patients admitted to ICUs in five United Kingdom university hospitals.Methods: A retrospective cohort of ICU admissions between January 31, 2014, and December 31, 2018, from the National Institute of Health Research Critical Care Health Informatics Collaborative was studied. Multivariable logistic regression modeled death in ICU by exposure to hyperoxemia.Measurements and Main Results: Subsets with oxygen exposure windows of 0 to 1, 0 to 3, 0 to 5, and 0 to 7 days were evaluated, capturing 19,515, 10,525, 6,360, and 4,296 patients, respectively. Hyperoxemia dose was defined as the area between the PaO2 time curve and a boundary of 13.3 kPa (100 mm Hg) divided by the hours of potential exposure (24, 72, 120, or 168 h). An association was found between exposure to hyperoxemia and ICU mortality for exposure windows of 0 to 1 days (odds ratio [OR], 1.15; 95% compatibility interval [CI], 0.95-1.38; P = 0.15), 0 to 3 days (OR 1.35; 95% CI, 1.04-1.74; P = 0.02), 0 to 5 days (OR, 1.5; 95% CI, 1.07-2.13; P = 0.02), and 0 to 7 days (OR, 1.74; 95% CI, 1.11-2.72; P = 0.02). However, a dose-response relationship was not observed. There was no evidence to support a differential effect between hyperoxemia and either a respiratory diagnosis or mechanical ventilation.Conclusions: An association between hyperoxemia and mortality was observed in our large, unselected multicenter cohort. The absence of a dose-response relationship weakens causal interpretation. Further experimental research is warranted to elucidate this important question.
Keywords: critical care; hyperoxia; logistic models.
Figures
Comment in
-
The Risk of Hyperoxemia in ICU Patients. Much Ado About O2.Am J Respir Crit Care Med. 2019 Dec 1;200(11):1333-1335. doi: 10.1164/rccm.201909-1751ED. Am J Respir Crit Care Med. 2019. PMID: 31526323 Free PMC article. No abstract available.
-
Reply to Tasker and to Lellouche and L'Her.Am J Respir Crit Care Med. 2020 Feb 15;201(4):499. doi: 10.1164/rccm.201910-2045LE. Am J Respir Crit Care Med. 2020. PMID: 31671272 Free PMC article. No abstract available.
-
Hyperoxemia and Death of the Critically Ill: Is There a Problem of Confounding by Indication or Outcome?Am J Respir Crit Care Med. 2020 Feb 15;201(4):497. doi: 10.1164/rccm.201909-1860LE. Am J Respir Crit Care Med. 2020. PMID: 31671277 Free PMC article. No abstract available.
-
Hyperoxemia: The Poison Is in the Dose.Am J Respir Crit Care Med. 2020 Feb 15;201(4):498. doi: 10.1164/rccm.201910-1898LE. Am J Respir Crit Care Med. 2020. PMID: 31671280 Free PMC article. No abstract available.
References
-
- O’Driscoll BR, Howard LS, Earis J, Mak V. BTS guideline for oxygen use in adults in healthcare and emergency settings. Thorax. 2017;72:ii1–ii90. - PubMed
-
- Bak Z, Sjöberg F, Rousseau A, Steinvall I, Janerot-Sjoberg B. Human cardiovascular dose-response to supplemental oxygen. Acta Physiol (Oxf) 2007;191:15–24. - PubMed
-
- McNulty PH, Robertson BJ, Tulli MA, Hess J, Harach LA, Scott S, et al. Effect of hyperoxia and vitamin C on coronary blood flow in patients with ischemic heart disease. J Appl Physiol (1985) 2007;102:2040–2045. - PubMed
-
- Dollery CT, Hill DW, Mailer CM, Ramalho PS. High oxygen pressure and the retinal blood-vessels. Lancet. 1964;2:291–292. - PubMed
Publication types
MeSH terms
Substances
LinkOut - more resources
Full Text Sources
Other Literature Sources
