. 2019 Oct 16;64(20):205015.
doi: 10.1088/1361-6560/ab440d.

Gross tumor volume segmentation for head and neck cancer radiotherapy using deep dense multi-modality network

Affiliations

Gross tumor volume segmentation for head and neck cancer radiotherapy using deep dense multi-modality network

Zhe Guo et al. Phys Med Biol. .

Abstract

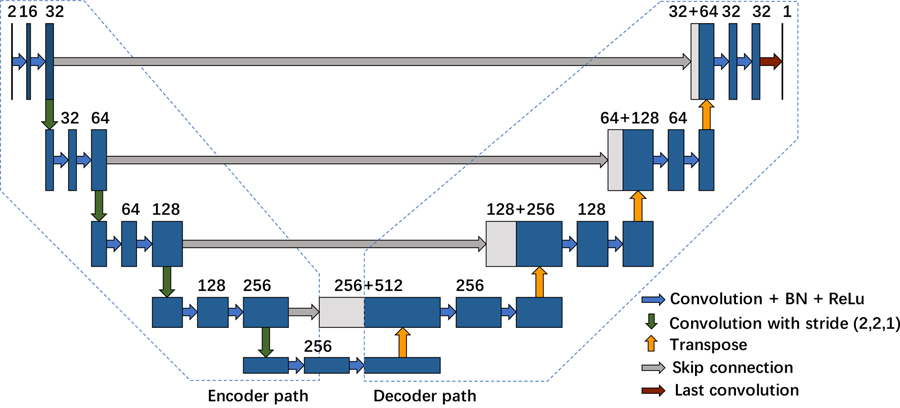
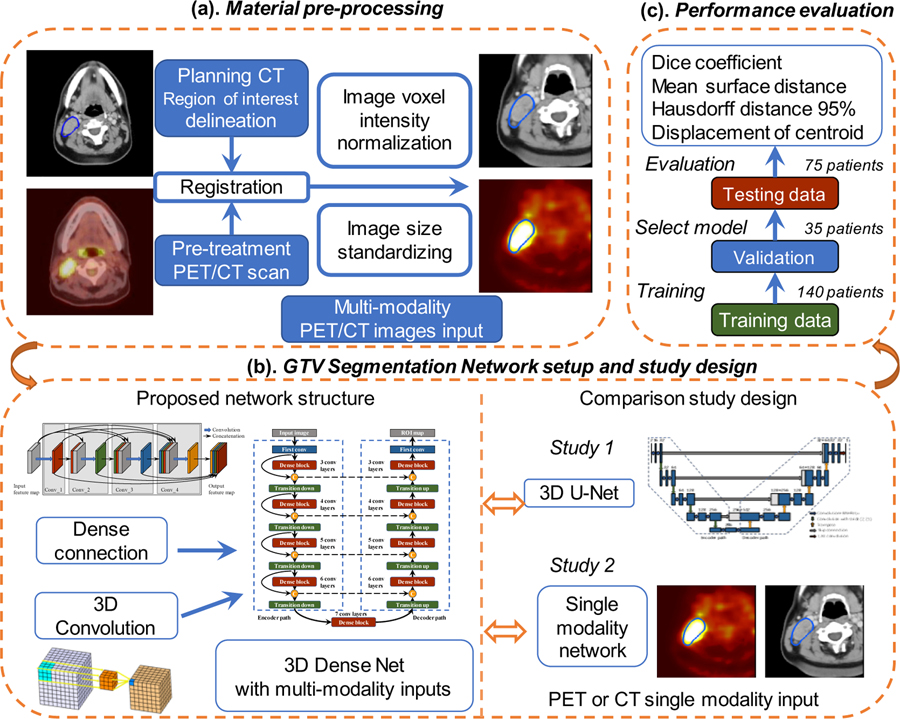
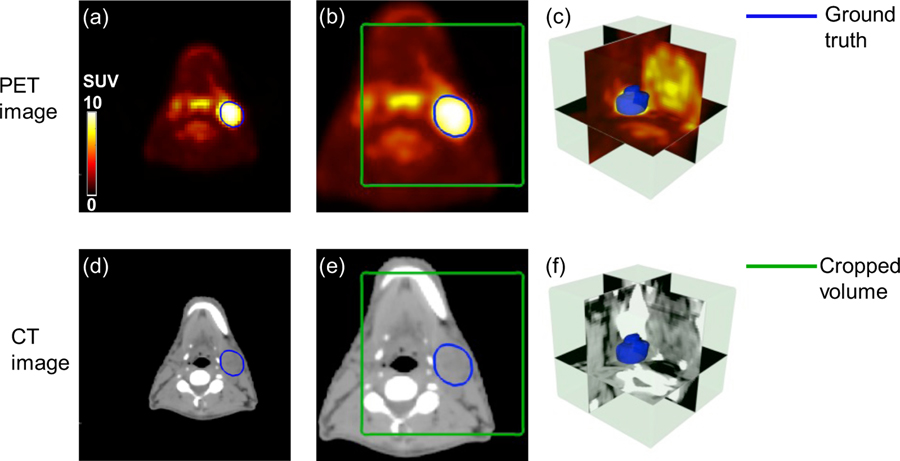
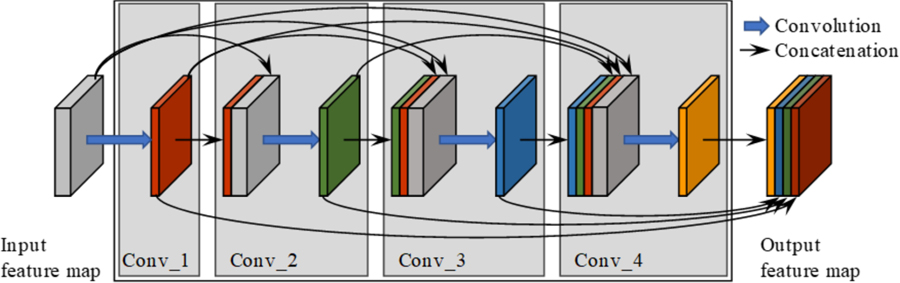
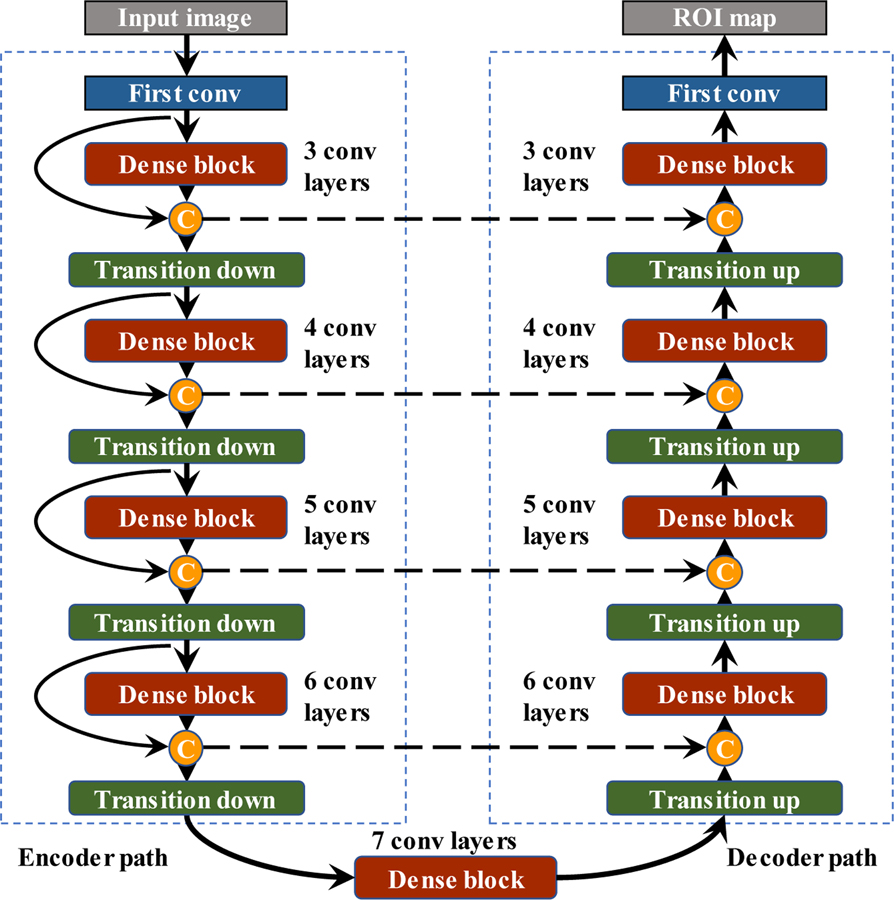
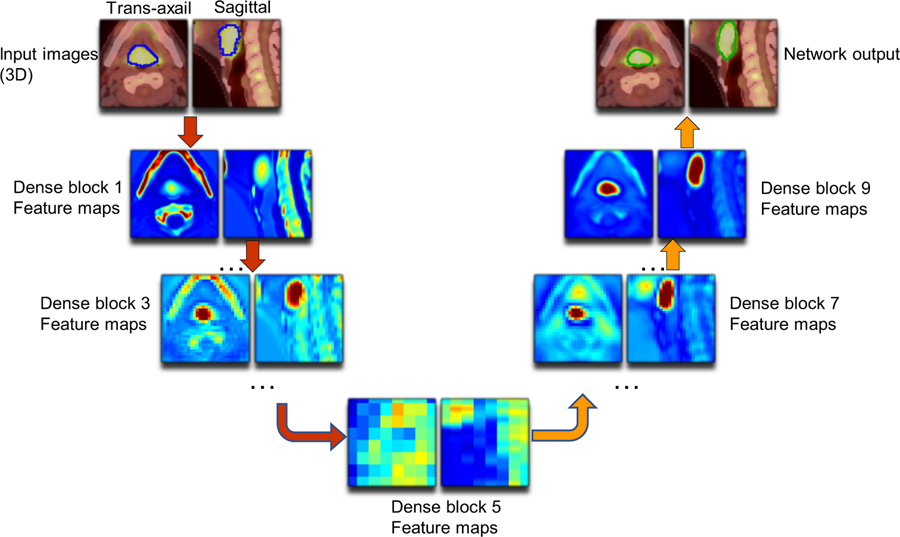
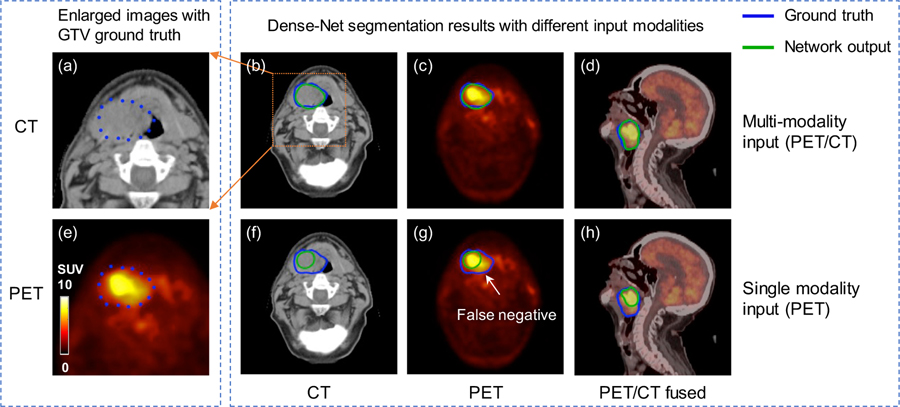
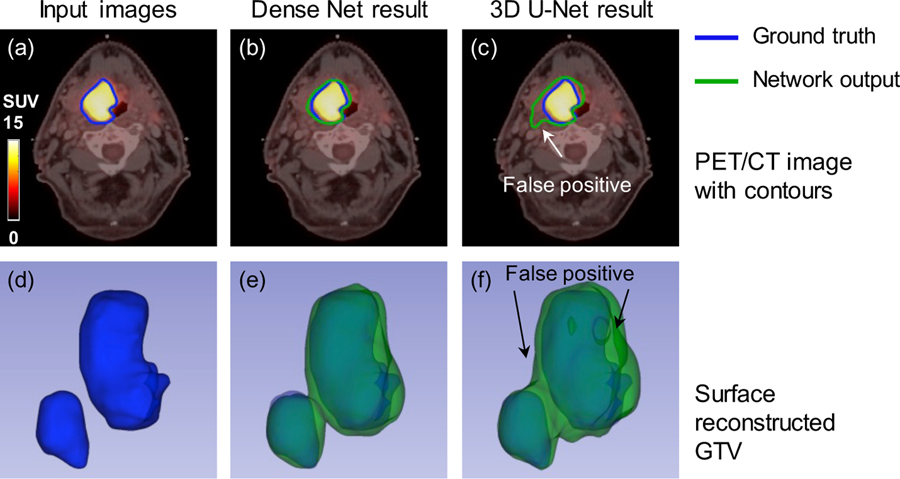
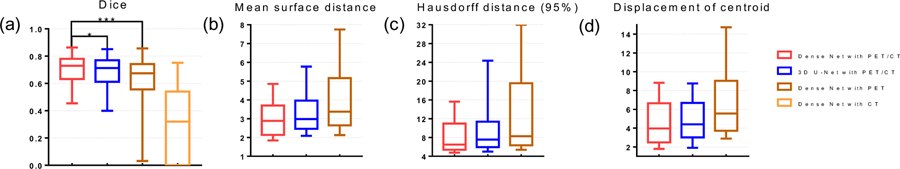
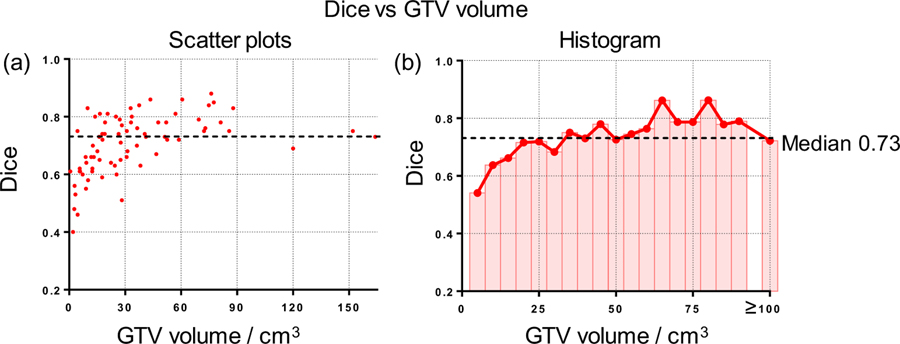
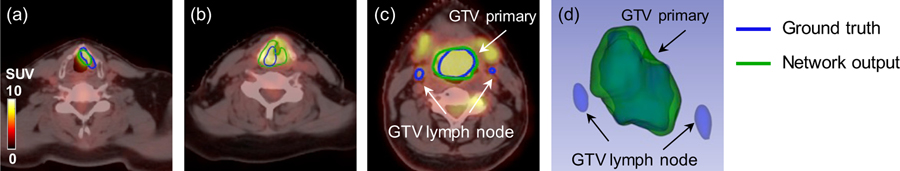
In radiation therapy, the accurate delineation of gross tumor volume (GTV) is crucial for treatment planning. However, it is challenging for head and neck cancer (HNC) due to the morphology complexity of various organs in the head, low targets to background contrast and potential artifacts on conventional planning CT images. Thus, manual delineation of GTV on anatomical images is extremely time consuming and suffers from inter-observer variability that leads to planning uncertainty. With the wide use of PET/CT imaging in oncology, complementary functional and anatomical information can be utilized for tumor contouring and bring a significant advantage for radiation therapy planning. In this study, by taking advantage of multi-modality PET and CT images, we propose an automatic GTV segmentation framework based on deep learning for HNC. The backbone of this segmentation framework is based on 3D convolution with dense connections which enables a better information propagation and takes full advantage of the features extracted from multi-modality input images. We evaluate our proposed framework on a dataset including 250 HNC patients. Each patient receives both planning CT and PET/CT imaging before radiation therapy (RT). Manually delineated GTV contours by radiation oncologists are used as ground truth in this study. To further investigate the advantage of our proposed Dense-Net framework, we also compared with the framework using 3D U-Net which is the state-of-the-art in segmentation tasks. Meanwhile, for each frame, the performance comparison between single modality input (PET or CT image) and multi-modality input (both PET/CT) is conducted. Dice coefficient, mean surface distance (MSD), 95th-percentile Hausdorff distance (HD95) and displacement of mass centroid (DMC) are calculated for quantitative evaluation. The dataset is split into train (140 patients), validation (35 patients) and test (75 patients) groups to optimize the network. Based on the results on independent test group, our proposed multi-modality Dense-Net (Dice 0.73) shows better performance than the compared network (Dice 0.71). Furthermore, the proposed Dense-Net structure has less trainable parameters than the 3D U-Net, which reduces the prediction variability. In conclusion, our proposed multi-modality Dense-Net can enable satisfied GTV segmentation for HNC using multi-modality images and yield superior performance than conventional methods. Our proposed method provides an automatic, fast and consistent solution for GTV segmentation and shows potentials to be generally applied for radiation therapy planning of a variety of cancer (e.g. lung, sarcoma, liver and so on).


Figures

None
3D U-Net architecture BN is abbreviation for batch normalization and ReLU for rectified linear unit.
Figure 1.
Figure 1.
Flowchart of this study: (a) Material pre-processing; (b) Proposed network with Dense Connections and comparison studies with single modality input and 3D U-Net (c) performance evaluation.
Figure 2.
Figure 2.
Illusive examples of input PET and CT images (blue contour: manually delineated GTV; green box: cropped volume for segmentation). (a) registered original PET image (b) resampled PET image (c) 3D visualization of cropped PET image (d) planning CT image (e) resampled CT image (f) 3D visualization of cropped CT image.
Figure 3.
Figure 3.
Dense block architecture with 4 convolution layers. Blue arrows denote convolutions and black arrows indicate dense connections between feature maps.
Figure 4.
Figure 4.
The structure of proposed network including 9 dense blocks, 4 transition-down and 4 transition-up modules.
Figure 5.
Figure 5.
Representative feature maps from Dense Net (Left: axial plane; right: sagittal plane). Outputs from dense blocks 1,3,5,7,9 are shown for illustration. Blue contours shown on input images refers to the manually drawn GTV (training label) and the green contours shown at the end refers to the network predicted GTV contours (results).
Figure 6.
Figure 6.
Representative results of Dense Net with different input modalities. (a, e) zoomed-in CT and PET images with GTV contours of primary tumor and lymph node. (b, c, d) Dense-Net segmentation results with PET/CT multi-modality input. (f, g, h) Dense-Net segmentation results with PET single modality input. Blue contour represents GTV ground truth and green contour refers to network output.
Figure 7.
Figure 7.
Comparison of the segmentation results from the multi-modality Dense-Net and 3D U-Net. (a) Input image; (b) Multi-modality Dense-Net results; (c) the 3D U-Net result; (d, e, f) corresponding 3D visualizations of (a, b, c), respectively.
Figure 8.
Figure 8.
Statistic results of network performance (a) Dice box plot (Box for median and 25~75 percentiles and whisker for 2.5~97.5 percentile), (b) Mean surface distance (MSD), and (c) Hausdorff distance (95%) (HD95), (d) Displacement of center of mass. (b), (c) and (d) shares the same box plot strategy. * stands for p-value < 0.05 and *** for p-value < 0.001.
Figure 9.
Figure 9.
Relationship between Dice and GTV volume size. (a) Scatter plots illustrating Dice and GTV volume size; (b) Histogram and average curve of Dice on GTV volume size.
Figure 10.
Figure 10.
Representative cases with false positive and false negative regions. (a) PET/CT image of a patient with tumor in larynx, (b) PET/CT image of a patient with tumor around esophagus, (c) PET/CT image of a patient with large tumor and a lymph node metastasis, and (d) 3D visualization of GTVs in (c).

References

    1. Bagci U, Udupa JK, Mendhiratta N, Foster B, Xu Z, Yao J, Chen X and Mollura DJ 2013. Joint segmentation of anatomical and functional images: Applications in quantification of lesions from PET, PET-CT, MRI-PET, and MRI-PET-CT images Medical image analysis 17 929–45 - PMC - PubMed
    1. Beichel RR, Van Tol M, Ulrich EJ, Bauer C, Chang T, Plichta KA, Smith BJ, Sunderland JJ, Graham MM and Sonka M 2016. Semiautomated segmentation of head and neck cancers in 18F-FDG PET scans: A just-enough-interaction approach Medical physics 43 2948–64 - PMC - PubMed
    1. Berthon B, Evans M, Marshall C, Palaniappan N, Cole N, Jayaprakasam V, Rackley T and Spezi E 2017. Head and neck target delineation using a novel PET automatic segmentation algorithm Radiotherapy and Oncology 122 242–7 - PubMed
    1. Çiçek Ö, Abdulkadir A, Lienkamp SS, Brox T and Ronneberger O International Conference on Medical Image Computing and Computer-Assisted Intervention,2016), vol. Series): Springer; ) pp 424–32
    1. Clark K, Vendt B, Smith K, Freymann J, Kirby J, Koppel P, Moore S, Phillips S, Maffitt D and Pringle M 2013. The Cancer Imaging Archive (TCIA): maintaining and operating a public information repository Journal of digital imaging 26 1045–57 - PMC - PubMed

Publication types

MeSH terms