. 2019 Sep 11;20(18):4486.
doi: 10.3390/ijms20184486.

Deficiency of Mitochondrial Aspartate-Glutamate Carrier 1 Leads to Oligodendrocyte Precursor Cell Proliferation Defects Both In Vitro and In Vivo

Affiliations

Deficiency of Mitochondrial Aspartate-Glutamate Carrier 1 Leads to Oligodendrocyte Precursor Cell Proliferation Defects Both In Vitro and In Vivo

Sabrina Petralla et al. Int J Mol Sci. .

Abstract

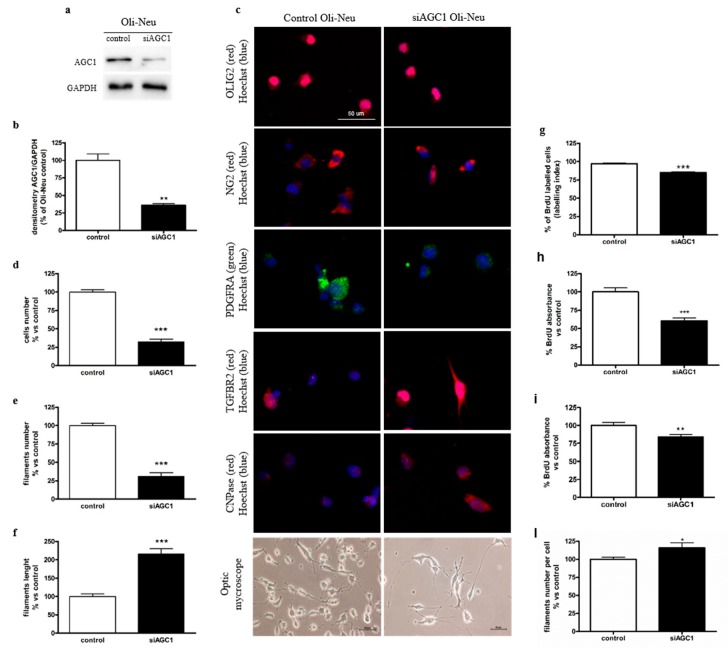
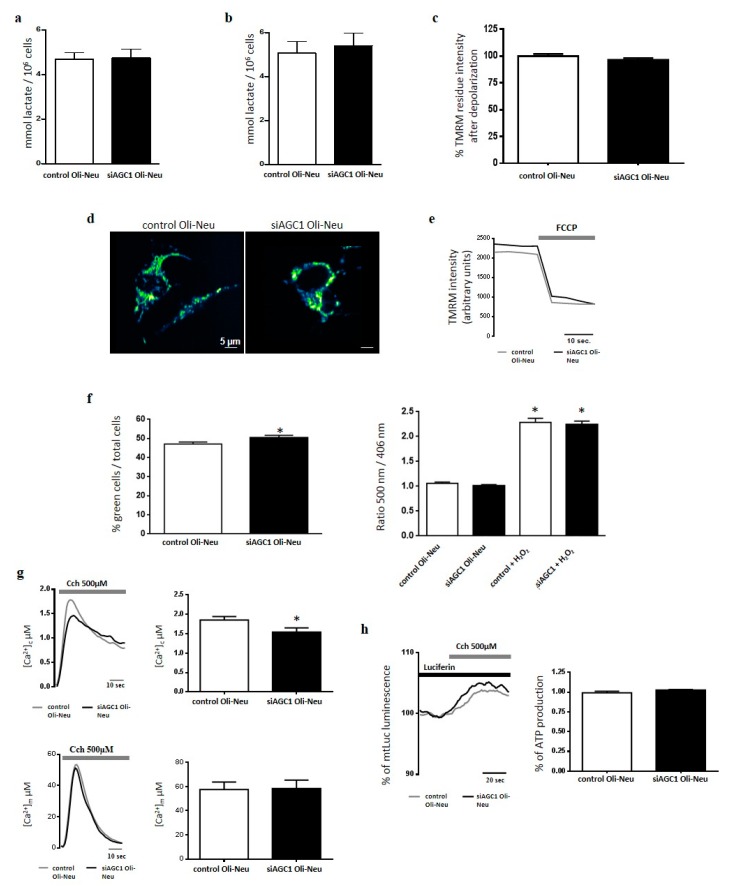
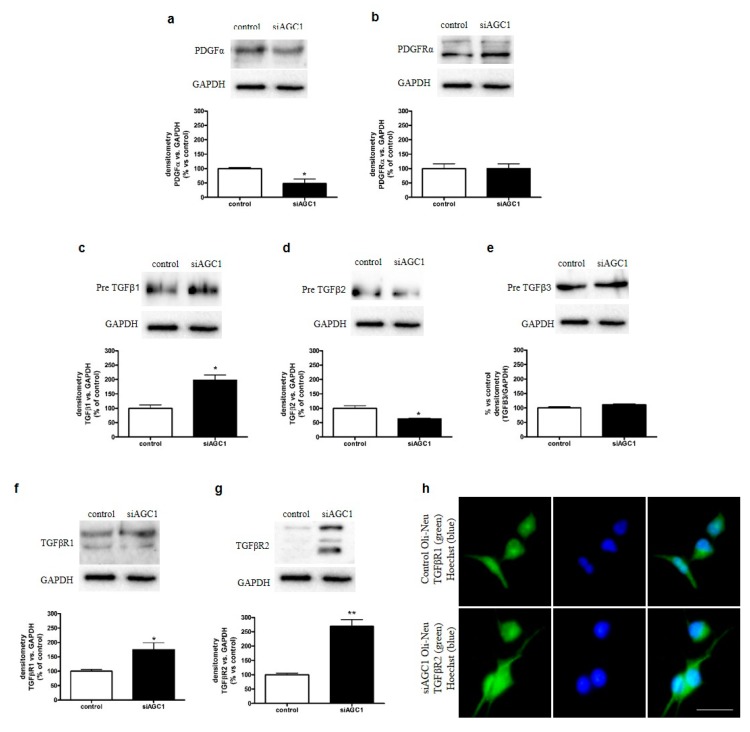
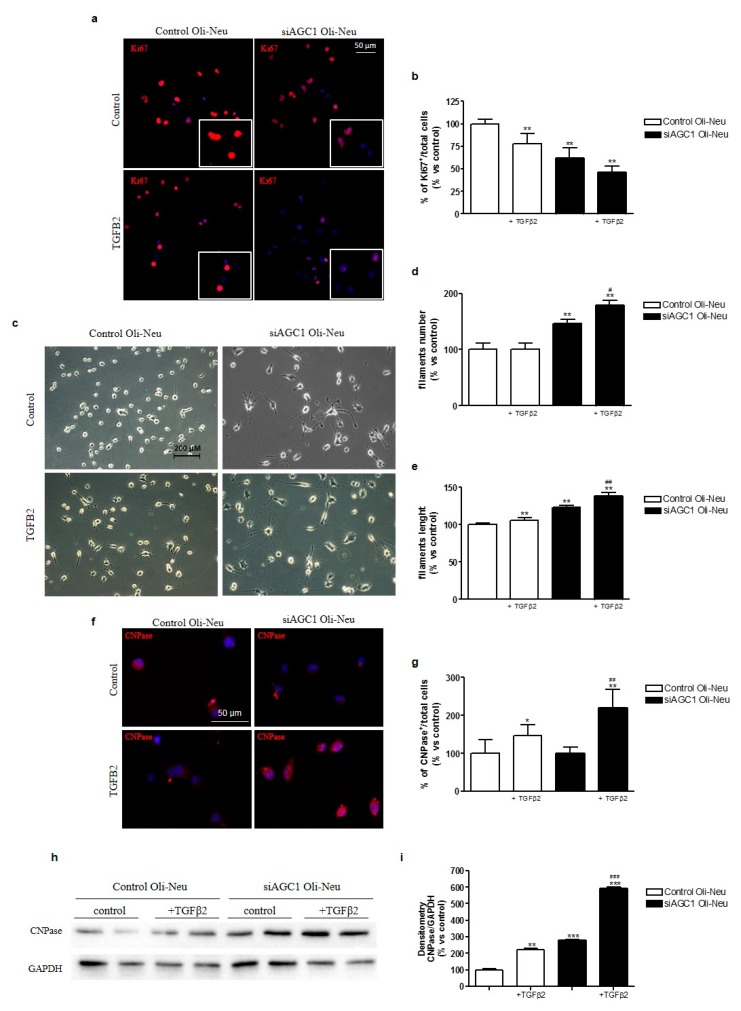
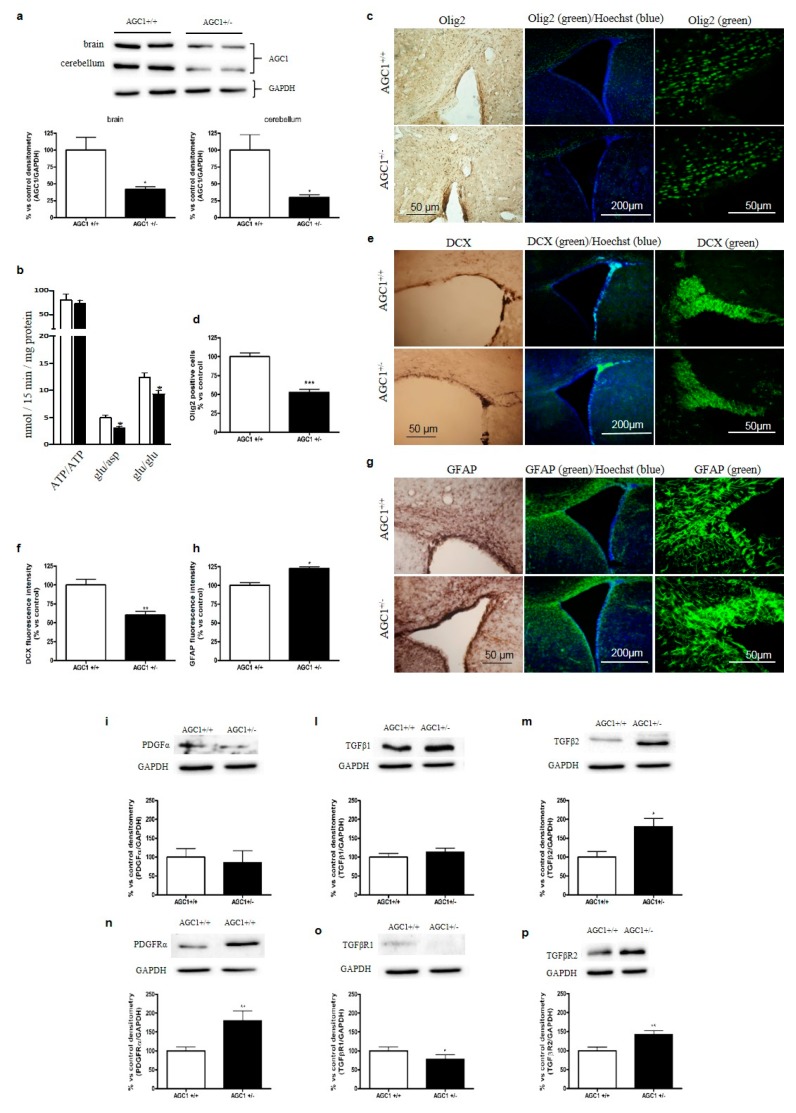
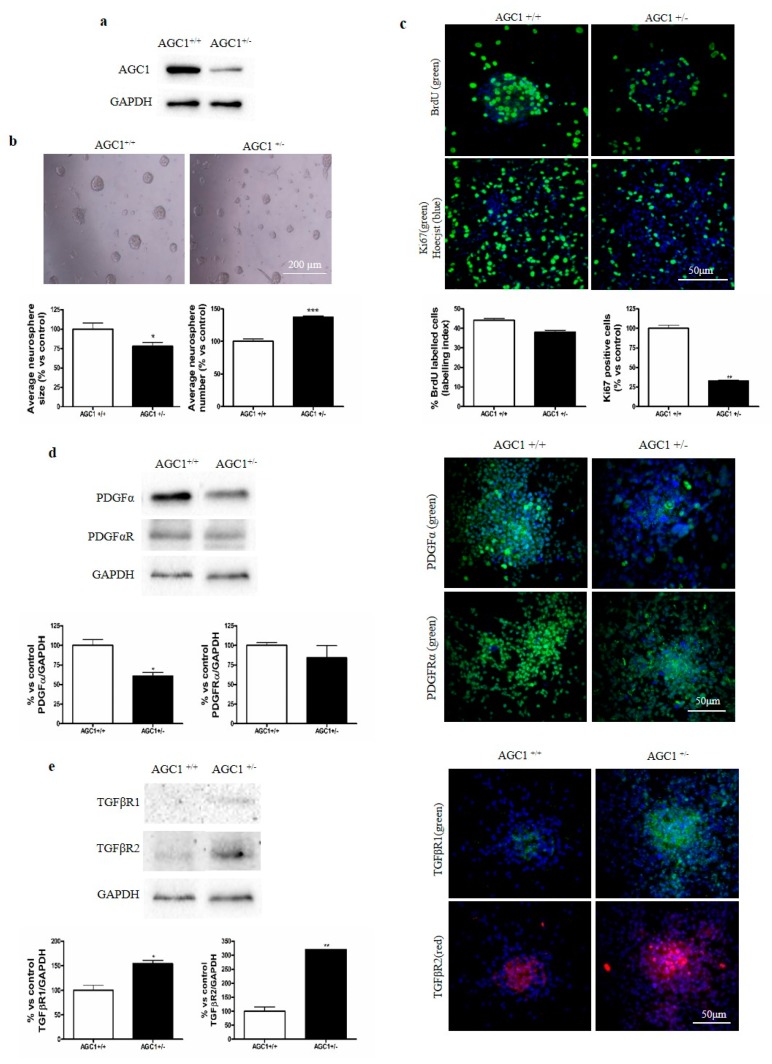
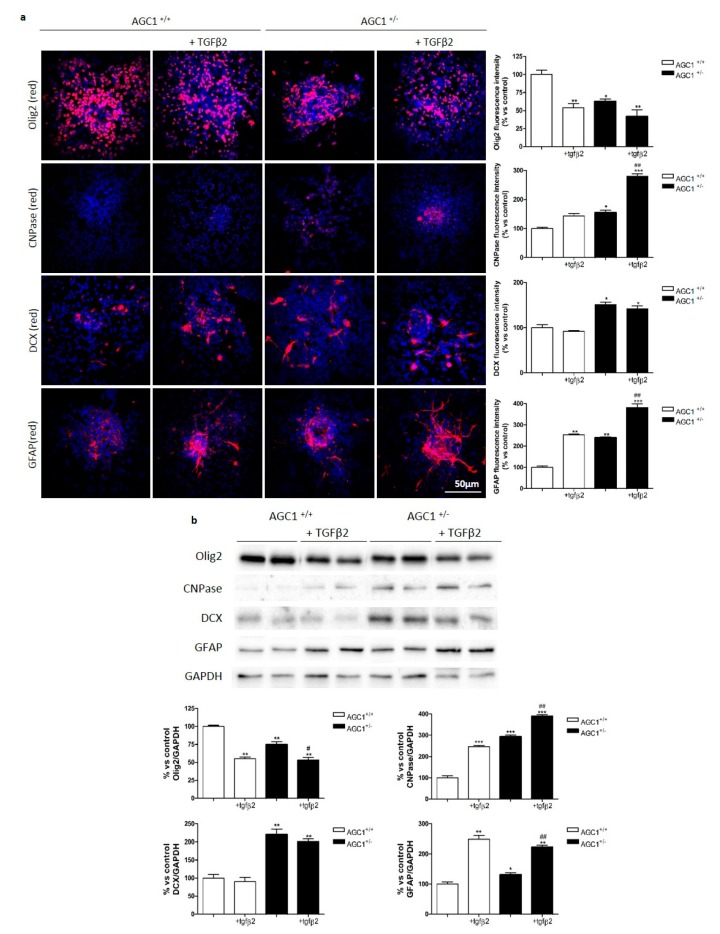
Aspartate-Glutamate Carrier 1 (AGC1) deficiency is a rare neurological disease caused by mutations in the solute carrier family 25, member 12 (SLC25A12) gene, encoding for the mitochondrial aspartate-glutamate carrier isoform 1 (AGC1), a component of the malate-aspartate NADH shuttle (MAS), expressed in excitable tissues only. AGC1 deficiency patients are children showing severe hypotonia, arrested psychomotor development, seizures and global hypomyelination. While the effect of AGC1 deficiency in neurons and neuronal function has been deeply studied, little is known about oligodendrocytes and their precursors, the brain cells involved in myelination. Here we studied the effect of AGC1 down-regulation on oligodendrocyte precursor cells (OPCs), using both in vitro and in vivo mouse disease models. In the cell model, we showed that a reduced expression of AGC1 induces a deficit of OPC proliferation leading to their spontaneous and precocious differentiation into oligodendrocytes. Interestingly, this effect seems to be related to a dysregulation in the expression of trophic factors and receptors involved in OPC proliferation/differentiation, such as Platelet-Derived Growth Factor α (PDGFα) and Transforming Growth Factor βs (TGFβs). We also confirmed the OPC reduction in vivo in AGC1-deficent mice, as well as a proliferation deficit in neurospheres from the Subventricular Zone (SVZ) of these animals, thus indicating that AGC1 reduction could affect the proliferation of different brain precursor cells. These data clearly show that AGC1 impairment alters myelination not only by acting on N-acetyl-aspartate production in neurons but also on OPC proliferation and suggest new potential therapeutic targets for the treatment of AGC1 deficiency.

Keywords: AGC1 deficiency; growth factors; mitochondrial disease; mouse model; subventricular zone.


Conflict of interest statement

The authors have no conflict of interest to declare.

Figures

Figure 1
Figure 1
Spontaneous oligodendrocyte precursor cell (OPC) differentiation and OPC proliferation defects in aspartate glutamate carrier 1 (AGC1)-silenced Oli-Neu cells. Western blot analysis (a) and relative densitometries (b) of AGC1 expression in Oli-Neu cells, in which a partial silencing of the mouse AGC1 gene has been produced (siAGC1). Densitometry is the ratio between the expression level of AGC1 and GAPDH (Glyceraldehyde 3-phosphate dehydrogenase) as reference loading control and is expressed as percentage vs. control Oli-Neu cells. Immunofluorescence staining and optical microscopy images (c) of control and siAGC1 Oli-Neu cells. Nuclei were labelled with Hoechst, while Olig2, NG2, PDGFαR, TGFβR2 and CNPase were used as specific markers for Oli-Neu cells. Analyses for cells number (d), total filaments number (e), filaments length (f) and filaments number per cell (l) calculated with Fiji ImageJ2 software. Scale bar: 50 μm. BrdU immunofluorescence of control and siAGC1 Oli-Neu cells with nuclei staining with Hoechst (blue) and BrdU positive-cell count analysis expressed as labelling index (g). BrdU incorporation by ELISA assay (enzyme-linked immunosorbent assay) in control and siAGC1 Oli-Neu cells after 6 (h) and 24 h (i) BrdU incubation. Scale bar: 100 μm. Values are the mean ± SE of 3 independent experiments performed in triplicate, * p < 0.05, ** p < 0.01, *** p < 0.001 compared to control Oli-Neu cells, Student’s t-test.
Figure 2
Figure 2
Effect of AGC1 down-regulation on lactic acid release, mitochondrial membrane potential, ROS generation and [Ca2+] homeostasis of Oli-Neu cells. Lactic acid was quantified in conditioned complete SATO mediumharvested from control Oli-Neu (white bars) or siAGC1-Oli-Neu cells (black bars) in the absence (a, undifferentiated cells) or presence (b, differentiated cells) of 1 mM dibutyryl-cAMP for 48 h. Values are the means ± SD from 3 independent experiments performed in triplicate. (c) Δψm was measured by fluorescence microscopy in control Oli-Neu (white bars) or siAGC1-Oli-Neu cells (black bars) incubated in minimal essential medium supplemented with 1 g/L glucose. Cells were loaded with 20 nM TMRM (tetramethyl rhodamine methyl ester) for 30 min at 37 °C and fluorescence intensities were imaged every 5 s with a fixed 20 milliseconds exposure time. Carbonyl cyanide-4-(trifluoromethoxy)phenylhydrazone (FCCP), an uncoupler of oxidative phosphorylation, was added after 12 acquisitions to completely collapse the electrical gradient established by the respiratory chain (d,e). Data are means ± SD of TMRM percentage intensities normalized to values before agonist stimulation in three independent experiments. (f) Cytosolic and mitochondrial hydrogen peroxide were measured in control-Oli-Neu (white bars) or siAGC1-Oli-Neu cells (black bars) loaded with 5 μM CM-H2DCFDA (left panel) or expressing the ratiometric H2O2-sensitive mt-HyPer protein (right panel). (g) Control-Oli-Neu (grey lines) or siGC1-OliNeu cells (black lines) expressing chimeric aequorins targeted to cytosol (upper panels) or mitochondria (lower panels) were perfused in KRB supplemented with glucose 1 g/L and stimulated with Carbachol 500 µM. Shown traces are representative of the following measurements: for control OliNeu cells, [Ca2+]c peak values, 1.54 ± 0.14 μM, n = 20; [Ca2+]m peak values, 58,4 ± 6.2 μM, n = 20; for siAGC1-OliNeu cells, [Ca2+]c peak values, 1.85 ± 0.09 μM, n = 20; [Ca2+]m peak values, 57,6 ± 4.1 μM, n = 20. (h) ATP-dependent luminescence was measured in control Oli-Neu (grey lines) or siAGC1-Oli-Neu cells (black lines) cells expressing the mitochondrially targeted luciferase (mtLuc) perfused in KRB supplemented with glucose 1 g/L and challenged with Carbachol 500 µM. Data are expressed as percentage of mtLuc light output increase from cells normalized to the prestimulatory values. Shown traces are representative of the following results: for control Oli-Neu cells, 101 ± 8%, n = 20 of the prestimulatory value; for siAGC1-OliNeu cells: 103 ± 9%, n = 20.
Figure 3
Figure 3
Dysregulation of Platelet-Derived Growth Factor α (PDGFα) and Transforming Growth Factor β (TGFβ) pathways in AGC1-silenced Oli-Neu cells. Western blot analysis and relative densitometries of PDGFα (a), PDGFαR (b), TGFβ1 (c), TGFβ2 (d), TGFβ3 (e), TGFβR1 (f) and TGFβR2 (g) expression in control and siAGC1 Oli-Neu cells. Densitometry is the ratio between the expression level of each protein and GAPDH as reference loading control and is expressed as percentage vs. control Oli-Neu cells. (h) Immunofluorescence staining of TGFβR1 in control and siAGC1 Oli-Neu cells (nuclei were labelled with Hoechst). Scale bar: 50 μm. Values are the mean ± SE of 3 independent experiments performed in triplicate, * p < 0.05, ** p < 0.01, compared to control Oli-Neu cells, Student’s t-test.
Figure 4
Figure 4
Effects of TGFβ2 treatment on control and AGC1-silenced Oli-Neu cells proliferation and differentiation. Immunofluorescence staining of Ki67 proliferation marker in control and siAGC1 Oli-Neu cells (nuclei were labelled with Hoechst) (a) and Ki67 positive-cell count analysis expressed as the ratio of Ki67 positive/Hoechst stained cells (b). Optical microscopy images (c) of control and siAGC1 Oli-Neu cells untreated and following treatment with TGFβ2. Scale bar: 200 μm. Filament number (d) and filament length (e) calculated by using Fiji ImageJ2 software (developed by the National Institutes of Health, NIH, USA). Immunofluorescence analysis of CNPase-positive cells (red, with Hoechst-labelled nuclei in blue) (f) and CNPase-positive cell count analysis respectively (g). Scale bar: 50 μm. Western blot analysis (h) and relative densitometries (i) of CNPase expression. Values are the mean ± SE of 3 independent experiments performed in triplicate, *p < 0.1, ** p < 0.01, *** p < 0.001 compared to control Oli-Neu cells, ## p < 0.01, ### p < 0.001 compared to siAGC1 Oli-Neu cells, Two-way ANOVA (Bonferroni’s post-test).
Figure 5
Figure 5
Proliferation deficits and dysregulation of PDGFα and TGFβ pathways in 21-day old AGC1+/− mice. Western Blot analysis of AGC1 expression in 21-day old AGC1+/+ (n = 8) and AGC1+/− (n = 8) mice in brain and cerebellum (a). GAPDH was used as reference loading control. Respective densitometric analyses are shown below. Bars represent the mean ± SE of 3 independent experiments performed in triplicate, * p < 0.05, compared to AGC1+/+ mice, t-test of Student. (b) Transport activities in brain mitochondria. [14C]ATP ext/ATP int (0.1 mM ext/20 mM ext), [14C]aspartate ext/glutamate int (0.05 mM ext/20 mM ext) and [14C]glutamate ext /glutamate int (0.1 mM ext/20 mM ext) were assayed in liposomes reconstituted with mitochondrial protein extracts isolated from AGC1+/+ (white column) and AGC1+/− (black column) mouse brains. Transport activities were measured 30 min after the addition of the radiolabelled substrates. Data are the mean ± SD, n = 6, * p < 0.01 compared to liposomes reconstituted with AGC1+/+ mitochondrial extracts, one-way analysis with Bonferroni’s post-hoc test. Immunohistochemical and immunofluorescence analysis of Olig2+ cells (c), as well as doublecortin (DCX) (e) and Glial fibrillary acidic protein (GFAP) (g), respectively markers of OPCs, immature neurons and astrocytes, in the corpus callosum and subventricular zone of 21-day old AGC1+/+ and AGC1+/− mice (scale bar = 300 μM). Cell count and fluorescence intensity analysis showed a significant reduction for Olig2+ (d) and DCX+ (f), while GFAP+ cells (h) were increased in AGC1+/− mice. Bars are expressed as percentage vs. AGC1+/+ and represent the mean ± SE of three experiments for Olig2 and the mean ± SE of two experiments for DCX and GFAP. * p < 0.05, *** p < 0.001 compared to AGC1+/+ mice. Student’s t-Test. Western blot analysis and relative densitometries of PDGFα (i), TGFβ1 (l), TGFβ2 (m), PDGFαR (n), TGFβR1 (o) and TGFβR2 (p) expression in 21-day old AGC1+/+ and AGC1+/− mice. Densitometry is the ratio between the expression level of each protein and of GAPDH as reference loading control and is expressed as percentage vs. AGC1+/+. Values are the mean ± SE of 3 independent experiments performed in triplicate, * p < 0.05, ** p < 0.01, compared to AGC1+/+, Student’s t-test.
Figure 6
Figure 6
Altered proliferation and TGFβ receptor expression in neurospheres from the SVZ of AGC1+/+ and AGC1+/− mice. Western Blot analysis confirmed reduced AGC1 expression in AGC1+/− neurospheres compared to AGC1+/+ neurospheres (about 65–70% reduction). GAPDH was used as an endogenous control to normalize data (a). Bright field microscopy images (10X) of AGC1+/+ and AGC1+/− neurospheres. AGC1+/− neurospheres (right) showed heterogeneous morphology and appeared smaller than AGC1+/+ neurospheres. AGC1+/− neurosphere cell number was also higher than AGC1+/+ neurospheres confirmed by newly formed AGC1+/+ and AGC1+/− neurosphere size and number analysis after 4 days of incubation. * p < 0.05, *** p < 0.001 compared to AGC1+/+ neurospheres. Student’s t-test. Scale bar: 200 μm. (b). BrdU and Ki67 immunofluorescence 3D confocal microscopy images (40X) on AGC1+/+ and AGC1+/− neurospheres, BrdU or Ki67 (green), nuclei (blue); BrdU and Ki67-positive cell count in AGC1+/− neurospheres compared to AGC1+/+ neurospheres. ** p < 0.01 compared to AGC1+/+ neurospheres. Student’s t-test. Scale bar: 50 μm (c). Western blot analysis and relative densitometries of PDGFα and PDGFRα expression in AGC1+/+ and AGC1+/− neurospheres. Densitometry is the ratio between the expression level of each protein and GAPDH as reference loading control and is expressed as percentage vs AGC1+/+ neurospheres. Immunofluorescence staining of PDGFα and PDGFRα in AGC1+/+ and AGC1+/− neurospheres (nuclei were labelled with Hoechst). Scale bar: 50 μm. Values are the mean ± SE of 3 independent experiments performed in triplicate, * p < 0.05, compared to AGC1+/+ neurospheres, Student’s t-test (d). Western blot analysis and relative densitometries of TGFβR1 and TGFβR2 expression in AGC1+/+ and AGC1+/− neurospheres. Densitometry is the ratio between the expression level of each protein and GAPDH as reference loading control and is expressed as percentage vs AGC1+/+ neurospheres. Immunofluorescence staining of TGFβR1 and TGFβR2 in AGC1+/+ and AGC1+/− neurospheres (nuclei were labelled with Hoechst). Scale bar: 50 μm. Values are the mean ± SE of 3 independent experiments performed in triplicate, * p < 0.05, ** p < 0.01, compared to AGC1+/+ neurospheres, Student’s t-test (e).
Figure 7
Figure 7
Effect of exogenous TGFβ2 on proliferation/differentiation in neurospheres from AGC1+/+ and AGC1+/− mouse SVZ. Immunofluorescence staining in AGC1+/+ and AGC1+/− neurospheres and following treatment with TGFβ2 after 4-day differentiation (a). Olig2, CNPase, DCX and GFAP used as specific markers for OPCs, mature oligodendrocytes, NSCs and astrocytes respectively (nuclei labelled with Hoechst). Scale bar: 50 μm. Analyses for Olig2+ and DCX+ cell number and CNPase+/GFAP+ fluorescence signal intensity evaluated with Fiji ImageJ2 software. Values are the mean ± SE of 3 independent experiments performed in triplicate, * p < 0.05, ** p < 0.01, *** p < 0.001 compared to control AGC1+/+ neurospheres, # p < 0.05, ## p < 0.01 compared to control AGC1+/− neurospheres, Two-way ANOVA (Bonferroni’s post-test). Western blot analysis and relative densitometries of Olig2, CNPase, DCX and GFAP expression in AGC1+/+ and AGC1+/− neurospheres and following treatment with TGFβ2 after 4-day differentiation (b). Densitometry is the ratio between the expression level of each protein and GAPDH as reference loading control and is expressed as percentage vs AGC1+/+ neurospheres. Values are the mean ± SE of 3 independent experiments performed in duplicate, * p < 0.05, ** p < 0.01, *** p < 0.001compared to AGC1+/+ neurospheres, # p < 0.05, ## p < 0.01 compared to control AGC1+/− neurospheres, Two-way ANOVA (Bonferroni’s post-test).

Similar articles

Cited by

References

    1. Wibom R., Lasorsa F.M., Tohonen V., Barbaro M., Sterky F.H., Kucinski T., Naess K., Jonsson M., Pierri C.L., Palmieri F., et al. AGC1 Deficiency Associated with Global Cerebral Hypomyelination. New Engl. J. Med. 2009;361:489–495. doi: 10.1056/NEJMoa0900591. - DOI - PubMed
    1. Falk M.J., Li D., Gai X., McCormick E., Place E., Lasorsa F.M., Otieno F.G., Hou C., Kim C.E., Abdel-Magid N., et al. AGC1 Deficiency Causes Infantile Epilepsy, Abnormal Myelination and Reduced N-Acetylaspartate. JIMD Rep. 2014;14:77–85. - PMC - PubMed
    1. Palmieri F. Mitochondrial transporters of the SLC25 family and associated diseases: A review. J. Inherit. Metab. Dis. 2014;37:565–575. doi: 10.1007/s10545-014-9708-5. - DOI - PubMed
    1. Indiveri C., Krämer R., Palmieri F. Reconstitution of the malate/aspartate shuttle from mitochondria. J. Boil. Chem. 1987;262:15979–15983. - PubMed
    1. Palmieri L., Pardo B., Lasorsa F.M., del Arco A., Kobayashi K., Iijima M., Runswick M.J., Walker J.E., Saheki T., Satrústegui J., et al. Citrin and aralar1 are Ca(2+)-stimulated aspartate/glutamate transporters in mitochondria. EMBO J. 2001;20:5060–5069. doi: 10.1093/emboj/20.18.5060. - DOI - PMC - PubMed

MeSH terms

Substances