Review
. 2019 Sep 11;24(18):3308.
doi: 10.3390/molecules24183308.

Structural Insights into the Regulation Mechanism of Small GTPases by GEFs

Affiliations
Review

Structural Insights into the Regulation Mechanism of Small GTPases by GEFs

Sachiko Toma-Fukai et al. Molecules. .

Abstract

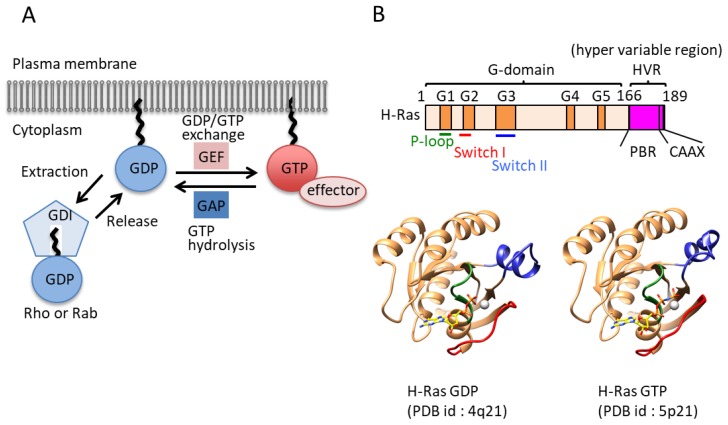
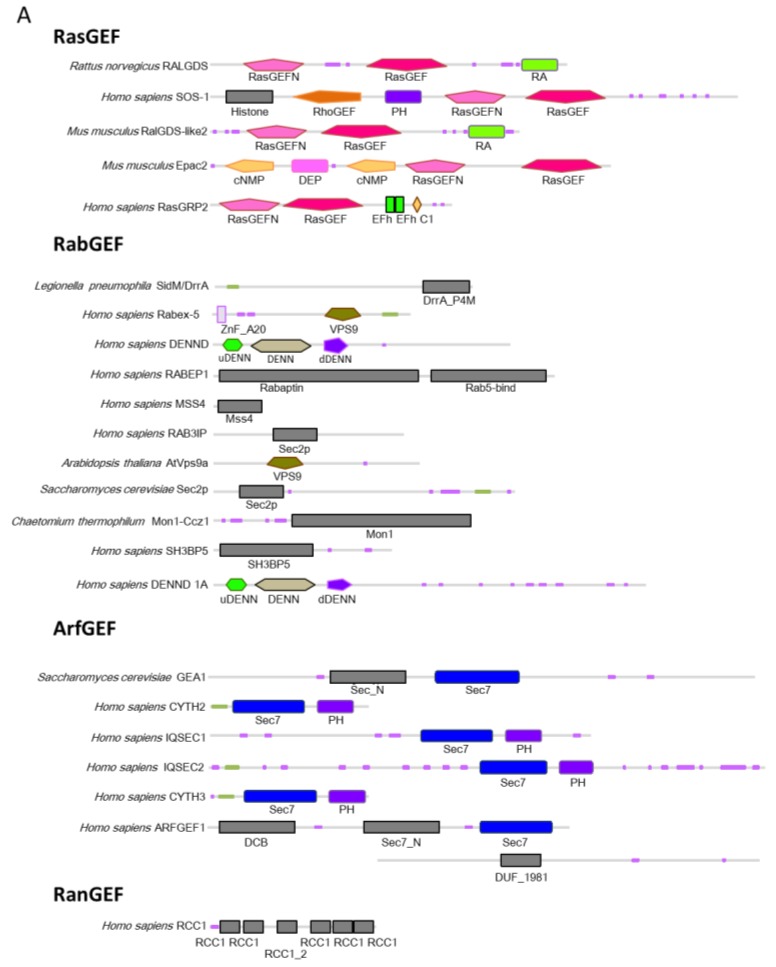
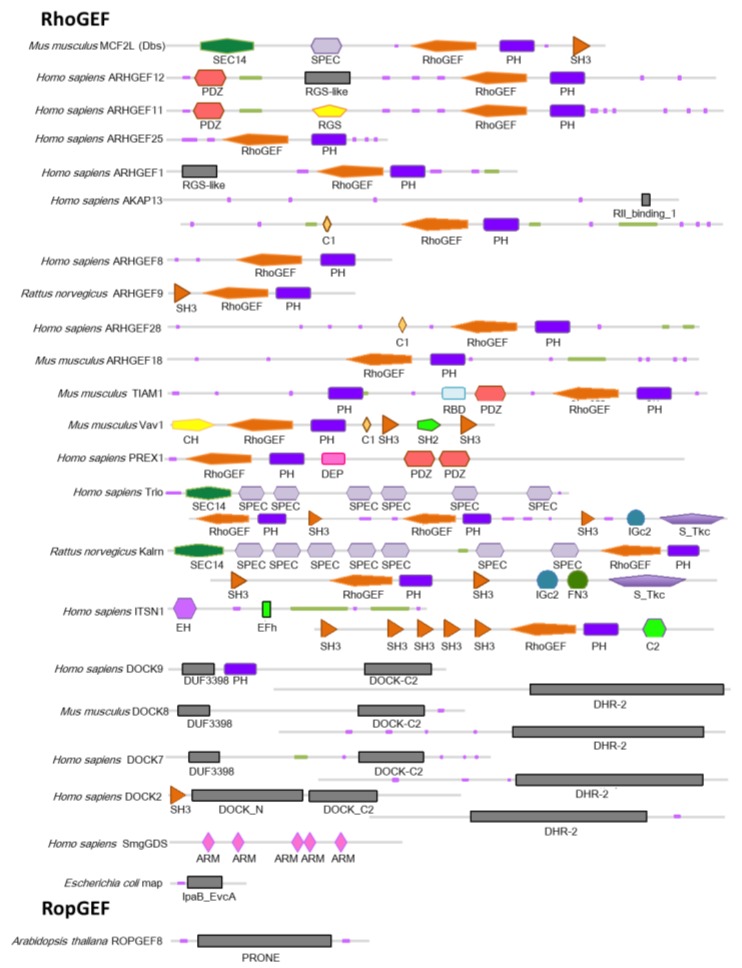
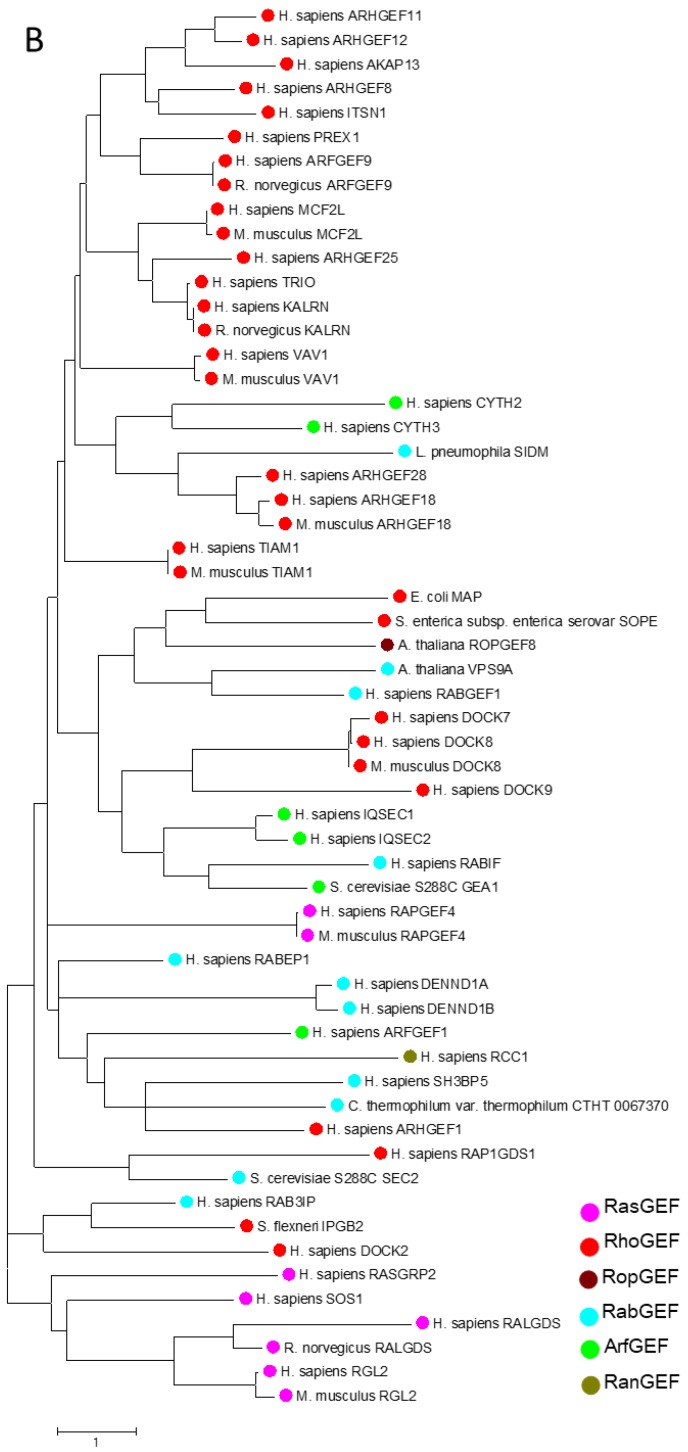
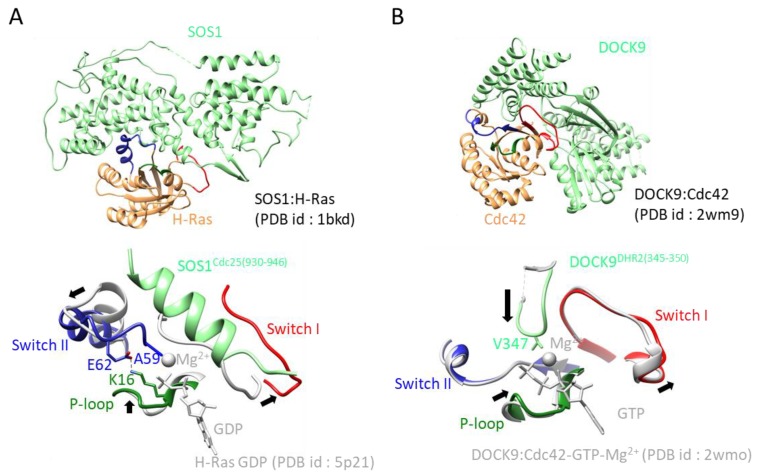
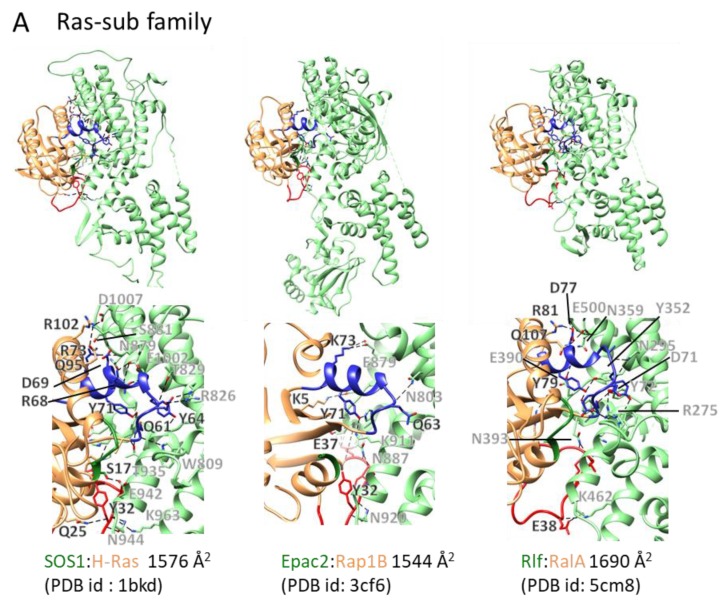
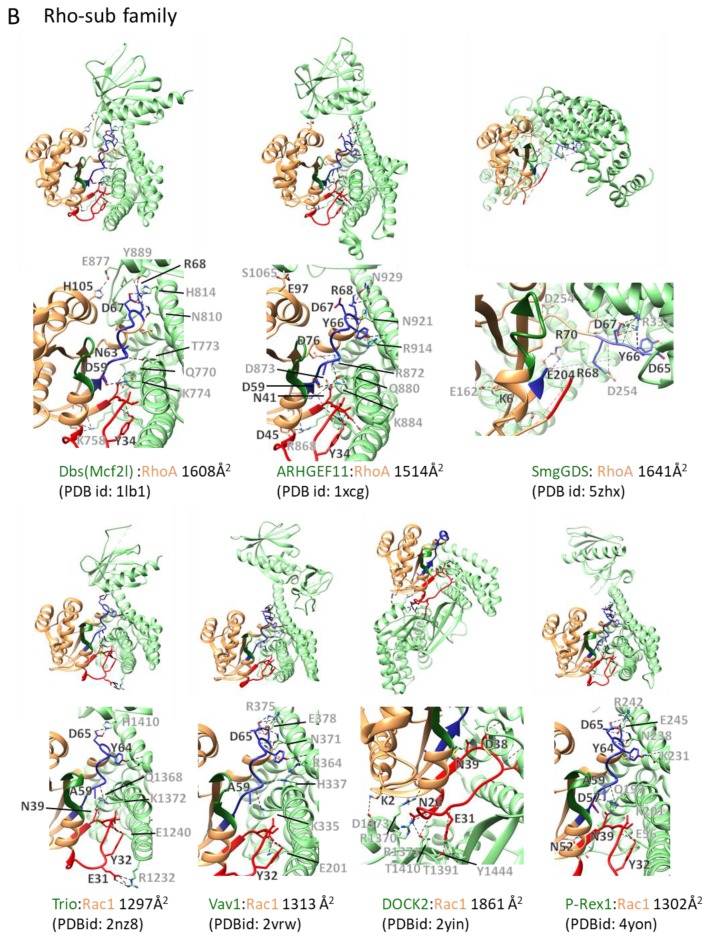
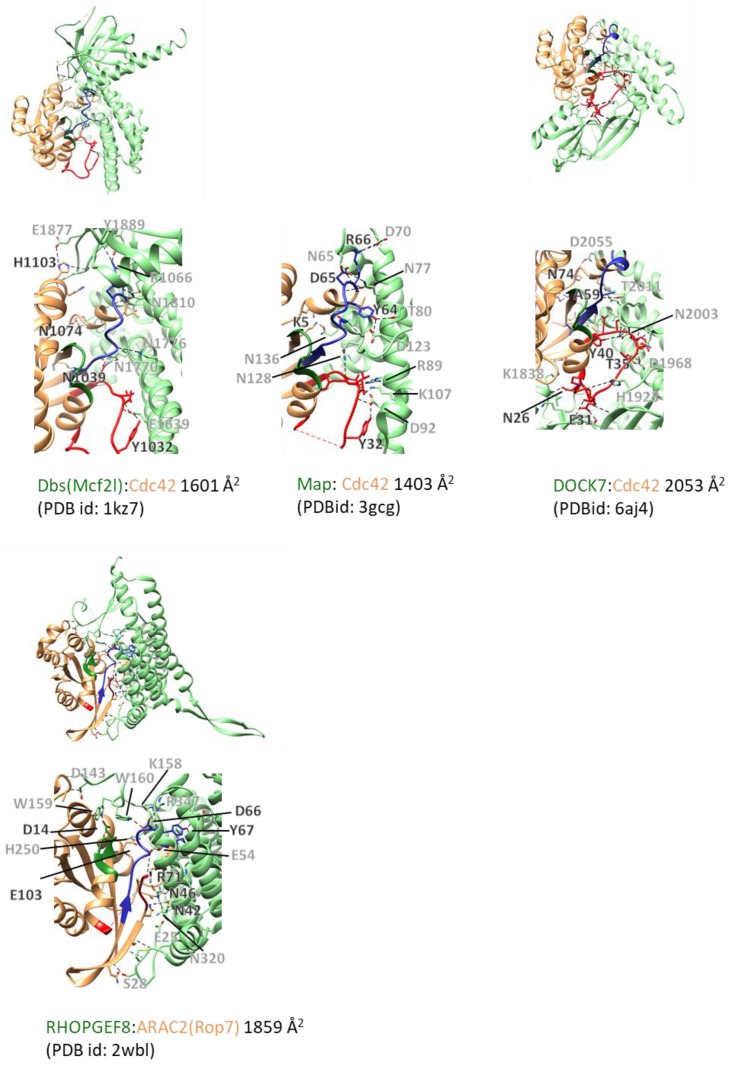
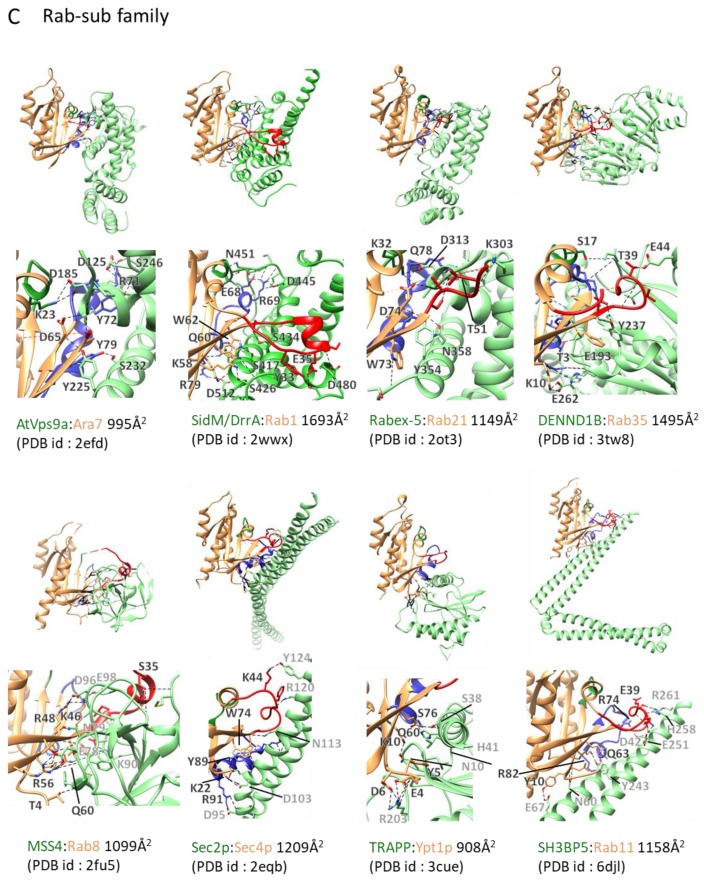
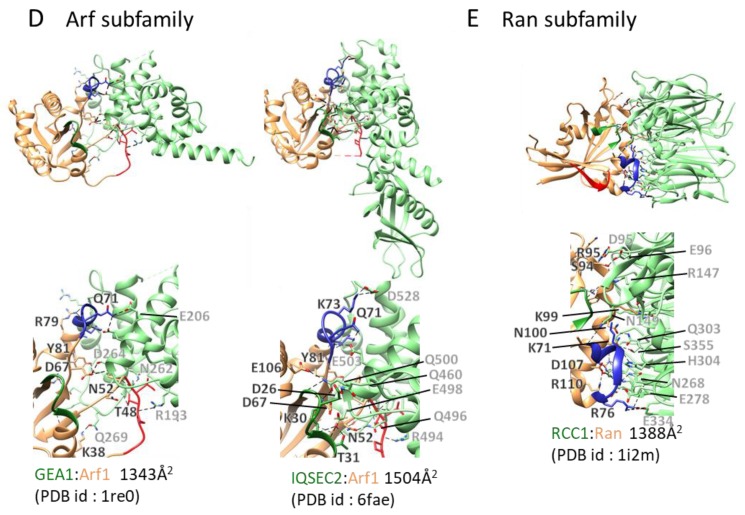
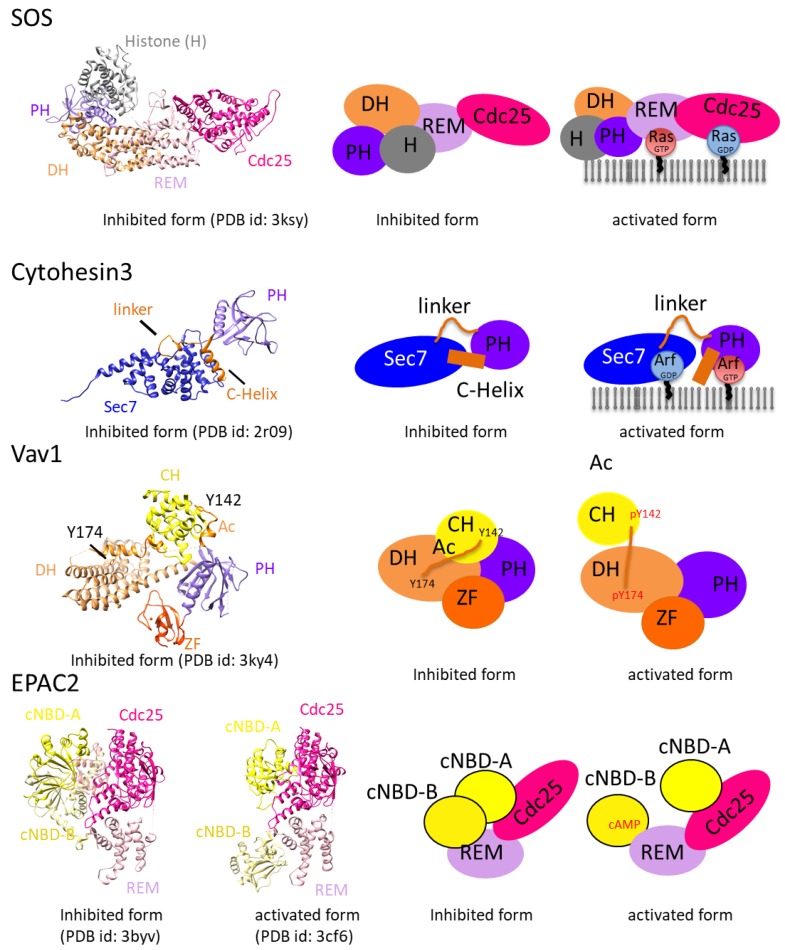
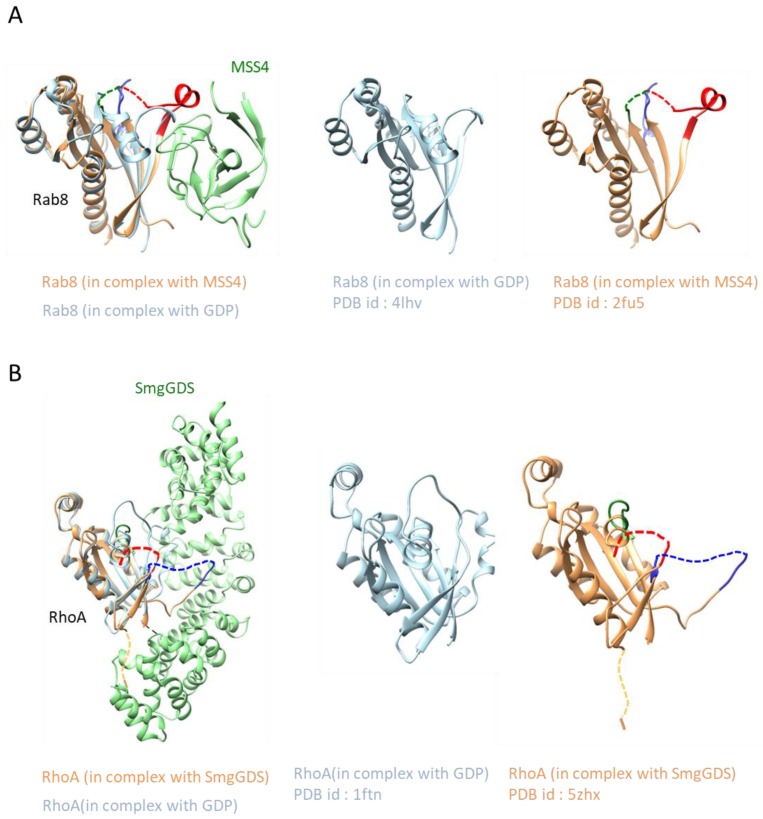
Small GTPases are key regulators of cellular events, and their dysfunction causes many types of cancer. They serve as molecular switches by cycling between inactive guanosine diphosphate (GDP)-bound and active guanosine triphosphate (GTP)-bound states. GTPases are deactivated by GTPase-activating proteins (GAPs) and are activated by guanine-nucleotide exchange factors (GEFs). The intrinsic GTP hydrolysis activity of small GTPases is generally low and is accelerated by GAPs. GEFs promote GDP dissociation from small GTPases to allow for GTP binding, which results in a conformational change of two highly flexible segments, called switch I and switch II, that enables binding of the gamma phosphate and allows small GTPases to interact with downstream effectors. For several decades, crystal structures of many GEFs and GAPs have been reported and have shown tremendous structural diversity. In this review, we focus on the latest structural studies of GEFs. Detailed pictures of the variety of GEF mechanisms at atomic resolution can provide insights into new approaches for drug discovery.

Keywords: GEF; crystal structure; local protein unfolding; regulation mechanism; small GTPases.


Conflict of interest statement

The authors declare no conflict of interest. The funders had no role in the design of the study; in the collection, analyses, or interpretation of data; in the writing of the manuscript; or in the decision to publish the results.

Figures

Figure 1
Figure 1
Regulation mechanism of small GTPases: (A) Schematic diagram of the small GTPase switching mechanism. Guanine-nucleotide exchange factors (GEFs) and GTPase-activating proteins (GAPs) enhance the exchange reaction. The guanine dissociation inhibitor (GDI) and effector are also shown. Guanosine triphosphate (GTP)-bound and guanosine diphosphate (GDP)-bound GTPases (lipidated forms) are shown as red and blue circles, respectively. GAP and GEF are shown as red and blue boxes, respectively. Several GTPase families combine their GDP/GTP switch with alternations in cytosolic/membrane localization in a process regulated by GDIs or GDI-like proteins. (B) General structural information of small GTPases. Upper: The domain architecture of H-Ras. G boxes of the G domain are highlighted with orange boxes. The hyper variable region, including a polybasic region and a CAAX motif, is highlighted with pink boxes. The P-loop, switch I, and switch II are shown as bars colored green, red, and blue, respectively. Lower: Crystal structures of GDP-bound and GTP-bound H-Ras. The P-loop, switch I, and switch II are colored green, red, and blue, respectively.
Figure 2
Figure 2
Schematic representation of GEF architecture: (A) Representative GEFs for the Ras, Rab, Arf, Ran, and Rho families are shown. Domains are defined by SMART (http://smart.embl-heidelberg.de) or Pfam (https://pfam.xfam.org/). The pink and green bars depict low complexity and coiled coils, respectively. (B) Molecular phylogenetic analysis of GEFs by the maximum likelihood method. Evolutionary analyses were conducted in MEGA7 [19]. GEF domains have been aligned to produce this phylogenetic tree.
Figure 2
Figure 2
Schematic representation of GEF architecture: (A) Representative GEFs for the Ras, Rab, Arf, Ran, and Rho families are shown. Domains are defined by SMART (http://smart.embl-heidelberg.de) or Pfam (https://pfam.xfam.org/). The pink and green bars depict low complexity and coiled coils, respectively. (B) Molecular phylogenetic analysis of GEFs by the maximum likelihood method. Evolutionary analyses were conducted in MEGA7 [19]. GEF domains have been aligned to produce this phylogenetic tree.
Figure 3
Figure 3
GEF:GTPase structures and their exchange mechanisms: (A) Upper: overall structure of the SOS1:H-Ras complex. SOS1 and H-Ras are colored green and orange, respectively. The P-loop, switch I, and switch II are colored green, red, and blue, respectively. Lower: Close up view of the active site of the SOS1:H-Ras complex: structural rearrangement is indicated by a black arrow. Key residues for exerting GEF activity are shown as stick models. The color scheme of the complex follows that of upper figure. The structure of the GDP-bound form of H-Ras, including GDP and Mg2+, is overlaid and colored in gray. (B) Upper: overall structure of the Dock9:Cdc42 complex. The structure of the GDP-bound form of Cdc42, including GTP and Mg2+, is overlaid. Lower: Close up view of the active site of the Dock9:Cdc42 complex. The color scheme and other descriptions follow those of Figure 1B.
Figure 4
Figure 4
GEF:small GTPase complex structures and their interacting interface: GEF:small GTPase complex structures in the ligand unbound forms were drawn. The color scheme and other descriptions follow those of Figure 1B. Dashed lines depict hydrogen bonds or electrostatic interactions. The interaction areas and Protein Data Bank (PDB) ids are shown. (A) Ras subfamily. (B) Rho subfamily. (C) Rab subfamily. (D) Arf subfamily. (E) Ran subfamily.
Figure 4
Figure 4
GEF:small GTPase complex structures and their interacting interface: GEF:small GTPase complex structures in the ligand unbound forms were drawn. The color scheme and other descriptions follow those of Figure 1B. Dashed lines depict hydrogen bonds or electrostatic interactions. The interaction areas and Protein Data Bank (PDB) ids are shown. (A) Ras subfamily. (B) Rho subfamily. (C) Rab subfamily. (D) Arf subfamily. (E) Ran subfamily.
Figure 5
Figure 5
Higher level regulatory mechanisms of GEFs: Positive feedback loops of Rac/RasGEF SOS and Cytohesin3, regulation of Vav1 by the PH-DH module, and regulation of EPAC2 by the second messenger. The right panels show models for each regulatory mechanism.
Figure 6
Figure 6
Local protein unfolding and refolding mechanism: (A) Structures of Rab8 in a complex with MSS4 and GDP-bound form and (B) Structures of RhoA in a complex with SmgGDS and GDP-bound form. The nucleotide recognition regions (P loop, switch I, and switch II) are almost ordered in the unbound form, but these regions are largely disordered in both proteins upon binding of the regulator. Disordered regions are shown as dashed lines. The color scheme and other descriptions follow those of Figure 1B.

References

    1. Wittinghofer A., Vetter I.R. Structure-function relationships of the G domain, a canonical switch motif. Ann. Rev. Biochem. 2011;80:943–971. doi: 10.1146/annurev-biochem-062708-134043. - DOI - PubMed
    1. Feinberg A.P., Vogelstein B., Droller M.J., Baylin S.B., Nelkin B.D. Mutation affecting the 12th amino acid of the c-Ha-ras oncogene product occurs infrequently in human cancer. Science. 1983;220:1175–1177. doi: 10.1126/science.6304875. - DOI - PubMed
    1. Vetter I.R., Wittinghofer A. The guanine nucleotide-binding switch in three dimensions. Science. 2001;294:1299–1304. doi: 10.1126/science.1062023. - DOI - PubMed
    1. Cherfils J., Zeghouf M. Regulation of small GTPases by GEFs, GAPs, and GDIs. Physiol. Rev. 2013;93:269–309. doi: 10.1152/physrev.00003.2012. - DOI - PubMed
    1. Bos J.L., Rehmann H., Wittinghofer A. GEFs and GAPs: Critical elements in the control of small G proteins. Cell. 2007;129:865–877. doi: 10.1016/j.cell.2007.05.018. - DOI - PubMed

MeSH terms

Substances

LinkOut - more resources