. 2019 Sep 11;11(9):1347.
doi: 10.3390/cancers11091347.

The miR-205-5p/BRCA1/RAD17 Axis Promotes Genomic Instability in Head and Neck Squamous Cell Carcinomas

Affiliations

The miR-205-5p/BRCA1/RAD17 Axis Promotes Genomic Instability in Head and Neck Squamous Cell Carcinomas

Fabio Valenti et al. Cancers (Basel). .

Erratum in

Abstract

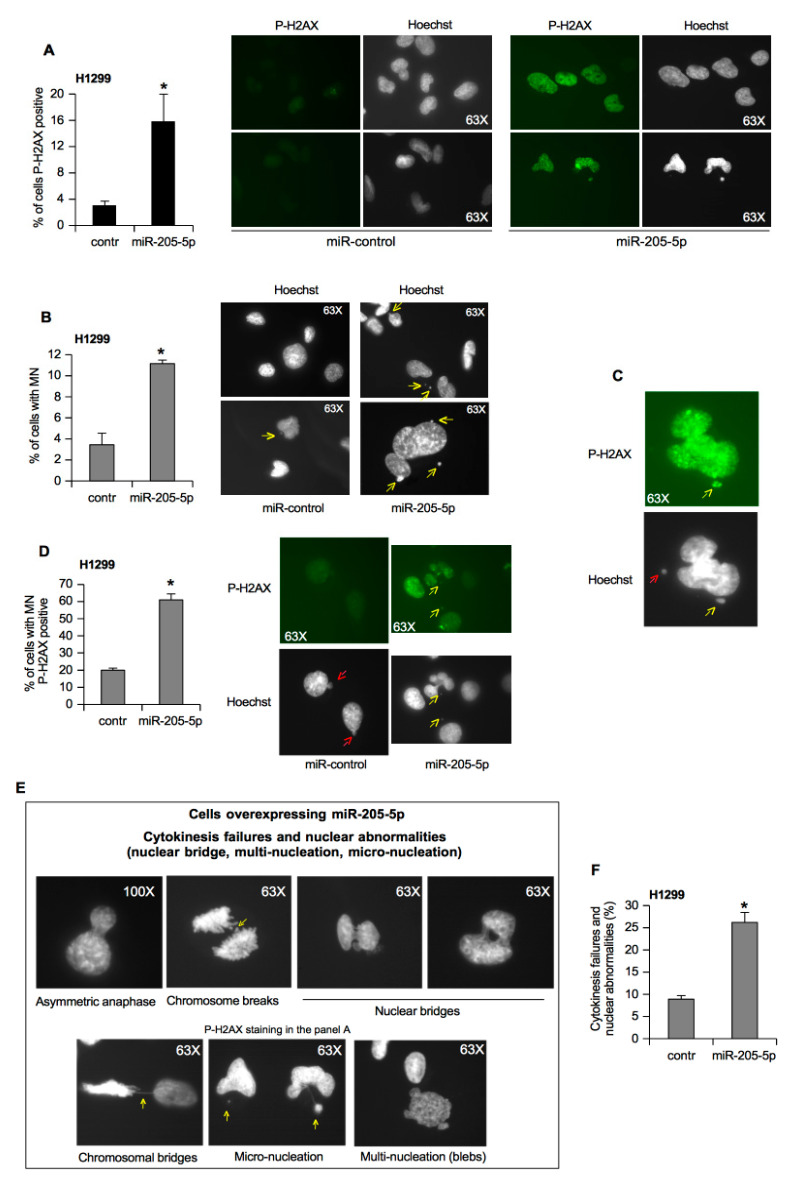
Defective DNA damage response (DDR) is frequently associated with tumorigenesis. Abrogation of DDR leads to genomic instability, which is one of the most common characteristics of human cancers. TP53 mutations with gain-of-function activity are associated with tumors under high replicative stress, high genomic instability, and reduced patient survival. The BRCA1 and RAD17 genes encode two pivotal DNA repair proteins required for proper cell-cycle regulation and maintenance of genomic stability. We initially evaluated whether miR-205-5p, a microRNA (miRNA) highly expressed in head and neck squamous cell carcinoma (HNSCC), targeted BRCA1 and RAD17 expression. We found that, in vitro and in vivo, BRCA1 and RAD17 are targets of miR-205-5p in HNSCC, leading to inefficient DNA repair and increased chromosomal instability. Conversely, miR-205-5p downregulation increased BRCA1 and RAD17 messenger RNA (mRNA) levels, leading to a reduction in in vivo tumor growth. Interestingly, miR-205-5p expression was significantly anti-correlated with BRCA1 and RAD17 targets. Furthermore, we documented that miR-205-5p expression was higher in tumoral and peritumoral HNSCC tissues than non-tumoral tissues in patients exhibiting reduced local recurrence-free survival. Collectively, these findings unveil miR-205-5p's notable role in determining genomic instability in HNSCC through its selective targeting of BRCA1 and RAD17 gene expression. High miR-205-5p levels in the peritumoral tissues might be relevant for the early detection of minimal residual disease and pre-cancer molecular alterations involved in tumor development.

Keywords: DNA repair; HNSCC; genomic instability; miRNA; mutant p53.


Conflict of interest statement

The authors declare that they have no competing interests.

Figures

Figure 1
Figure 1
MicroRNA (MiR)-205-5p targets BRCA1 and RAD17 DNA repair genes. (A) Schematic model representing the different levels of BRCA1 and RAD17 gene expression inhibition orchestrated by the mutant p53 protein (mutp53)/miR-205-5p axis. (B) A253 cells transfected with mimic control and mimic miR-205-5p oligos are analyzed for miR-205-5p expression using a Taq-Man assay. The RNA levels were normalized versus RNU49. Bars represent the mean ± SD from three biological replicates. The p-values were calculated using a two-tailed t-test. * p < 0.05. (C) Representative Western blotting of BRCA1, RAD17, and GAPDH (loading control) protein expression in A253 cells treated as described in (B). (D) Representation of the pairing between miR-205-5p and the 3’ UTR (untraslated region) of its putative messenger RNA (mRNA) targets, BRCA1 and RAD17 mRNAs. (E) Activity for RAD17 3’ UTR and BRCA1 3’ UTR luciferase reporter vectors and mutated RAD17 3’ UTR and BRCA1 3’ UTR were determined after 48 h of transfection with mimic control and mimic miR-205-5p oligos in A253 cells. The results derived from three independent experiments. Bars represent the mean ± SD from three biological replicates. The p-values were calculated with a two-tailed t-test. Significant p-values are indicated as * p < 0.05. (F) MiR-205-5p expression was analyzed by a Taq-Man assay from CAL27 cells transfected with LNA (locked nucleic acid) control and LNA miR-205-5p oligos. The expression was normalized versus RNU49. Bars represent the mean ± SD from three biological replicates. The p-values were calculated with a two-tailed t-test. * p < 0.05. (G) Luciferase activity for RAD17-3’ UTR-pGL3 and BRCA1-3’ UTR-pGL3 plasmids and mutated RAD17 3’ UTR and BRCA1 was determined after 48 h of transfection with LNA control and LNA miR-205-5p oligos in CAL27 cells. The results derived from three independent experiments. Bars represent the mean ± SD from three biological replicates. The p-values were calculated with a two-tailed t-test. Significant p-values are indicated. * p < 0.05. (H) Western blotting of BRCA1, RAD17, and GAPDH (loading control) protein expression in CAL27 cells transfected with either LNA control or LNA miR-205-5p. (I). RIP (RNA Immuno Precipitation) assays performed in control and miR-205-5p overexpressing A253 cells using antibodies directed to Ago2 protein. RNA abundance of Ago2 was evaluated by RT-qPCR and normalized over GAPDH mRNA and over IgG as negative control; a representative experiment of a biological duplicate is shown.
Figure 2
Figure 2
Inhibition of miR-205-5p impairs the tumoral features of head and neck squamous cell carcinoma (HNSCC) cell lines. (A) CAL27 cells transiently transfected with LNA miR-205-5p or LNA control at the indicate time points were subjected to label-free assays, and the ATP levels are expressed as relative light units (RLUs). Values are the mean ± SD obtained from two separate experiments, each plated in quintuplicate. A two-tailed t-test was used to calculate the p-values: * p < 0.05 versus the control sample. (B) CAL27 cells transfected for 48 h with LNA control and LNA miR-205-5p oligos were incubated with PI staining solution and analyzed by flow cytometry. The percentage of cells (%) in different phases are shown. Data are presented as the mean ± SD of three independent experiments; * p < 10−5, ** p < 10−8. (C) Cells treated the same as in (B) were incubated for 20 min with BrdU. The BrdU-positive cells were scored by immunofluorescence staining, and total cells were counted under transmission light. Data are expressed as the mean percentage of BrdU-positive cells ± SD. (D) CAL27 cells transfected with LNA control and LNA miR-205-5p were subjected to the colony formation assay. All the values are the mean ± SD of six replicates from three independent experiments. Analysis of the colonies was performed using the ImageJ software. (E) Representative images of CAL27 cells from the transwell migration assay by the Boyden chamber. Data represent the mean ± SD from three biological replicates; each point was repeated in technical quadruplicates. The p-values were calculated with a two-tailed t-test. All p-values were calculated with a two-tailed t-test and were higher than the significance level of 0.05. (F) RNA from CAL27 3D cells transfected with LNA control and LNA miR-205-5p oligos was evaluated for miR-205-5p expression by a Taq-Man assay. The expression was normalized using RNU49. Bars represent the mean ± SD from three biological replicates. The p-values were calculated with a two-tailed t-test. (G) Bright-field representative images of CAL27 transfected for 48 h with the indicated LNA oligos and grown for 10 days in a three-dimensional (3D) cell culture using a matrix alginate hydrogel (32× objective). (H) Representative image of dot blot assay: 2 ug of whole-protein lysates extracted from CAL27 3D culture described in (F) and (G) were dotted onto a nitrocellulose membrane and immunostained for BRCA1, RAD17, Ki67, and Actin (loading control) protein expression.
Figure 3
Figure 3
MiR-205-5p expression impairs DNA repair activity. (A) H1299 cell lines transfected with mimic control and mimic miR-205-5p were analyzed for the amount of damaged DNA by comet assay using the alkali method. The extent of DNA damage is related to the amount of DNA in the tail. The percentage of DNA in the tail is reported as a box-plot in the higher panels of each figure. About 100 cells were counted for each sample. In all box-plots, the black box is the 25th percentile (first quartile) and the gray box is the 75th percentile (third quartile), while the black band is the median (second quartile). The p-values were calculated with a two-tailed t-test. Statistically significant results had a p-value <0.05. (B) Representative Western blotting of P-H2AX and GAPDH (loading control) protein expression in H1299 cells transfected as described in (A). (C) CAL27 cells transfected with LNA control and LNA miR-205-5p were analyzed for the amount of DNA damaged by comet assay using the alkali method. Analysis was performed as described in (A). (D) Representative immunoblotting analysis of P-H2AX and GAPDH (loading control) protein expression in CAL27 cells transfected as described in (C). (E) DNA repair products after 16 h of incubation at 17 °C with cellular extracts of CAL27 cells transiently transfected with LNA control (lane 2) and LNA miR-205-5p (lane 3) oligos. Lane 1: reaction buffer mixture with HindIII-cut plasmid. DNA bands include the following: L, linear DNA; D, dimer; T, trimer; HM, high multimer. Numbers indicate the lanes. M is the DNA ladder. (F and G) CAL27 cells were transiently transfected with pSI-CHECK2 plasmid cut using ApaI (F) and with either LNA control or LNA miR-205-5p oligos as indicated in the figures (G). Then, 48 h after transfection, the cells were harvested, and the DNA repair was assessed measured by firefly luciferase activity. Columns, means from two independent assays each done in triplicate; bars, SD. The p-values were calculated with a two-tailed t-test. Statistically significant results had a p-value <0.05. (H) Representative immunoblotting analysis of BRCA1, RAD17, and GAPDH (loading control) protein expression in CAL27 protein cell extracts used in (G). Anti-BRCA1 and anti-RAD17 antibodies were used in the same hybridization solution. (I) CAL27 cells were transiently transfected with ApaI-linearized pSI-CHECK2 vector and LNA miR-205-5p (LNAmiR), siRAD17, and siBRCA1 oligos in different combinations as indicated in the figures (I). The control sample (contr) involved CAL27 cells transfected with LNA control and siGFP oligos. Then, 48 h after transfection, the cells were harvested, and the functional changes in DNA repair were assessed measuring the firefly luciferase activity. The p-values were calculated with a two-tailed t-test. Statistically significant results had a * p < 0.05.
Figure 4
Figure 4
MiR-205-5p involvement in genomic instability. (A) H1299 cells were transfected with mimic miR-205-5p and mimic control oligos. Subsequently, cells were stained for P-H2AX 48 h after miR-205-5p and mimic control oligo overexpression. Representative images and quantification of unrepaired double-strand breaks (DSBs) are shown. Hoechst was used for nuclear staining. The p-values were calculated with a two-tailed t-test. Statistically significant results had a p-value <0.02 (*). Data represent the mean ± SD from three biological replicates. (B) H1299 cells overexpressing miR-205-5p and a mimic control were observed on the basis of micronuclei (yellow arrows). The percentage of 500 cells scored by each point is reported. The p-values were calculated with a two-tailed t-test. Statistically significant results had a p-value <0.02 (*). Data represent the mean ± SD from three biological replicates. (C) Examples of micronuclei (MN)-P-H2AX (+) (yellow arrow) and MN-P-H2AX (−) (red arrow) in H1299 cells. Cells were grown on coverslips in six-well plates 48 h before they were processed for immunofluorescence staining with anti-P-H2AX antibody. (D) H1299 cells overexpressing miR-205-5p and a mimic control are represented on the basis of MN-P-H2AX (+) (yellow arrow) and MN-P-H2AX (−) (red arrow). The percentage of 500 cells scored by each point is reported. The p-values were calculated with a two-tailed t-test. Statistically significant results had a p-value <0.05 (*). Data represent the mean ± SD from three biological replicates. (E) Chromosomal abnormalities in H1299 cells overexpressing miR-205-5p. The arrows in different representative images indicate conspicuous chromatin bridges between cells in anaphase or telophase, loss of chromosomal material, nuclear bridges, and blebs. (F) The percentage of 500 cells scored by three biological replicates of H1299 cells overexpressing miR-205-5p is reported. The p-values were calculated with a two-tailed t-test. Statistically significant results had a p-value <0.02 (*). Data represent the mean ± SD.
Figure 5
Figure 5
Intratumoral injections of miR-205-5p inhibitor downsize established HNSCC xenografts. (A) Schematic overview of in vivo experiments performed on orthotopic HNSCC. The tumor growth was monitored with the aid of a caliper. Mice assigned to the treatment and control groups were treated three times with miR-205-5p inhibitors or corresponding control oligonucleotides every three days; N = 6 mice in each group. In each panel, p-values were calculated by a two-sample t-test. (B) A total of 106 CAL27 cells in 30% matrigel were subcutaneously injected into immunodeficient Balb/C mice. On days 3, 6, 9, and 12 following mice allocation, synthetic LNA miR-205-5p inhibitor or control miRNAs conjugated with the Invivofectamine® 3.0 transfection reagent were intratumorally delivered into groups of six animals. Caliper measurements were taken to determine the length and width of each tumor and to calculate total tumor volumes. (C) Immunohistochemical analysis of Ki67 protein expression was analyzed in six LNA control- and LNA miR-205-5p-treated mice. Representative images and the relative quantification of ki67 positive cells are shown. (D) Tumor weight of the excised tumors measured at the end of the experiment. (E) Tumor volumes measured at the end of the experiment. (F) Relative miR-205-5p expression in CAL27 tumors. Total RNA was extracted from tumors harvested at the end of the experiment, and RT-qPCR was performed using a specific probe for miR-205-5p (Taq-Man assay). The normalization was carried out using RNU49 throughout the standard curve method. The p-values were calculated by a two-sample t-test; significant results are marked by a p-value <0.05. (G,H) Immunohistochemistry on tumors treated with LNA control and LNA miR-205-5p. Sections from each mouse were incubated with an anti-BRCA1 antibody (G) and anti-RAD17 antibody (H). Representative fields are shown.
Figure 6
Figure 6
Tumoral and histologically tumor-free peritumoral tissue is associated with a high expression of miR-205-5p in HNSCC patients. (A) Kaplan–Meier survival curve and log-rank test for 121 HNSCC patients showing recurrence-free survival (RFS). High and medium expression of miR-205-5p was associated with significantly decreased RFS (p = 0.003) in HNSCC. (B) Box-plot analysis representing the association of miR-205-5p expression levels with the tumoral (T) and non-tumoral (N) tissues from the HNSCC cohort of IRCSS Regina Elena National Cancer Institute of Rome. The expression of miR-205-5p was measured by RT-qPCR in complementary DNA (cDNA) obtained from each non-tumoral and matched tumoral tissues. The 63 matched samples include tumors carrying missense mutations in TP53 (mutp53, n = 32) and tumors with wild-type TP53 (WTp53, n = 31). (C) Box-plot analysis representing the association of miR-205-5p expression levels within the following sub-groups of 42 matched samples from TCGA: mutant p53 (tumors carrying mutations in TP53 (n = 31)); wt p53 (tumors with wild-type TP53 (n = 11)). (D) Kaplan–Meier survival curve and log-rank test for 57 TCGA HNSCC patients showing recurrence-free survival (RFS). Low expression of the RAD17/BRCA1 signature was associated with significantly decreased RFS (p = 0.019) in HNSCC. Box plots showing the miR-205-5p expression differentially expressed between 66 peritumoral (PT) tissues and their normal counterparts (p < 0.05) (E) and between 66 tumoral tissues and their peritumoral matched tissues (F). (G) Kaplan–Meier (KM) analysis showed the correlation between miR-205-5p expression and RFS in tumor and peritumoral tissues. KM analyses were performed through creating four groups of patients: patients with high expression of miRNA for both tissues (tumor and peritumor), patients with high expression in tumor and low expression in peritumor and the contrary, and patients with low expression in both tissues. The p-value was calculated for the two subgroups expressing high and low levels of miR-205-5p in both tissues (tumor and peritumor). (H) Box-plot representing the expression of 227 genes positively (mRNAs-PCm) and 145 genes negatively (mRNAs-NCm) correlated with miR-205-5p expression and differentially expressed between tumoral and peritumoral tissues and their normal counterparts (p < 0.05) in 22 tumoral, peritumoral, and non-tumoral matched tissues of the IRE cohort [30]. (I) Schematic representation showing two parallel mechanisms through which mutant p53 is able to counteract BRCA1 and RAD17 gene expression. (a) MiR-205-5p is induced by mutp53 gain-of-function (GOF) activity in HNSCC cancer cells [18]. (b) High levels of miR-205-5p target BRCA1 and RAD17 mRNAs downregulating their protein expression. (c) In parallel, mutp53 forms a complex with the E2F4 repressor factor and, via binding BRCA1 and RAD17 promoters onto the E2F4 repressive consensus sequences, is able to inhibit their transcription [20]. All these activities contribute to reinforcing aberrant mechanisms, resulting in an increase in genomic instability of HNSCC tumors.

Similar articles

Cited by

References

    1. Jackson S.P., Bartek J. The DNA-damage response in human biology and disease. Nature. 2009;461:1071–1078. doi: 10.1038/nature08467. - DOI - PMC - PubMed
    1. Negrini S., Gorgoulis V.G., Halazonetis T.D. Genomic instability-an evolving hallmark of cancer. Nat. Rev. Mol. Cell Biol. 2010;11:220–228. doi: 10.1038/nrm2858. - DOI - PubMed
    1. Halazonetis T.D., Gorgoulis V.G., Bartek J. An oncogene-induced DNA damage model for cancer development. Science. 2008;319:1352–1355. doi: 10.1126/science.1140735. - DOI - PubMed
    1. Sigal A., Rotter V. Oncogenic mutations of the p53 tumor suppressor: The demons of the guardian of the genome. Cancer Res. 2000;60:6788–6793. - PubMed
    1. Muller P.A., Vousden K.H. p53 mutations in cancer. Nat. Cell Biol. 2013;15:2–8. doi: 10.1038/ncb2641. - DOI - PubMed