Review
. 2019 Sep 12;17(1):71.
doi: 10.1186/s12915-019-0682-0.

Genetic voltage indicators

Affiliations
Review

Genetic voltage indicators

Yuki Bando et al. BMC Biol. .

Abstract

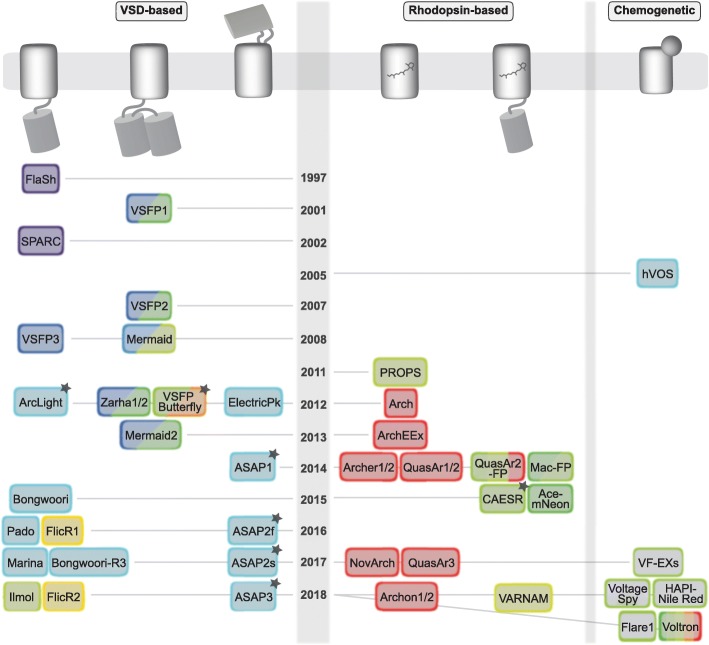
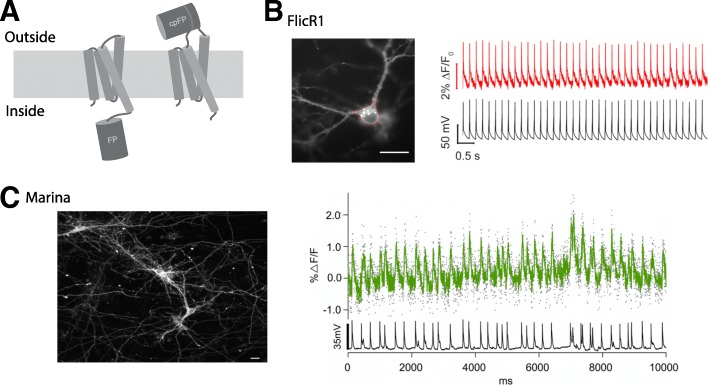
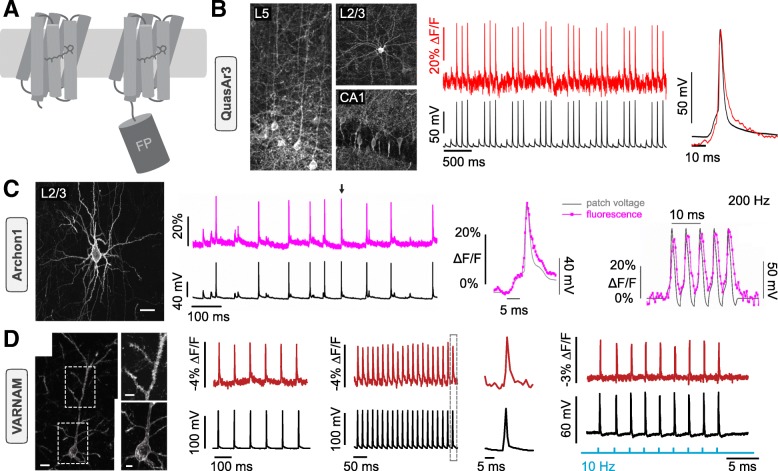
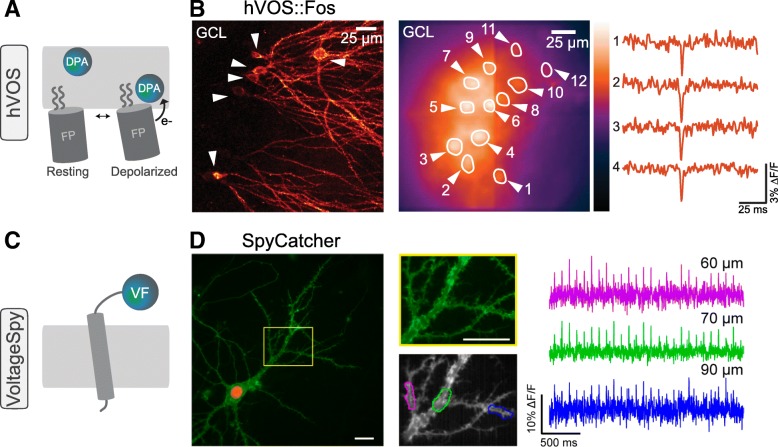
As a "holy grail" of neuroscience, optical imaging of membrane potential could enable high resolution measurements of spiking and synaptic activity in neuronal populations. This has been partly achieved using organic voltage-sensitive dyes in vitro, or in invertebrate preparations yet unspecific staining has prevented single-cell resolution measurements from mammalian preparations in vivo. The development of genetically encoded voltage indicators (GEVIs) and chemogenetic sensors has enabled targeting voltage indicators to plasma membranes and selective neuronal populations. Here, we review recent advances in the design and use of genetic voltage indicators and discuss advantages and disadvantages of three classes of them. Although genetic voltage indicators could revolutionize neuroscience, there are still significant challenges, particularly two-photon performance. To overcome them may require cross-disciplinary collaborations, team effort, and sustained support by large-scale research initiatives.


Conflict of interest statement

The authors declare that they have no competing interests.

Figures

Fig. 1
Fig. 1
Historical overview of genetic voltage indicators. Sensors fall into three distinct families based on voltage sensing domains (VSD; left), microbial rhodopsins (middle), or chemogenetic probes (right) and are arranged chronologically according to year of first report. Color of the box refers to the activation wavelength reported in the paper or inferred from the spectrum of the fluorescent protein. Black stars denote reported two-photon measurements. Note that HAPI-Nile Red and Voltron are also rhodopsin-based. See text for references
Fig. 2
Fig. 2
Recent VSD-based GEVIs. a Schematic drawing of two configurations of VSD-based GEVIs. Left: VSD fusion with intracellular fluorescent protein (FP). Right: VSD insertion with extracellular circularly permuted FP. b Left: Expression of FlicR1, a red-shifted indicator with flipped polarity, in dissociated hippocampal neuron. Right: optical (red) and electrical (black) responses to action potentials at 5 Hz, recorded with one-photon imaging. Modified with permission from [43]. c Left: Expression of Marina, a green indicator with flipped polarity in cultured hippocampal neurons. Right: Spontaneous spiking activity in a cortical neuron from an acute brain slice recorded with one-photon imaging. Modified from [44] with permission
Fig. 3
Fig. 3
Recent rhodopsin-based GEVIs. a Representation of two kinds of rhodopsin-based GEVIs with PROPS type GEVI (left) and eFRET-based GEVI (right). b Left: Confocal images of QuasAr3 expression in brain slices; bar 50 μm. Middle: Patch-clamp recordings (black) with corresponding fluorescence traces (red) in acute brain slices. Right: overlay of electrical and optical signal for a single AP. Modified with permission from [55]. c Left: Expression of Archon1 in acute brain slices; bar 25 μm. Middle: Archon1 fluorescence (pink; single trial) and related electrical traces (black) in cultured cells with overlay of both signals for the AP indicated by the arrow. Right: Fluorescence changes (single trial) of Archon 1 following action potential-like voltage changes (black) of 200 Hz in a voltage-clamped neuron in culture. Modified with permission from [57]. d Left: Confocal image of VARNAM expression in pyramidal neurons in fixed postnatal brain slices. Middle: Concurrent optical (red) and electrical recordings (black) evoked by 10 Hz (left) and 50 Hz (right) current injections with overlay of both signals for indicated AP. Right: Changes in membrane potential driven by activation of the channelrhodopsin Cheriff (blue) monitored electrically (black) and optically (red). Modified with permission from [44]
Fig. 4
Fig. 4
Chemogenetic voltage indicators. a Schematic representation of hVOS, consisting of a fluorescent protein anchored to the plasma membrane, combined with a non-fluorescent synthetic compound dipicrylamine (DPA), which serves as a voltage-sensitive FRET acceptor. b Cellular resolution voltage imaging with hVOS. Hippocampal slices from hVOS::Fos mouse expressing hVOS probe in granule cells in a Cre-Fos-dependent manner. Left: Fluorescence in brain sections after crossing Ai35-hVOS with Cre-Fos mice showing hVOS-expressing neurons in the granule cell layer of the hippocampus. Right: Response in four neurons in a hippocampal slice from an hVOS::Fos mouse to electrical stimulation. c Schematic representation of VoltageSpy, consisting of the expression of SpyCatcher on the cellular surface and the subsequent extracellular interaction with the VF dye. d Subcellular voltage imaging with VoltageSpy. Cultured hippocampal neurons co-expressing SpyCatcher and nuclear mCherry and labeled with VoltageSpy were captured at 500 Hz under widefield fluorescence microscopy. Left: VoltageSpy is shown in green and nuclear staining in red. Middle: Higher magnifications of selected dendritic regions. Scale bar 20 μm. Right: Voltage imaging in dendrites showing evoked action potentials in selected ROIs, coded by colors indicated in the panel. Images and traces modified with permission from [69] (b) and [82] (d)

References

    1. Grynkiewicz G, Poenie M, Tsien RY. A new generation of Ca2+ indicators with greatly improved fluorescence properties. J Biol Chem. 1985;260:3440–3450. - PubMed
    1. Yuste R, Katz LC. Control of postsynaptic Ca2+ influx in developing neocortex by excitatory and inhibitory neurotransmitters. Neuron. 1991;6:333–344. doi: 10.1016/0896-6273(91)90243-S. - DOI - PubMed
    1. Grienberger C, Konnerth A. Imaging calcium in neurons. Neuron. 2012;73:862–885. doi: 10.1016/j.neuron.2012.02.011. - DOI - PubMed
    1. Yuste R, Denk W. Dendritic spines as basic units of synaptic integration. Nature. 1995;375:682–684. doi: 10.1038/375682a0. - DOI - PubMed
    1. Smetters D, Majewska A, Yuste R. Detecting action potentials in neuronal populations with calcium imaging. Methods (San Diego, Calif) 1999;18:215–221. doi: 10.1006/meth.1999.0774. - DOI - PubMed

Publication types

MeSH terms