. 2019 Sep 13;20(1):355.
doi: 10.1186/s12882-019-1540-6.

TRPP2 dysfunction decreases ATP-evoked calcium, induces cell aggregation and stimulates proliferation in T lymphocytes

Affiliations

TRPP2 dysfunction decreases ATP-evoked calcium, induces cell aggregation and stimulates proliferation in T lymphocytes

Riccardo Magistroni et al. BMC Nephrol. .

Abstract

Background: Autosomal dominant polycystic kidney disease (ADPKD) is mainly characterised by the development and enlargement of renal cysts that lead to end-stage renal disease (ESRD) in adult patients. Other clinical manifestations of this pathology include hypertension, haematuria, abdominal pain, cardiovascular system alterations and intracranial aneurysms. ADPKD is linked to mutations in either PKD1 or PKD2 that codifies polycystin-1 (PC1) and polycystin-2 (PC2 or TRPP2), respectively. PC1 and TRPP2 are membrane proteins that function as receptor-channel elements able to regulate calcium homeostasis. The function of polycystins has been mainly studied in kidney cells; but the role of these proteins in T lymphocytes is not well defined.

Methods: T lymphocytes were produced from ADPKD1 and ADPKD2 patients as well as from non-ADPKD subjects undergoing renal replacement therapy (RRT) and healthy controls. Protein expression and phosphorylation levels were analysed by western blotting, cell proliferation was calculated by direct counting using trypan blue assay and intracellular calcium concentration was measured by Fura-2 method.

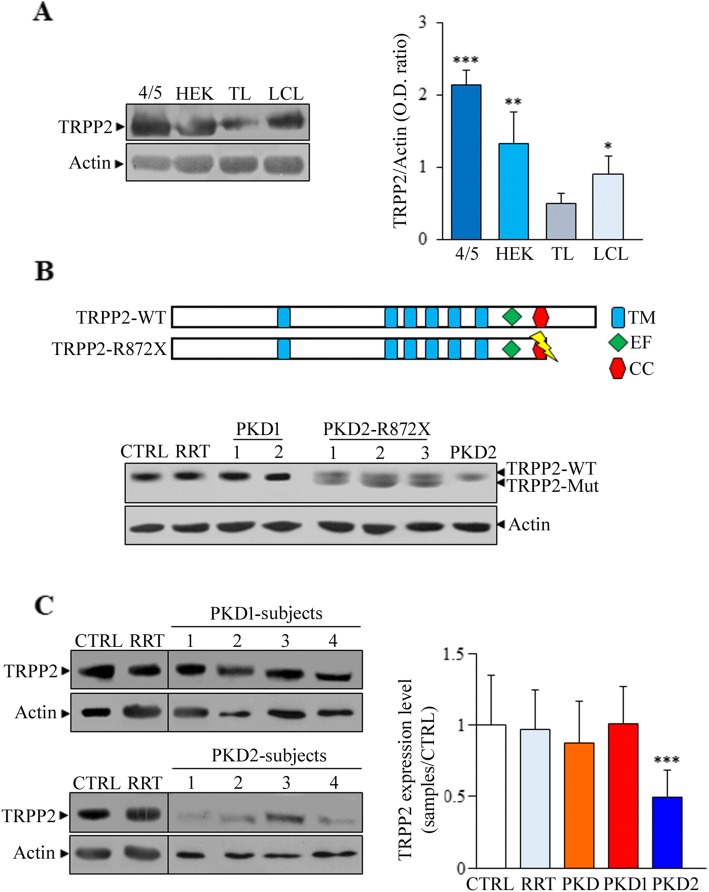
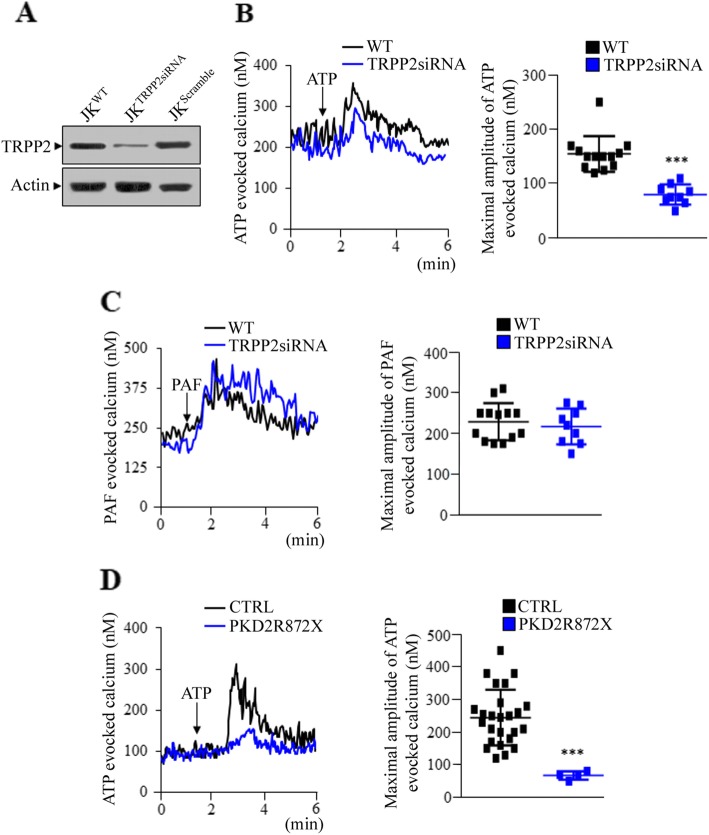
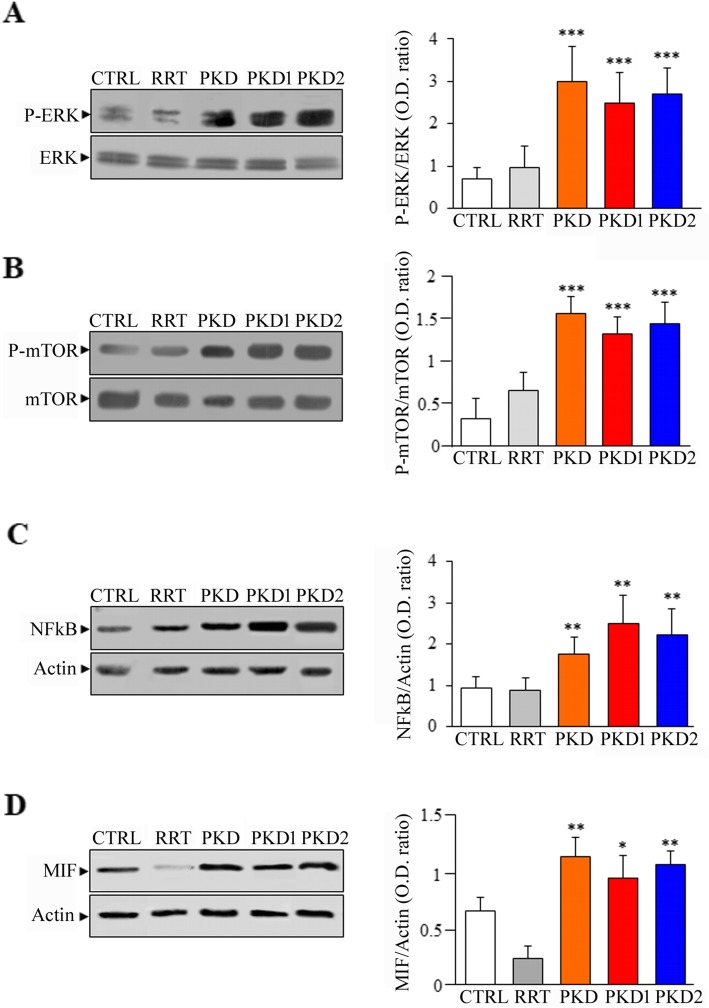
Results: PKD2 mutations lead to the significant reduction of TRPP2 expression in T lymphocytes derived from ADPKD patients. Furthermore, a smaller TRPP2 truncated protein in T lymphocytes of patients carrying the mutation R872X in PKD2 was also observed, suggesting that TRPP2 mutated proteins may be stably expressed. The silencing or mutation of PKD2 causes a strong reduction of ATP-evoked calcium in Jurkat cells and ADPKD2 T lymphocytes, respectively. Moreover, T lymphocytes derived from both ADPKD1 and ADPKD2 patients show increased cell proliferation, basal chemotaxis and cell aggregation compared with T lymphocytes from non-ADPKD subjects. Similarly to observations made in kidney cells, mutations in PKD1 and PKD2 dysregulate ERK, mTOR, NFkB and MIF pathways in T lymphocytes.

Conclusions: Because the alteration of ERK, mTOR, NFkB and MIF signalling found in T lymphocytes of ADPKD patients may contribute to the development of interstitial inflammation promoting cyst growth and kidney failure (ESRD), the targeting of inflammasome proteins could be an intriguing option to delay the progression of ADPKD.

Keywords: ADPKD; Calcium; ERK; NFkB; T lymphocytes; TRPP2; mTOR.


Conflict of interest statement

The authors declare that they have no competing interests.

Figures

Fig. 1
Fig. 1
Analysis of TRPP2 in normal and ADPKD cells by Western blotting. a TRPP2 is expressed in two different normal kidney cell lines (4/5 and HEK293) as well as in T and B lymphocytes generated by healthy controls (TL and LCL, respectively). TRPP2 expression, is lower in T lymphocytes compared with the other cell types (0.49 ± 0.12 for TL, 0.89 ± 0.21 for LCL, 1.31 ± 0.36 for HEK and 2.14 ± 0.16 for 4/5 cells. TL vs LCL, HEK and 4/5: * p < 0.05, ** p < 0.01 and *** p < 0.001, respectively). Data represent the mean ± standard deviation obtained from two different experiments in duplicate. Statistical significance was calculated by using the unpaired t-test. b T lymphocytes derived from ADPKD2 subjects carrying R872X mutation synthesise a stable truncated protein detectable by Western blotting. TM = transmembrane domain; EF = EF hand domain; CC = coiled coil motif. c TRPP2 expression is lower in T lymphocytes of ADPKD2 subjects compared with non-genetically defined ADPKD, ADPKD1 and control subjects (0.50 ± 0.18 in PKD2, 1.01 ± 0.26 in PKD1, 0.88 ± 0.29 in PKD, 0.97 ± 0.28 in RRT and 1.0 ± 0.35 in CTRL cells. PKD2 vs CTRL: ***p < 0.001). CTRL = healthy controls (n = 10); RRT = non-ADPKD subjects undergoing renal replacement therapy (n = 14); PKD = non-genetically defined ADPKD subjects (n = 12); PKD1 = ADPKD1 subjects (n = 11); PKD2 = ADPKD2 subjects (n = 16).TRPP2 values were calculated as ratio between the band intensity of TRPP2 and β-actin. Bars of graph C represent the values of TRPP2 (mean ± standard deviation) calculated as ratio between TRPP2 levels of different samples and the average of those obtained from healthy controls (CTRL). The values of TRPP2 and PC1 expression in analysed ADPKD subjects and controls are inserted in Additional file 2: Table S2
Fig. 2
Fig. 2
Analysis of ATP- and PAF-evoked calcium in TRPP2 silenced Jurkat cells and ADPKD2 subjects currying the R872X mutation. a The expression of TRPP2 was evaluated by Western blotting in wild type Jurkat cells and transfected with TRPP2-siRNA plasmid or with scramble sequences. The calcium levels were measured after ATP (b) or PAF (c) stimulation in control (WT) and in PKD2 silenced (TRPP2-siRNA) Jurkat cells by Fura 2-AM method. The application of 100 μM ATP causes a significant reduction of cytosolic calcium release in TRPP2 silenced cells compared with control cells (80.1 ± 18.4 for TRPP2-siRNA and 154.9 ± 32.7 for WT: ***p < 0.001). No significant differences in calcium release between control and TRPP2 silenced Jurkat cells after 2 μM PAF stimulation were observed. For both ATP- and PAF-evoked calcium were performed 13 and 9 measurements in WT and TRPP2siRNA Jurkat cells, respectively. d The intracellular calcium release after ATP stimulation is lower in T lymphocytes of ADPKD2 subjects currying the R872X mutation than in CTRL (67.5 ± 12.58 for PKD2-R872X and 244.8 ± 85.5 for CTRL: ***p < 0.001). The maximal calcium concentration after ATP or PAF stimulation was calculated as Δ (delta) obtained from the maximal value minus the basal one. Data are expressed as mean ± standard deviation calculated from at least two different experiments in duplicate, while for PKD2-R872X T lymphocytes values represent the mean ± standard deviation of two experiments. PKD2-R872X = ADPKD2 subjects currying R872X mutation (n = 4). CTRL = healthy controls (n = 25). Data of ATP- and PAF-evoked calcium detected in WT and PKD2 silenced Jurkat cells are inserted in Additional file 2: Table S2
Fig. 3
Fig. 3
Analysis of intracellular calcium release, cell aggregation, chemotactic index and cell proliferation in normal and ADPKD T lymphocytes. a ATP-evoked calcium is lower in T lymphocytes of ADPKD2 patients compared with non-genetically defined ADPKD, ADPKD1 and control subjects (73.67 ± 13.02 for PKD2 and 244.8 ± 85.51 for CTRL: ***p < 0.001). CTRL (n = 25), RRT (n = 19), PKD (n = 44), PKD1 (n = 26) and PKD2 (n = 15). b No changes in PAF-evoked calcium release were observed among controls and ADPKD T lymphocytes. CTRL (n = 24), RRT (n = 17), PKD (n = 49), PKD1 (n = 24) and PKD2 (n = 14). The maximal calcium concentration in response to ATP or PAF in T lymphocytes was calculated as described in Fig. 2. c ADPKD T lymphocytes form clamps greater in size as compared with those of control (190 ± 68 for PKD2, 143 ± 14 for PKD1, 141 ± 28 for PKD and 91 ± 15 for control cells. PKD and PKD1 vs. CTRL: *p < 0.05, PKD2 vs. CTRL: ***p < 0.001). Images were acquired by using an inverted phase-contrast microscope equipped with a CCD camera. d In basal conditions, ADPKD T lymphocytes show a greater chemotactic index compared with control cells (0.75 ± 0.1 for PKD and 0.53 ± 0.1 for CTRL: ***p < 0.001). e After 48 h of culture, ADPKD T lymphocytes grew faster than control cells (87,725 ± 27,173 for PKD and 58,003 ± 14,467 for CTRL: ***p < 0.001). CTRL = healthy controls; RRT = non-ADPKD subjects undergoing renal replacement therapy; PKD = non-genetically determined subjects; PKD1 = PKD1-related subjects; PKD2 = PKD2-related subjects. Data are expressed as mean ± standard deviation calculated from at least two different experiments in duplicate. All values of calcium measurements after ATP and PAF stimulation in control and ADPKD T lymphocytes are shown in Additional file 2: Table S2
Fig. 4
Fig. 4
Analysis of p-ERK, p-mTOR, NFkB and MIF expression in ADPKD T lymphocytes. a ERK phosphorylation is increased in ADPKD compared with control cells (2.7 ± 0.6 for PKD2; 2.5 ± 0.7 for PKD1; 3 ± 0.8 for PKD; 0.95 ± 0.51 for RRT; 0.7 ± 0.26 for CTRL. PKD2, PKD1 and PKD vs. CTRL: ***p < 0.001). b The activation of mTOR is greater in ADPKD than in CTRL T lymphocytes (1.43. ± 0.25 for PKD2; 1.34 ± 0.2 for PKD1; 1.55 ± 0.21 for PKD; 0.65 ± 0.21 for RRT; 0.31 ± 0.24 for CTRL. PKD2, PKD1 and PKD vs. CTRL: ***p < 0.001). c ADPKD T lymphocytes show increased levels of NFkB protein compared with control cells (2.23. ± 0.61 for PKD2; 2.49 ± 0.68 for PKD1; 1.74 ± 0.40 for PKD; 0.89 ± 0.30 for RTT; 0.94 ± 0.27 for CTRL. PKD2, PKD1 and PKD vs. CTRL: **p < 0.01). d The expression of MIF is higher in ADPKD T lymphocytes than in controls (1.06 ± 0.12 for PKD2; 0.94 ± 0.20 for PKD1; 1.13 ± 0.17 for PKD; 0.23 ± 0.10 for RRT; 0.65 ± 0.13 for CTRL. PKD2 and PKD vs CTRL: **p < 0.01; PKD1 vs CTRL: *p < 0.05). CTRL = healthy controls; RRT = non-ADPKD subjects undergoing renal replacement therapy; PKD = non-genetically determined subjects; PKD1 = PKD1-related subjects; PKD2 = PKD2-related subjects. The phosphorylation levels were calculated as the ratio between band intensity of the phosphorylated form and total protein, while the expression of NFkB and MIF was calculated as ratio among the band relative to these proteins and beta-Actin. Data are expressed as mean ± standard deviation calculated from at least two different experiments in duplicate

References

    1. Aguiari G, Catizone L, Del Senno L. Multidrug therapy for polycystic kidney disease: a review and perspective. Am J Nephrol. 2013;37:175–182. doi: 10.1159/000346812. - DOI - PubMed
    1. Krishnappa V, Vinod P, Deverakonda D, Raina R. Autosomal dominant polycystic kidney disease and the heart and brain. Cleve Clin J Med. 2017;84:471–481. doi: 10.3949/ccjm.84a.16107. - DOI - PubMed
    1. Chebib FT, Hogan MC, El-Zoghby ZM, et al. Autosomal dominant polycystic kidney patients may be predisposed to various cardiomyopathies. Kidney Int Rep. 2017;2:913–923. doi: 10.1016/j.ekir.2017.05.014. - DOI - PMC - PubMed
    1. Ferreira FM, Watanabe EH, Onuchic LF. Polycystins and molecular basis of autosomal dominant polycystic kidney disease. In: Li X, editor. Polycystic kidney disease. Brisbane: Codon Publications; 2015. - PubMed
    1. Koulen P, Cai Y, Geng L, et al. Polycystin-2 is an intracellular calcium release channel. Nat Cell Biol. 2002;4:191–197. doi: 10.1038/ncb754. - DOI - PubMed

Publication types

MeSH terms