. 2019 Oct 9;132(19):jcs231753.
doi: 10.1242/jcs.231753.

COMMD1 and PtdIns(4,5)P2 interaction maintain ATP7B copper transporter trafficking fidelity in HepG2 cells

Affiliations

COMMD1 and PtdIns(4,5)P2 interaction maintain ATP7B copper transporter trafficking fidelity in HepG2 cells

Davis J Stewart et al. J Cell Sci. .

Abstract

Copper-responsive intracellular ATP7B trafficking is crucial for maintaining the copper balance in mammalian hepatocytes and thus copper levels in organs. The copper metabolism domain-containing protein 1 (COMMD1) binds both the ATP7B copper transporter and phosphatidylinositol (4,5)-bisphosphate [PtdIns(4,5)P2], whereas COMMD1 loss causes hepatocyte copper accumulation. Although it is clear that COMMD1 is localized to endocytic trafficking complexes, a direct function for COMMD1 in ATP7B trafficking has not yet been defined. In this study, experiments using quantitative colocalization analysis reveal that COMMD1 modulates copper-responsive ATP7B trafficking through recruitment to PtdIns(4,5)P2 Decreased COMMD1 abundance results in loss of ATP7B from lysosomes and the trans-Golgi network (TGN) in high copper conditions, although excess expression of COMMD1 also disrupts ATP7B trafficking and TGN structure. Overexpression of COMMD1 mutated to inhibit PtdIns(4,5)P2 binding has little impact on ATP7B trafficking. A mechanistic PtdIns(4,5)P2-mediated function for COMMD1 is proposed that is consistent with decreased cellular copper export as a result of disruption of the ATP7B trafficking itinerary and early endosome accumulation when COMMD1 is depleted. PtdIns(4,5)P2 interaction with COMMD1 as well as COMMD1 abundance could both be important in maintenance of specific membrane protein trafficking pathways.

Keywords: ATP7B; COMMD1; Endosome; Lysosome; Trafficking.


Conflict of interest statement

Competing interestsThe authors declare no competing or financial interests.

Figures

Fig. 1.
Fig. 1.
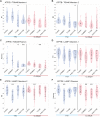
Colocalization of ATP7B with TGN46 or LAMP1. Cells were left untreated (basal medium), treated with 10 μM TTM (low copper) or treated with 10, 100 or 200 μM CuCl2. (A,B) Merged images show ATP7B in green, TGN46 (A) or LAMP1 (B) in magenta and the nucleus in blue; pixel overlap is shown in white. (C-H) 3D colocalization analysis produced M1, M2 and Pearson correlation coefficients for ATP7B and TGN46 (C-E) or LAMP1 (F-H). Values were calculated for each cell and plotted as mean±s.d., with contour plots for visualization of distribution. All data points are shown. Dunnett's method was used to compare treated and untreated cells (MEM); *P<0.05.
Fig. 2.
Fig. 2.
Colocalization of ATP7B with TGN46 or LAMP1 in cells with reduced COMMD1 expression. Cells were transfected with COMMD1 (siCD1) or nontarget (control) siRNA and treated with TTM (low copper) or 200 μM CuCl2 and cycloheximide for the last hour. (A-C) 3D colocalization analysis of ATP7B with TGN46. (D-F) 3D colocalization analysis of ATP7B with LAMP1. The M1, M2 and Pearson coefficients were calculated for each cell and plotted as mean±s.d., with contour plots for visualization of distribution. All data points are shown. Student's t-test was used to compare COMMD1 knockdown with the control for each copper treatment; *P<0.05, **P<0.005.
Fig. 3.
Fig. 3.
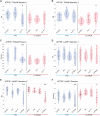
Colocalization of ATP7B with TGN46 or LAMP1 in cells with reduced COMMD1 expression. Cells were transfected with COMMD1 (siCD1) or nontarget (control) siRNA and treated with TTM (low copper) or 200 μM CuCl2 and cycloheximide with the addition of MG132 and chloroquine (CLQ) for the last hour. (A-C) 3D colocalization analysis of ATP7B with TGN46. (D-F) 3D colocalization analysis of ATP7B with LAMP1. The M1, M2 and Pearson coefficients were calculated for each cell and plotted as mean±s.d., with contour plots for visualization of distribution. All data points are shown. Student's t-test was used to compare COMMD1 knockdown with the control for each copper treatment; *P<0.05.
Fig. 4.
Fig. 4.
COMMD1 modulates ATP7B abundance and localization at the early endosome. (A-C) Colocalization of ATP7B with the retromer subunit VPS35. Cells were transfected with COMMD1 siRNA (siCD1) or nontarget (control) siRNA and treated with TTM (low copper) or 10 or 200 μM CuCl2 and cycloheximide for the last hour. 3D colocalization analysis produced M1, M2 and Pearson coefficients. Values were calculated for each cell and plotted as mean±s.d., with contour plots for visualization of distribution. All data points are shown. The Student's t-test was used to compare COMMD1 knockdown with the control for each copper treatment; **P<0.005. (D-F) HepG2 cells were treated with control siRNA or with 1, 5, 10, 15, or 20 nM siRNA to deplete COMMD1 levels gradually. (D) Dashed line shows linear regression of normalized band density of ATP7B versus COMMD1 in cells with reduced COMMD1. (E) ATP7B and COMMD1 abundance was assessed by densitometry analysis of western blots with band density normalized to the Coomassie Blue stained blot. Statistical analysis shows a negative linear correlation between COMMD1 and ATP7B abundance. (F) MTT assay (N=3) was used to analyze copper tolerance with COMMD1 knockdown (repeated three times).
Fig. 5.
Fig. 5.
Colocalization of ATP7B with TGN46 or LAMP1 in cells with reduced COMMD1 misexpression. Cells were transfected with one of three COMMD1 variants: GFP-COMMD1, GFP-COMMD1 T174M and GFP-COMMD1 K167/173E. They were then treated with TTM (low copper) or 200 μM CuCl2 for 9 h with cycloheximide added for the last hour. (A-C) 3D colocalization analysis of ATP7B with TGN46. (D-F) 3D colocalization analysis of ATP7B with LAMP1. The M1, M2 and Pearson coefficients were calculated for each cell and plotted as mean±s.d., with contour plots for visualization of distribution. All data points are shown. Dunnett's method was used to compare COMMD1 variants with the wild type; *P<0.05, **P<0.005.
Fig. 6.
Fig. 6.
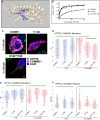
COMMD1–PtdIns(4,5)P2 interaction measured by fluorescence quenching of all aromatics. (A) Structural model of COMMD1 showing the close proximity of T174 to the positively charged residues K167 and K173. (B) Each line represents the change in fluorescence emission measured at 332 nm of one COMMD1 variant with increasing amounts of PtdIns(4,5)P2 (PIP2) when excited to 280 nm. A saturation curve was generated by raw quenching data using the formula y=1−(f1/f0), where f1 is the emission in counts per second at a given concentration, and f0 is the emission in counts per second of the first data point where concentration is zero. Nonlinear regression of binding curves resulted in Kd=40.43 nM, Bmax=0.1871, R2=0.9177 for the wild type; Kd=62.52 nM, Bmax=0.2013 R2=0.9788 for T174M; and Kd=284.1 nM, Bmax=0.01532, R2=0.9721 for K167/173E (n=3 for all data points). The x-axis shows points up to 1000 nM for visual display of saturation points, although all data points up to 8500 nM were included for calculations. (C) Example images showing colocalization of ATP7B with wild type, T174M and K167/173E COMMD1. ATP7B is in green and COMMD1 variants in magenta as indicated. (D-F) 3D colocalization analysis of ATP7B with wild-type, T174M and K167/173E COMMD1. The M1, M2 and Pearson coefficients were calculated for each cell and plotted as mean±s.d., with contour plots for visualization of distribution. Groups with no difference in means as determined by Tukey's HSD are connected by colored bars. All data points are shown.
Fig. 7.
Fig. 7.
Colocalization of ATP7B with TGN46 or LAMP1 in response to PtdIns(4,5)P2 modulation. HepG2 cells were transfected with the PH domain or ArfQ67L then treated with TTM (low copper) or 200 μM CuCl2 for 9 h with cycloheximide added for the last hour. (A-C) 3D colocalization analysis of ATP7B with TGN46. (D-F) 3D colocalization analysis of ATP7B with LAMP1. The M1, M2 and Pearson coefficients were calculated for each cell and plotted as mean±s.d., with contour plots for visualization of distribution. All data points are shown. Dunnett's method was used to compare cells expressing indicated proteins with control; *P<0.05, **P<0.005.
Fig. 8.
Fig. 8.
ATP7B trafficking itinerary in hepatocytes. COMMD1 promotes ATP7B exit from the early endosome as part of the retromer/CCC complex.

References

    1. Aikawa Y. and Martin T. F. J. (2003). ARF6 regulates a plasma membrane pool of phosphatidylinositol(4,5)bisphosphate required for regulated exocytosis. J. Cell Biol. 162, 647-659. 10.1083/jcb.200212142 - DOI - PMC - PubMed
    1. Balla T. (2013). Phosphoinositides: tiny lipids with giant impact on cell regulation. Physiol. Rev. 93, 1019-1137. 10.1152/physrev.00028.2012 - DOI - PMC - PubMed
    1. Bartuzi P., Billadeau D. D., Favier R., Rong S., Dekker D., Fedoseienko A., Fieten H., Wijers M., Levels J. H., Huijkman N. et al. (2016). CCC- and WASH-mediated endosomal sorting of LDLR is required for normal clearance of circulating LDL. Nat. Commun. 7, 10961 10.1038/ncomms10961 - DOI - PMC - PubMed
    1. Bull P. C., Thomas G. R., Rommens J. M., Forbes J. R. and Cox D. W. (1993). The wilson disease gene is a putative copper transporting P-type ATPase similar to the Menkes gene. Nat. Genet. 5, 327-337. 10.1038/ng1293-327 - DOI - PubMed
    1. Burkhead J. L., Morgan C. T., Shinde U., Haddock G. and Lutsenko S. (2009). COMMD1 forms oligomeric complexes targeted to the endocytic membranes via specific interactions with phosphatidylinositol 4,5-Bisphosphate. J. Biol. Chem. 284, 696-707. 10.1074/jbc.M804766200 - DOI - PMC - PubMed

Publication types

MeSH terms