. 2019 Oct 9;132(19):jcs231514.
doi: 10.1242/jcs.231514.

Genetic heterogeneity within collective invasion packs drives leader and follower cell phenotypes

Affiliations

Genetic heterogeneity within collective invasion packs drives leader and follower cell phenotypes

Elizabeth L Zoeller et al. J Cell Sci. .

Abstract

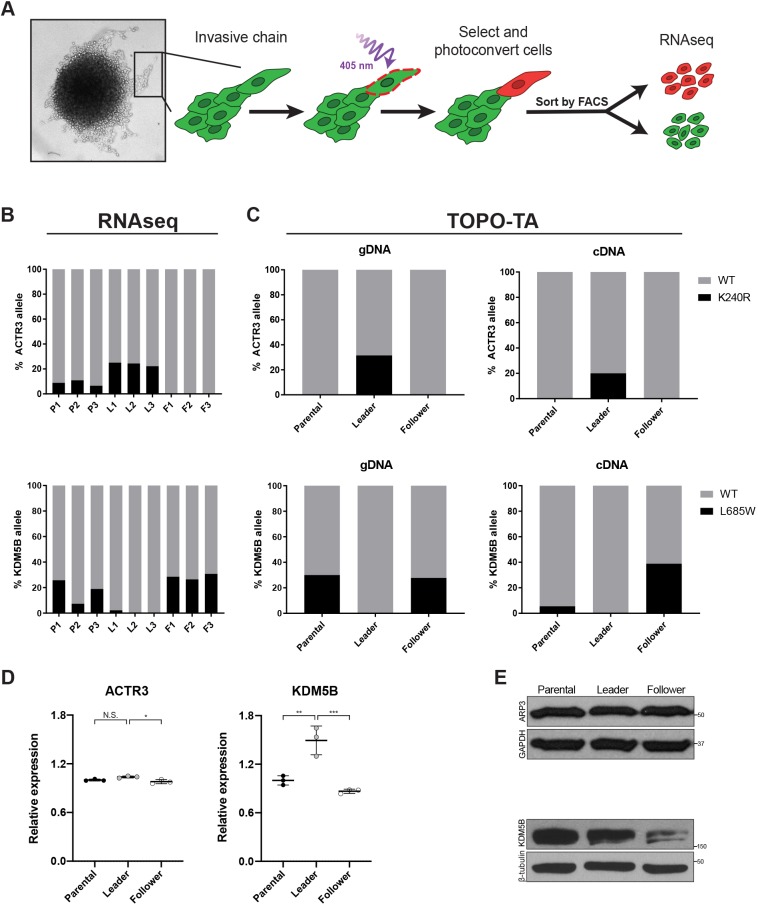
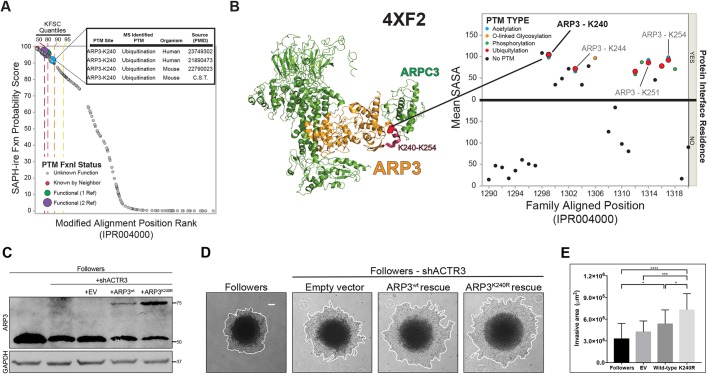
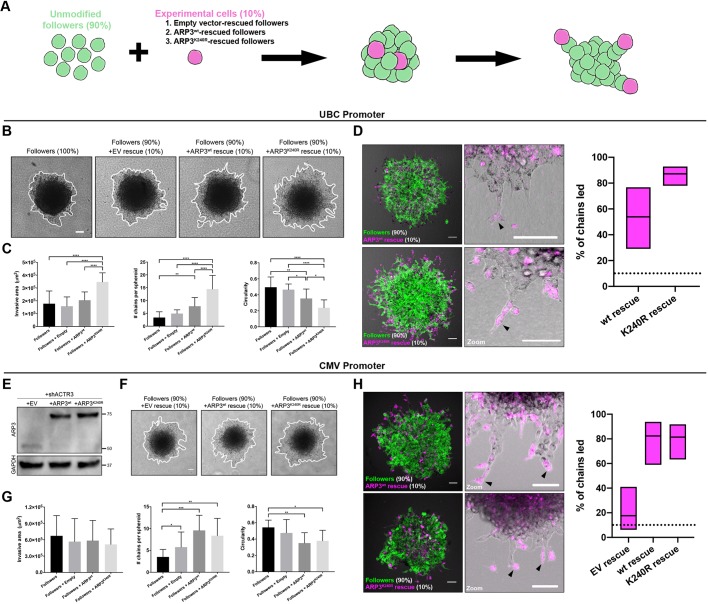
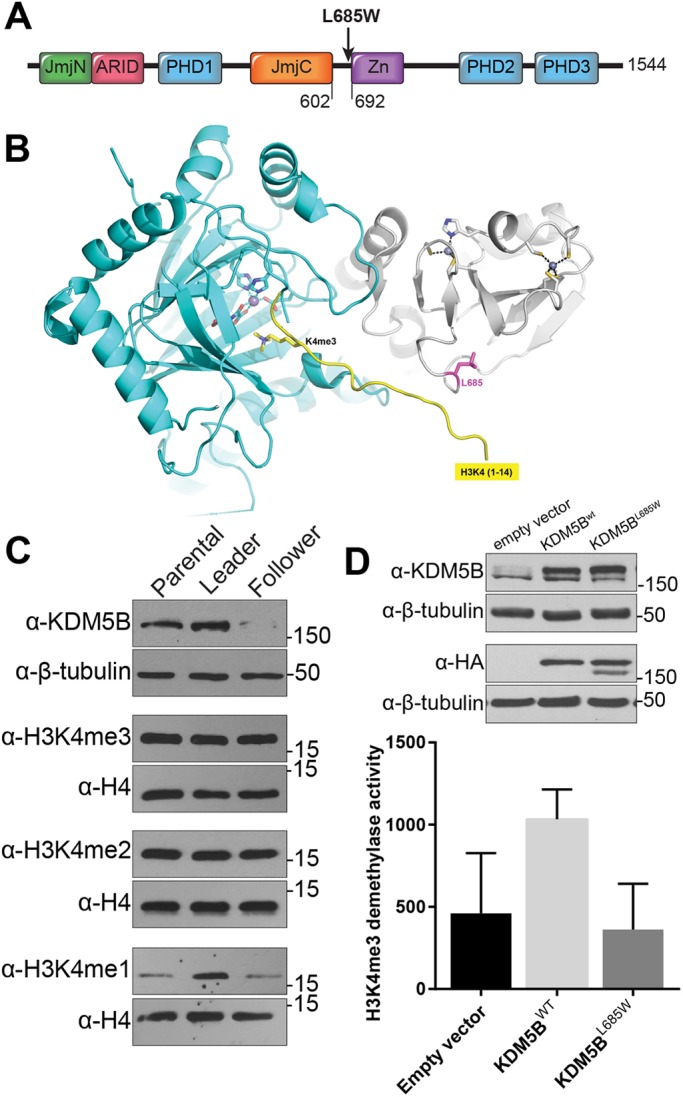
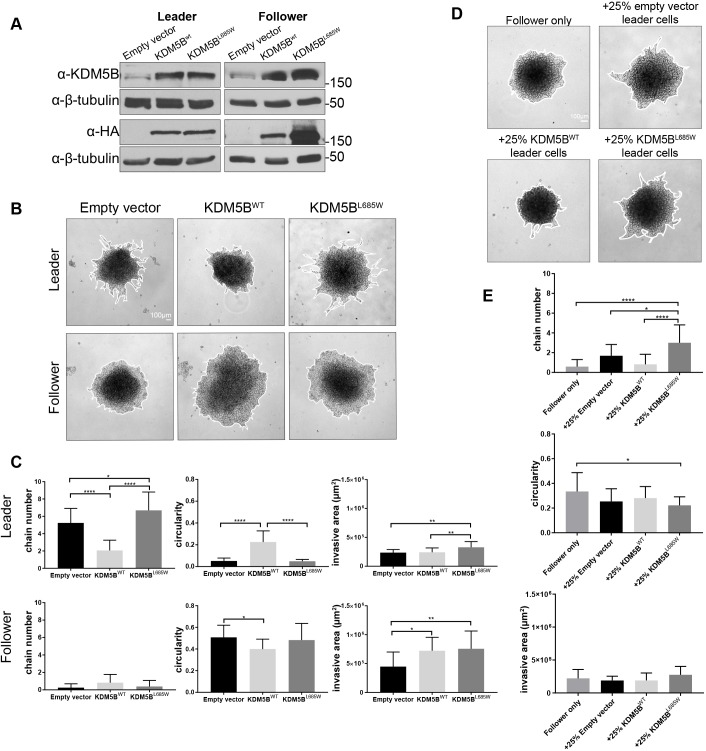
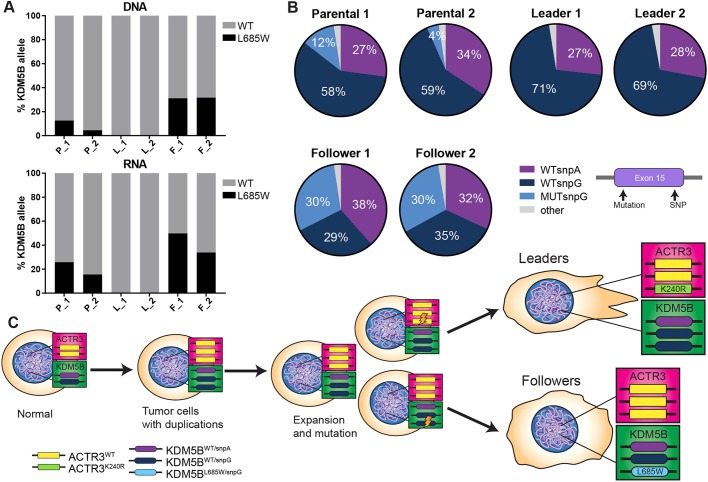
Collective invasion, the coordinated movement of cohesive packs of cells, has become recognized as a major mode of metastasis for solid tumors. These packs are phenotypically heterogeneous and include specialized cells that lead the invasive pack and others that follow behind. To better understand how these unique cell types cooperate to facilitate collective invasion, we analyzed transcriptomic sequence variation between leader and follower populations isolated from the H1299 non-small cell lung cancer cell line using an image-guided selection technique. We now identify 14 expressed mutations that are selectively enriched in leader or follower cells, suggesting a novel link between genomic and phenotypic heterogeneity within a collectively invading tumor cell population. Functional characterization of two phenotype-specific candidate mutations showed that ARP3 enhances collective invasion by promoting the leader cell phenotype and that wild-type KDM5B suppresses chain-like cooperative behavior. These results demonstrate an important role for distinct genetic variants in establishing leader and follower phenotypes and highlight the necessity of maintaining a capacity for phenotypic plasticity during collective cancer invasion.

Keywords: Epigenetic; Lung cancer; Metastasis; Mutation; Plasticity; RNA-seq.


Conflict of interest statement

Competing interestsThe authors declare no competing or financial interests.

Figures

Fig. 1.
Fig. 1.
ARP3 K240R and KDM5B L685W are validated mutations in H1299 leader and follower cells. (A) Schematic of the SaGA protocol used to isolate leader and follower cell populations. (B) Variant allele frequencies for ACTR3 and KDM5B from RNA-seq of H1299 parental (P), leader (L) and follower (F) cells. n=3 separate populations per group. (C) TOPO-TA cloning and subsequent Sanger sequencing confirms the presence of ARP3 K240R and KDM5B L685W mutations in both cDNA and genomic DNA (gDNA) from parental, leader and follower cells, respectively. n=20 colonies (ARP3 parental, follower gDNA and parental, leader cDNA and KDM5B parental gDNA); 19 colonies (ARP3 leader gDNA and KDM5B leader gDNA); 18 colonies (ARP3 follower cDNA and KDM5B follower gDNA and parental, follower cDNA); and 17 colonies (KDM5B leader cDNA). Association between the genotype and cell phenotype was determined by Fisher's exact test as follows: mutant versus wild type, leader versus follower ARP3 gDNA P=0.008, ARP3 cDNA P=0.11, KDM5B gDNA P=0.02, and KDM5B cDNA P=0.008. (D) Relative mRNA expression (via RNA-seq; normalized to parental average) and (E) protein levels (via western blotting) of ACTR3 (ARP3) and KDM5B in H1299 parental, leader, and follower populations. *P<0.05; **P<0.01; ***P<0.001; N.S., not significant (one-way ANOVA with Tukey's post-test).
Fig. 2.
Fig. 2.
PTM hotspot analysis of ARP3 K240 suggests that the K240R mutation has a functional impact. (A) Plot of SAPH-ire probability score by rank for all modified alignment positions in the ARP protein family IPR004000. The ARP3 K240 ubiquitylation site is highly ranked along with other MAPs that contain PTMs with well-established function (four or more supporting references), as indicated by known function source count (KFSC) quantiles. Inset, table of ARP3 K240 PTMs identified by mass spectrometry of human and mouse tissues, including literature sources. (B) Local PTM topology of the ARP3 family near ARP3 K240. PTM sites plotted by solvent accessible surface area (SASA) and proximity to the interface of a protein–protein interaction. Human ARP3 PTMs are labeled, revealing multiple ubiquitylation sites between K240 and K254. Left, structure of the Arp2/3 complex (PDB 4XF2) indicating ARP3 K240 (spheres) within the K240–K254 region of ARP3 (red). (C) Western blot showing exogenous (upper band) versus endogenous (lower band) ARP3 expression in unmodified followers, and shACTR3-expressing followers rescued with either empty vector (EV), wild-type ARP3 (ARP3wt), or ARP3K240R. Rescue constructs were mCherry-tagged to allow for visualization within invasive chains. (D) Images of invasion in Matrigel at 24 h of spheroids comprised of unmodified follower cells, or shACTR3-expressing followers transfected with either empty vector, wild-type ARP3, or ARP3 K240R constructs. The edge of the spheroid is highlight by a white line. (E) Quantification of spheroid invasive area (mean±s.d., n=17, 15, 16, and 17 spheroids per group, respectively, across N=3 experiments). *P<0.05, ***P<0.001, ****P<0.0001 (one-way ANOVA with Tukey's post-test). Scale bar: 100 µm.
Fig. 3.
Fig. 3.
ARP3 K240R confers leader-like properties when expressed in follower cells. (A) Illustration of spheroid-mixing experimental setup. Spheroids comprised either 100% unmodified followers, or 90% unmodified followers plus 10% of shACTR3-expressing followers rescued with either empty vector, wild-type ARP3 (ARP3wt) or ARP3 K240R (ARP3K240R). (B) Invasion of mixed spheroids in Matrigel after 24 h. Rescue constructs were expressed under the control of the UBC promoter. Representative images shown for each condition. The edge of the spheroid is highlight by a white line. (C) Quantification of invasive area, circularity and average number of chains per spheroid for each condition (mean±s.d., n=14, 11, 18 and 16 spheroids for unmodified followers, EV rescue, wild-type ARP3 rescue, and ARP3 K240R rescue, respectively, across N=3 experiments). *P<0.05, **P<0.01, ****P<0.0001 (one-way ANOVA with Tukey's post-test). (D) Confocal fluorescence imaging of mixed spheroids, with unmodified followers shown in green and mCherry-ARP3 K240R-rescued cells or mCherry-wild-type ARP3-rescued cells shown in magenta. Black arrowheads indicate invasive chains being led by experimental rescue cells. Graphs show percentage of chains (mean±95% c.i.) led by wild-type ARP3-rescued and ARP3 K240R-rescued followers. The dotted line denotes the level at which 10% of chains are led, corresponding to the proportion of ARP3-rescued cells in the mixed spheroids. (E) Western blot showing protein expression levels of ARP3 in followers after knockdown of endogenous ARP3 and rescue with empty vector (EV), wild-type ARP3 or ARP3 K240R. Rescue constructs were expressed under control of the CMV promoter. (F,G) 24 h invasion of mixed spheroids in Matrigel. Representative images (F) and quantification (G) of invasive area, circularity and average numbers of chains per spheroid shown for each condition (mean±s.d., n=12, 12, 12 and 11 spheroids per group, respectively, across N=2 experiments). In F, the edge of the spheroid is highlight by a white line. *P<0.05, **P<0.01, ***P<0.001 (one-way ANOVA with Tukey's post-test). (H) Confocal fluorescence imaging of mixed spheroids, with unmodified followers shown in green and mCherry-wild-type ARP3-rescued cells or mCherry-ARP3 K240R-rescued cells shown in magenta. Black arrowheads indicate invasive chains being led by experimental rescue cells. Graphs show the percentage of chains (mean±95% c.i.) led by mCherry-empty-vector-rescued, wild-type ARP3-rescued and ARP3 K240R-rescued followers. The dotted line denotes the proportion of ARP3 rescued cells in the mixed spheroids, thus the 10% of chains expected to be led based on random chance. Scale bars: 100 µm.
Fig. 4.
Fig. 4.
Characterization of the follower-enriched KDM5B L685W mutation. (A) Diagram of KDM5B protein domains and relative position of amino acid residue 685 to the zinc finger domain. (B) Partial model of KDM5B L685W with the H3 N-terminal tail (residues 1–14). The model was generated by superimposing a structure of KDM5B (PDB 5A1F) with that of KDM6A in complex with histone H3 peptide (PDB 3AVR), which placed a trimethylated H3K4 in the active site of KDM5B, near the Fe(II)-binding site, and the C-terminal tail of histone H3 near L685. (C) Western blot analysis of KDM5B expression and mono, di- and tri-methylated H3K4 in lysates from H1299 parental, leader, and follower cell populations. Loading controls β-tubulin and H4 are probed from the same blot as preceding bands. The experiment was repeated on three separate protein collections from cells at different passages (N=3). (D) In vitro H3K4 demethylation assay performed on lysates derived from three separate, biological replicates of parental H1299 cells expressing empty vector, wild-type KDM5B (KDM5BWT) or KDM5B L685W (mean±s.d. specific activity; N=3 biological replicates).
Fig. 5.
Fig. 5.
Wild-type KDM5B suppress and KDM5B L685W drives chain-like invasion. (A) Western blot analysis demonstrating successful expression of HA-tagged wild-type (WT) and L685W KDM5B in leader and follower cell populations. (B) Images of invasion in Matrigel at 24 h of leader and follower spheroids expressing empty vector, wild-type HA–KDM5B or HA–KDM5B L685W. (C) Quantification of invasive area, circularity and chain number from spheroids depicted in B [mean±s.d., n=16 spheroids (follower empty vector, leader KDM5BWT, and leader KDM5BL685W), n=17 spheroids (leader empty vector and follower KDM5BWT), n=18 spheroids (follower KDM5BL685W), across N=3 independent experiments]. *P<0.05, **P<0.01, ****P<0.0001 (one-way ANOVA with Tukey's post-test). (D) Images of invasion in Matrigel at 24 h of spheroids composed of 75% follower cells and 25% leader cells expressing either empty vector, wild-type HA–KDM5B, or HA–KDM5B-L685W. The edges of the spheroids are highlight by a white line in B and D. (E) Quantification of invasive area, circularity and chain number from spheroids depicted in D [mean±s.d., n=16 spheroids (+25% leader empty vector), n=17 spheroids (follower only and +25% leader KDM5BWT), n=18 spheroids (+25% leader KDM5BL685W), across three independent experiments]. *P<0.05, ****P<0.0001 (one-way ANOVA with Tukey's post-test).
Fig. 6.
Fig. 6.
Leader and follower cells are derived from two separate populations defined by mutational profile. (A) Deep targeted resequencing across KDM5B exon 15 in genomic DNA (top) and RNA (bottom) isolated from parental, leader and follower populations (N=2 independent isolates of DNA or RNA at separate passages of cells derived from a single phenotypic isolation; average depth=348,327 reads per sample). (B) Pie charts depicting proportions of KDM5B genotypes across parental, leader and follower populations as determined from the deep amplicon sequencing shown in A. (C) Model of the potential history of leader and follower populations from parental cell population as inferred from the genetic profiles of KDM5B and ARP3.

References

    1. Abercrombie M. (1970). Contact inhibition in tissue culture. In Vitro 6, 128-142. 10.1007/BF02616114 - DOI - PubMed
    1. Abercrombie M. and Heaysman J. E. M. (1953). Observations on the social behaviour of cells in tissue culture: I. Speed of movement of chick heart fibroblasts in relation to their mutual contacts. Exp. Cell Res. 5, 111-131. 10.1016/0014-4827(53)90098-6 - DOI - PubMed
    1. Alexander S., Koehl G. E., Hirschberg M., Geissler E. K. and Friedl P. (2008). Dynamic imaging of cancer growth and invasion: a modified skin-fold chamber model. Histochem. Cell Biol. 130, 1147-1154. 10.1007/s00418-008-0529-1 - DOI - PubMed
    1. Alexander S., Weigelin B., Winkler F. and Friedl P. (2013). Preclinical intravital microscopy of the tumour-stroma interface: invasion, metastasis, and therapy response. Curr. Opin. Cell Biol. 25, 659-671. 10.1016/j.ceb.2013.07.001 - DOI - PubMed
    1. Andrews S. (2010). FastQC: A Quality Control tool for High Throughput Sequence Data.

Publication types