. 2019 Nov;96(5):629-640.
doi: 10.1124/mol.119.115964. Epub 2019 Sep 12.

A High-Throughput Screen of a Library of Therapeutics Identifies Cytotoxic Substrates of P-glycoprotein

Affiliations

A High-Throughput Screen of a Library of Therapeutics Identifies Cytotoxic Substrates of P-glycoprotein

Tobie D Lee et al. Mol Pharmacol. 2019 Nov.

Abstract

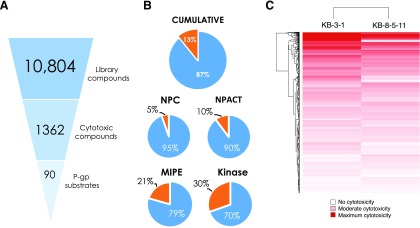
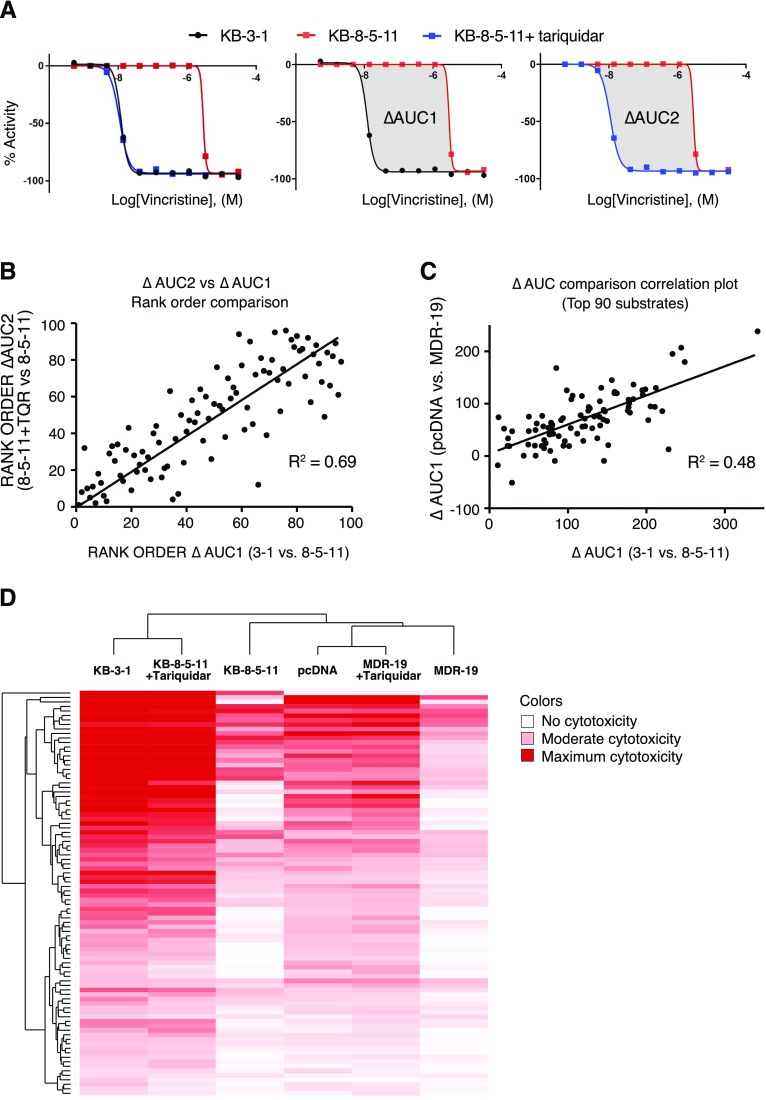
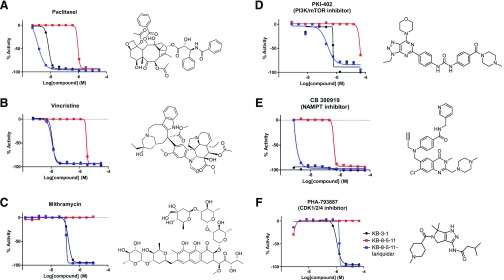
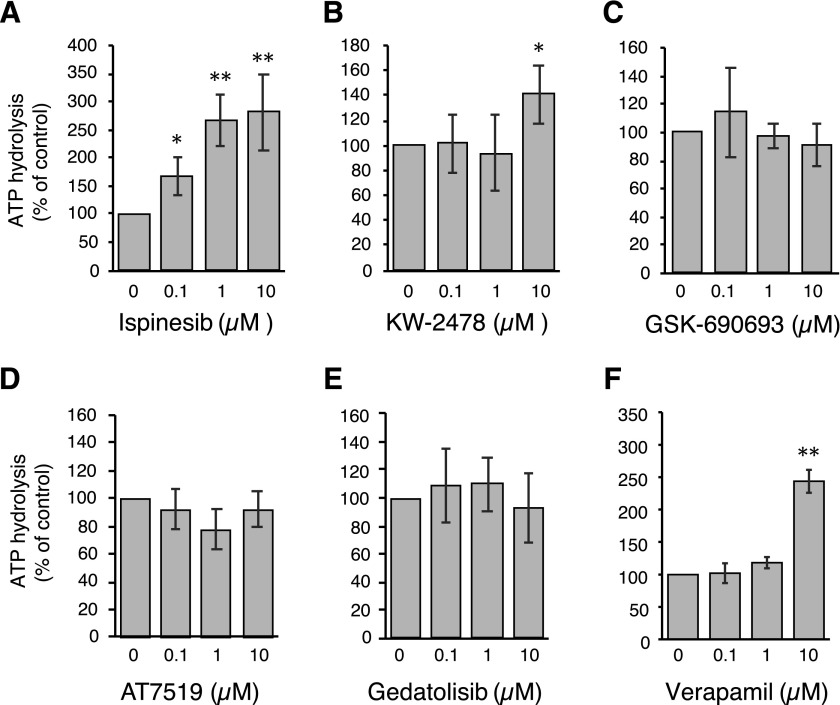
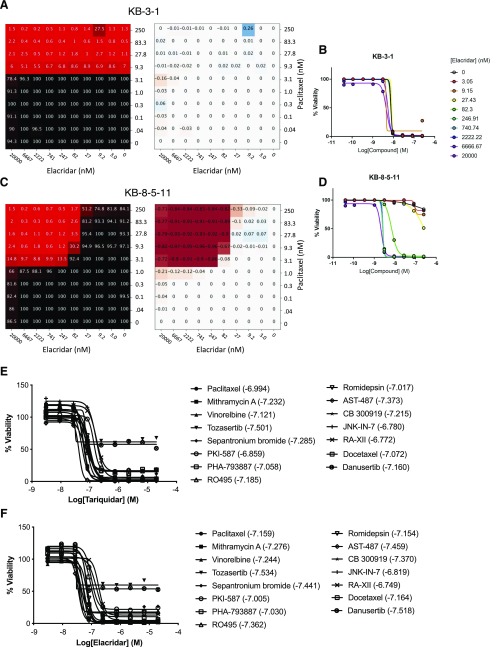
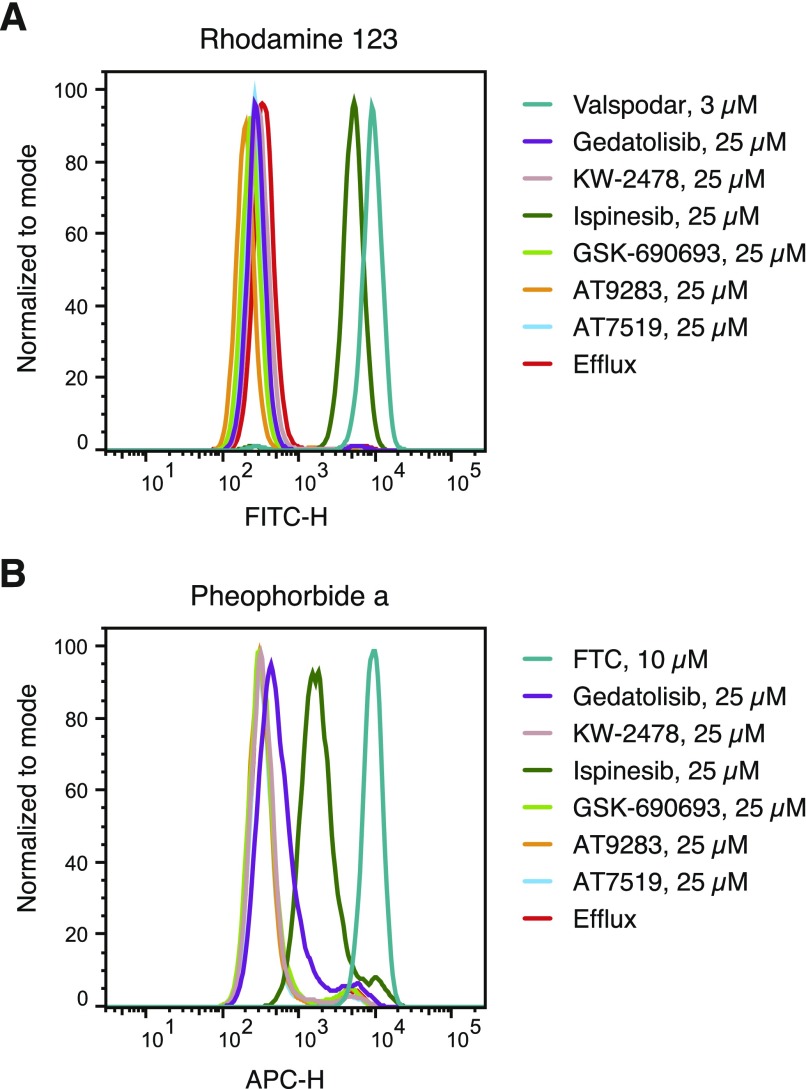
The ATP-binding cassette transporter P-glycoprotein (P-gp) is known to limit both brain penetration and oral bioavailability of many chemotherapy drugs. Although US Food and Drug Administration guidelines require that potential interactions of investigational drugs with P-gp be explored, often this information does not enter the literature. In response, we developed a high-throughput screen to identify substrates of P-gp from a series of chemical libraries, testing a total of 10,804 compounds, most of which have known mechanisms of action. We used the CellTiter-Glo viability assay to test library compounds against parental KB-3-1 human cervical adenocarcinoma cells and the colchicine-selected subline KB-8-5-11 that overexpresses P-gp. KB-8-5-11 cells were also tested in the presence of a P-gp inhibitor (tariquidar) to assess reversibility of transporter-mediated resistance. Of the tested compounds, a total of 90 P-gp substrates were identified, including 55 newly identified compounds. Substrates were confirmed using an orthogonal killing assay against human embryonic kidney-293 cells overexpressing P-gp. We confirmed that AT7159 (cyclin-dependent kinase inhibitor), AT9283, (Janus kinase 2/3 inhibitor), ispinesib (kinesin spindle protein inhibitor), gedatolisib (PKI-587, phosphoinositide 3-kinase/mammalian target of rampamycin inhibitor), GSK-690693 (AKT inhibitor), and KW-2478 (heat-shock protein 90 inhibitor) were substrates. In addition, we assessed direct ATPase stimulation. ABCG2 was also found to confer high levels of resistance to AT9283, GSK-690693, and gedatolisib, whereas ispinesib, AT7519, and KW-2478 were weaker substrates. Combinations of P-gp substrates and inhibitors were assessed to demonstrate on-target synergistic cell killing. These data identified compounds whose oral bioavailability or brain penetration may be affected by P-gp. SIGNIFICANCE STATEMENT: The ATP-binding cassette transporter P-glycoprotein (P-gp) is known to be expressed at barrier sites, where it acts to limit oral bioavailability and brain penetration of substrates. In order to identify novel compounds that are transported by P-gp, we developed a high-throughput screen using the KB-3-1 cancer cell line and its colchicine-selected subline KB-8-5-11. We screened the Mechanism Interrogation Plate (MIPE) library, the National Center for Advancing Translational Science (NCATS) pharmaceutical collection (NPC), the NCATS Pharmacologically Active Chemical Toolbox (NPACT), and a kinase inhibitor library comprising 977 compounds, for a total of 10,804 compounds. Of the 10,804 compounds screened, a total of 90 substrates were identified of which 55 were novel. P-gp expression may adversely affect the oral bioavailability or brain penetration of these compounds.


Figures

Fig. 1.
Fig. 1.
Overview of high-throughput screening data. (A) Hit triage from HTS library screen (10,804 compounds), to compounds that are cytotoxic toward parental KB-3-1 cells (1362 compounds), to putative P-gp substrates (90 compounds). (B) Summary of percentage of cytotoxic compounds (orange) vs. nontoxic compounds (blue), both cumulative and represented in each library screened. (C) Area-under-the-curve heatmap of compound activity for screen hits, where red intensity represents magnitude of AUC: Deep red is strongest cytotoxicity, and white represents no cytotoxicity.
Fig. 2.
Fig. 2.
Summary of P-gp substrate analysis. (A) Summary of data analysis. For each compound, data are displayed as “loss of signal from baseline,” where −100% represents total cell killing. KB-3-1 cells are sensitive (black), KB-8-5-11 cells are resistant (red) but sensitized when P-gp inhibitor tariquidar is added (blue), left. To perform HTS data analysis, AUCs were determined for the parent and resistant lines, and the difference in AUC (termed ΔAUC) was used to identify putative substrates. ΔAUC1 is the difference in AUC in the KB-3-1 (black line) sensitive cells compared with KB-8-5-11 (red line) resistant cells (center); ΔAUC2 is the difference in AUC of KB-8-5-11 resistant cells in the absence (red line) and presence (blue line) of tariquidar (right). Comparison of the AUC for substrates calculated using ΔAUC1 and ΔAUC2, assessing (B) rank order of substrates (where largest ΔAUC is strongest substrate) and (C) orthogonal data generated testing P-gp substrates against HEK cells. (D) Unsupervised clustering of compound activity against parent and resistant lines (with and without tariquidar), where deep red represents greatest cytotoxicity.
Fig. 3.
Fig. 3.
Representative examples of known (A–C) and newly identified (D–F) substrates of P-gp as determined by the screen.
Fig. 4.
Fig. 4.
Effects of novel P-gp substrates on ATPase activity. The vanadate-sensitive activity of P-gp was determined as outlined in Materials and Methods. Basal P-gp ATPase activity was compared with activity in the presence of 0.1, 1, or 10 μM concentrations of the substrates (A) ispinesib, (B) KW-2478, (C) GSK-690693, (D) AT7519 or (E) gedatolisib. Verapamil (F) is shown as a positive control. Graphs depict average values from three independent experiments (error bars ± S.D.). Significance was determined by a one-way analysis of variance followed by a Dunnet test for multiple comparisons. Asterisks denote significant difference from the control, where P < 0.05 (*); P < 0.01 (**).
Fig. 5.
Fig. 5.
Substrate synergy with P-gp inhibitors. Sample combination of elacridar and paclitaxel tested in 10 × 10 dose-response matrices with KB-3-1 (A and B) and KB-8-5-11 (C and D). (A and C) Left, percent response of cell viability where red = cell death, black = cell survival. (A and C) Right, matrix plot in ΔBliss model, magenta = synergy. (B and D) Dose-response curves extracted from synergy blocks for paclitaxel with increasing concentrations of elacridar. Dose-response curves for (E) tariquidar and (F) elacridar for all substrates tested (listed in Table 2). Values in parentheses are the log of the molar concentration of tariquidar or elacridar needed to achieve maximum cell killing when combined with the noted drugs.
Fig. 6.
Fig. 6.
Inhibition of P-gp- and ABCG2-mediated transport by P-gp substrates. P-gp-overexpressing MDR-19 cells (A) or ABCG2-overexpressing R-5 cells (B) were incubated with 0.5 μg/ml rhodamine 123 or 5 μM pheophorbide A, respectively, in the absence or presence a specific inhibitor (3 μM Valspodar for P-gp and 10 μM fumitremorgin C for ABCG2) or 25 μM gedatolisib, KW-2478, ispinesib, GSK-690693, AT9283, or AT7519 for 30 minutes after which the medium was removed and replaced with substrate-free medium continuing without or with the inhibitor. Cells incubated with substrates alone are shown by the red histogram, cells incubated with the substrate and specific inhibitor are shown by the teal histogram, and cells incubated with 25 μM concentrations of the test compounds are noted in the key. Results from one of two experiments are shown.

References

    1. Alvarez M, Paull K, Monks A, Hose C, Lee JS, Weinstein J, Grever MR, Bates SE, Fojo AT. (1995) Generation of a drug resistance profile by quantitation of mdr-1/P-glycoprotein in the cell lines of the National Cancer Institute anticancer drug screen. J Clin Invest 95:2205–2214. - PMC - PubMed
    1. Alvarez M, Robey R, Sandor V, Nishiyama K, Matsumoto Y, Paull K, Bates S, Fojo T. (1998) Using the national cancer institute anticancer drug screen to assess the effect of MRP expression on drug sensitivity profiles. Mol Pharmacol 54:802–814. - PubMed
    1. Ambudkar SV. (1998) Drug-stimulatable ATPase activity in crude membranes of human MDR1-transfected mammalian cells. Methods Enzymol 292:504–514. - PubMed
    1. Basseville A, Hall MD, Chau CH, Robey RW, Gottesman M, Figg WD, Bates SE. (2016) The ABCG2 multidrug transporter, in ABC Transporters - 40 Years on (George MA. ed) pp 195–226, Springer International Publishing, Cham, Switzerland.
    1. Bavetsias V, Skelton LA, Yafai F, Mitchell F, Wilson SC, Allan B, Jackman AL. (2002) The design and synthesis of water-soluble analogues of CB30865, a quinazolin-4-one-based antitumor agent. J Med Chem 45:3692–3702. - PubMed

Publication types

MeSH terms

Substances

LinkOut - more resources