. 2019 Nov;181(3):1223-1238.
doi: 10.1104/pp.19.00202. Epub 2019 Sep 12.

Earlier Degraded Tapetum1 (EDT1) Encodes an ATP-Citrate Lyase Required for Tapetum Programmed Cell Death

Affiliations

Earlier Degraded Tapetum1 (EDT1) Encodes an ATP-Citrate Lyase Required for Tapetum Programmed Cell Death

Wenting Bai et al. Plant Physiol. 2019 Nov.

Abstract

In flowering plants, the tapetum cells in anthers undergo programmed cell death (PCD) at the late meiotic stage, providing nutrients for further development of microspores, including the formation of the pollen wall. However, the molecular basis of tapetum PCD remains elusive. Here we report a tapetum PCD-related mutant in rice (Oryza sativa), earlier degraded tapetum 1 (edt1), that shows complete pollen abortion associated with earlier-than-programmed tapetum cell death. EDT1 encodes a subunit of ATP-citrate lyase (ACL), and is specifically expressed in the tapetum of anthers. EDT1 localized in both the nucleus and the cytoplasm as observed in rice protoplast transient assays. We demonstrated that the A and B subunits of ACL interacted with each other and might function as a heteromultimer in the cytoplasm. EDT1 catalyzes the critical steps in cytosolic acetyl-CoA synthesis. Our data indicated a decrease in ATP level, energy charge, and fatty acid content in mutant edt1 anthers. In addition, the genes encoding secretory proteases or lipid transporters, and the transcription factors known to regulate PCD, were downregulated. Our results demonstrate that the timing of tapetum PCD must be tightly regulated for successful pollen development, and that EDT1 is involved in the tapetum PCD process. This study furthers our understanding of the molecular basis of pollen fertility and fecundity in rice and may also be relevant to other flowering plants.


Figures

Figure 1.
Figure 1.
Morphological comparison between rice wild type (WT) and earlier degraded tapetum 1 (edt1) mutant. A, Phenotypes of wild-type and edt1 mutant plants after bolting. B, Spikelets of wild-type and edt1 mutant plants after removal of the lemma and palea. C, Anthers of wild-type and edt1 plants at the heading stage. D, Anthers of wild type and edt1 stained with IKI solution. Note that staining of starch-rich pollen grains was seen only in the wild-type anther. Bars = 15 cm (A), 0.7 mm (B), and 0.5 mm (C and D).
Figure 2.
Figure 2.
Microspore and tapetum development in the wild type and the edt1 mutant. A to J, Pollen grains of the wild type (A–E) and edt1 (FJ) at different stages were stained with carmine acetate. Grains at stages 8b (A and F), 9a (B and G), 9b (C and H), 10 (D and I), and 14 (E and J) are shown. Note the abnormal development and degradation of microspores in edt1 (arrowheads). DM, degraded microspores. Bars = 20 µm. K to R, Transverse section analysis of wild-type (K–N) and edt1 (O–R) anthers at different developmental stages (8–10) stained with toluidine blue. The images are of cross sections through single locules at stages 8a (K and O), 9a (L and P), 9b (M and Q), and 10 (N and R). Bars = 15 μm. DT, degraded tapetum; GP, germination pore; MC, meiotic cell; MSP, microspores; T, tapetum.
Figure 3.
Figure 3.
Transmission electron microscopy of anthers in the wild type (WT) and the edt1 mutant at different developmental stages. A and B, Stage 8 anthers from the wild type (A) and edt1 (B). C and D, Close-ups of the boxed areas in A and B, respectively. E and F, Stage 9 anthers from the wild type (E) and edt1 (F). G and H, Close-ups of E and F, respectively, showing mitochondria (Mt) and other organelles. I and J, Stage 10 anthers from the wild type (I) and edt1 (J). K and L, Stage 11 anthers from the wild type (K) and edt1 (L). Arrows in H indicate the degraded mitochondria and the arrowheads in E and K indicate the Ubisch bodies (Ub). M and N, Transverse sections of the microspore walls from the wild type (M) and edt1 (N) at stage 10, showing tectum (Te), nexine I (Ne), bacula (Ba), endexine II (End), and intine (In). O and P, Transverse sections of the microspores of the wild type (O) and edt1 (P) at stage 12. Ba, bacula; Cy, cytoplasm; DEnd, defective endexine II; DNe, defective nexine I; DTe, defective tectum; DP, degraded pollen; DT, degraded tapetum; End, endexine II; In, intine; MP, mature pollen; Msp, microspores; Mt, mitochondrion; Ne, nexine I; T, tapetum; Te, tectum; Ub, Ubisch body. Bars = 3 μm (A–J, M, and N), 0.5 μm (K and O), and 1.5 μm (L and P).
Figure 4.
Figure 4.
DNA fragmentation in wild-type (WT) and edt1 mutant anthers. A to H, Detection of nuclear DNA fragmentation by TUNEL assay in anthers of the wild type (A–D) and edt1 (E–H) at stages 6 (S6) through 9 (S9). Nuclei were stained with propidium iodide as red fluorescence. The yellow fluorescence is the merged signal from TUNEL-positive nuclei staining (green) and propidium iodide staining (red). The arrows in C, D, F, and G indicate TUNEL-positive signals in tapetum cells. Bars = 50 μm. I to L, Detection of nuclear DNA fragmentation by comet assays. DNA damage level was assessed in wild-type (I and K) and edt1 (J and L) anthers at S6 (I and J) and S7 (K and L). Bars = 20 μm. M, Quantification of the DNA damage in S6 through S9. The extent of DNA damage in each nucleus is indicated by the units 0, 1, 2, or 3. An increased unit correlated with a larger comet tail and a smaller comet head, as illustrated in the inset in M. The final DNA damage value was obtained by summing the damage units of 50 nuclei per slide. Data are the mean ± sd (n = 3). The asterisks indicate statistical significance at P ≤ 0.05 by Student’s t test.
Figure 5.
Figure 5.
Isolation of the EDT1 gene. A, Fine mapping of the edt1 locus. B1 to B10, D8, and D13 are markers developed in this work (Supplemental Table S1). The edt1 locus was localized to a 543-kb region between the two markers B9 and B10. The edt1 genome contains a 147-kb deletion in which the EDT1 gene is located. The number of recombinants is indicated below the map. CEN, centromere. B, Genomic structure of EDT1 and a point mutation in the c-edt1 mutant. The c-edt1 genome contains an extra base A in the marked site in exon 3. Lines indicate introns and boxes indicate exons. The ATP-grasp domain and the citrate-binding domain in EDT1 are marked with dark blue and light blue, respectively. Anthers of the wild type (C), edt1 (E), a transgenic pEDT1-EDT1 line (G), and a mutant c-edt1 created by CRISPR-Cas9 (I). IKI staining of the pollen grains from wild-type (D), edt1 (F), pEDT1-EDT1 (H), and c-edt1 (J) plants. K and L, TEM images showing the morphology of tapetum cells (K) and the microspore wall (L) of the pEDT1-EDT1 plant. The arrowhead in K indicates the Ubisch bodies (Ub). M and N, Transverse sections of tapetum cells (M) and the microspore wall (N) in c-edt1. Ba, bacula; Cy, cytoplasm; DNe, defective nexine I; DTe, defective tectum; In, intine; Ne, nexine I; T, tapetum; Te, tectum; Ub, Ubisch body. Bars = 1 mm (C, E, G, and I), 20 μm (D, F, H, and J), 3 μm (K and M), and 0.5 μm (L and N).
Figure 6.
Figure 6.
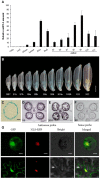
Expression pattern of EDT1 and protein subcellular localization. A, RT-qPCR analysis of EDT1 expression in vegetative organs (culm and leaf) and reproductive organs (glume, lemma, palea, pistil, and anthers) at different times from stage 5 (S5) to stage 11 (S11), with ubiquitin (UBQ) used as an internal control. B, GUS staining of anthers at different developmental stages in the pEDT1-GUS transgenic line. Bar = 2 mm. C, GUS staining in a cross section of a stage 10 anther locule from pEDT1-GUS transgenic plants (as indicated by the black horizontal bar in B). BS7, before stage 7. Bar = 50 μm. D to F, In situ hybridization for EDT1 mRNA in wild-type anthers at stages 8 (D) and 10 (E) with antisense or sense (F) dig-labeled probes of EDT1. Msp, microspore; T, tapetum. Bars = 50 μm. G, Subcellular localization of the EDT1-GFP fusion protein in rice protoplasts (top) and N. benthamiana epidermal cells (bottom). GFP signals of EDT1-GFP fusion proteins were localized in the nucleus and the cytoplasm of rice protoplasts and tobacco epidermal cells. Confocal microscopy was used to observe the fluorescence signals of GFP (green fluorescence), and NLS-RFP (red fluorescence) was used as a nuclear localized control. Yellow fluorescence indicates merged images. Bars = 20 μm (top) and 10 μm (bottom).
Figure 7.
Figure 7.
EDT1 interacts with ACLB-1. A, Y2H assays examining interaction between EDT1 and ACLB-1. DDO, double drop-out medium, control medium (synthetic dropout medium [SD]/-Trp-Leu); QDO, quadruple drop-out medium, selective medium (SD/-Trp-Leu-His -Ade); Prey, activation domain, representing the pGADT7 vector; Bait, binding domain, representing the pGBKT7 vector. B, In vitro pull-down assay of recombinant MBP-ACLB-1 using bead-coupled GST-EDT1. C, In vitro pull-down assay of recombinant protein GST-EDT1 using bead-coupled MBP-EDT1. D, BiFC assay showing self-interaction of EDT1 and ACLB-1, respectively, and interaction between EDT1 and ACLB-1 in the cytoplasm of N. benthamiana leaf cells. YFP, yellow fluorescent protein. YFPN, p2YN vector; YFPN-EDT1, p2YN-EDT1 vector; YFPN-ACLB-1, p2YN- ACLB-1 vector; YFPC, p2YC vector; YFPC-EDT1, p2YC-EDT1 vector; YFPC-ACLB-1, p2YC- ACLB-1 vector. Bars = 20 μm.
Figure 8.
Figure 8.
In vitro ACL activity of EDT1 and determination of citric acid and OAA. A and B, In vitro enzymatic activity of the recombinant EDT1 protein determined using spectrophotometric assays. The reaction time was 10 min and relative absorbance at 340 nm. The first four columns in A represent EDT1+ ACLB-1, the fifth column represents EDT1 only, and the last three columns represent the positive control. C, Citric acid content in wild-type and edt1 anthers at stages 8–10 (S8–S10). D, OAA content in wild-type and edt1 anthers at stage 9. Error bars indicate the mean ± sd (n = 3). *P ≤ 0.05 and **P ≤ 0.01; Student’s t test.
Figure 9.
Figure 9.
Detection of metabolic changes and expression analysis of genes related to pollen development in edt1. A and B, Analyses of superoxide anion levels by NBT staining (A) and WST-1 (Na, 2-[4-iodophenyl]-3-[4-nitrophenyl]-5-[2, 4-disulfophenyl]-2H-tetrazolium; B) production in wild-type and edt1 anthers from early stage 8 to stage 11. Bars = 0.5 mm. C and D, Comparisons of the amount of energy charge (C) and ATP (D) between wild-type and edt1 anthers from stages 8 to 11. Energy charge = ([ATP] + 0.5[ADP])/([ATP] + [ADP] + [AMP]). E, Comparison of the fatty acid content between wild-type and edt1 anthers at the heading stage. F, Alteration in the expression of key regulatory genes involved in pollen development in edt1 at stage 9 by RT-qPCR, with UBQ as a control. Data are presented as the mean of three biological replicates ± sd. Error bars in B to F indicate the SD (n = 3). Student’s t test was used for statistical analysis (*P ≤ 0.05; **P ≤ 0.01). G, A proposed model for the role of EDT1 in tapetum PCD. EDT1 encodes ACLA, which can catalyze citric acid (transported from mitochondria) to form OAA and cytosolic acetyl-CoA. OAA is replenished into the mitochondria as part of anaplerotic reactions for TCA cycle. In the cytosol, acetyl-CoA is a precursor substance for fatty acids, which will contribute to pollen formation. In the edt1 mutant, the defective ACL caused excessive accumulation of citric acid and impaired OAA replenishment, further leading to mitochondrial dysfunction. Abnormal degradation of mitochondria causes oxygen stress and insufficient energy, and the tapetum eventually degrades prematurely. Nutrients in the anomalously degraded tapetum (like cytoplasmic liposomes and sporopollenin synthesis precursors) cannot be used normally for the formation of pollen grains, and coupled with the effects on the synthesis of cytosolic acetyl-CoA, it results in defects in pollen formation. Ba, bacula; Ep, epidermis; En, endothecium; In, intine; Lo, locules; M, mitochondria; ML, middle layer; Ne, nexine I; PM, plasmalemma; T, tapetum; TCA, TCA cycle; Te, tectum.

References

    1. Ahlers F, Bubert H, Steuernagel S, Wiermann R (2000) The nature of oxygen in sporopollenin from the pollen of Typha angustifolia L. Z Naturforsch C 55: 129–136 - PubMed
    1. Ahlers F, Lambert J, Wiermann R (2003) Acetylation and silylation of piperidine solubilized sporopollenin from pollen of Typha angustifolia L. Z Naturforsch C 58: 807–811 - PubMed
    1. Balcke GU, Bennewitz S, Bergau N, Athmer B, Henning A, Majovsky P, Jiménez-Gómez JM, Hoehenwarter W, Tissier A (2017) Multi-omics of tomato glandular trichomes reveals distinct features of central carbon metabolism supporting high productivity of specialized metabolites. Plant Cell 29: 960–983 - PMC - PubMed
    1. Bazilevsky GA, Affronti HC, Wei X, Campbell SL, Wellen KE, Marmorstein R (2019) ATP-citrate lyase multimerization is required for coenzyme-A substrate binding and catalysis. J Biol Chem 294: 7259–7268 - PMC - PubMed
    1. Bouchez O, Huard C, Lorrain S, Roby D, Balagué C (2007) Ethylene is one of the key elements for cell death and defense response control in the Arabidopsis lesion mimic mutant vad1. Plant Physiol 145: 465–477 - PMC - PubMed

Publication types

MeSH terms

LinkOut - more resources