. 2019 Sep 12;10(9):675.
doi: 10.1038/s41419-019-1925-2.

Long noncoding RNA BFAL1 mediates enterotoxigenic Bacteroides fragilis-related carcinogenesis in colorectal cancer via the RHEB/mTOR pathway

Affiliations

Long noncoding RNA BFAL1 mediates enterotoxigenic Bacteroides fragilis-related carcinogenesis in colorectal cancer via the RHEB/mTOR pathway

Yujie Bao et al. Cell Death Dis. .

Abstract

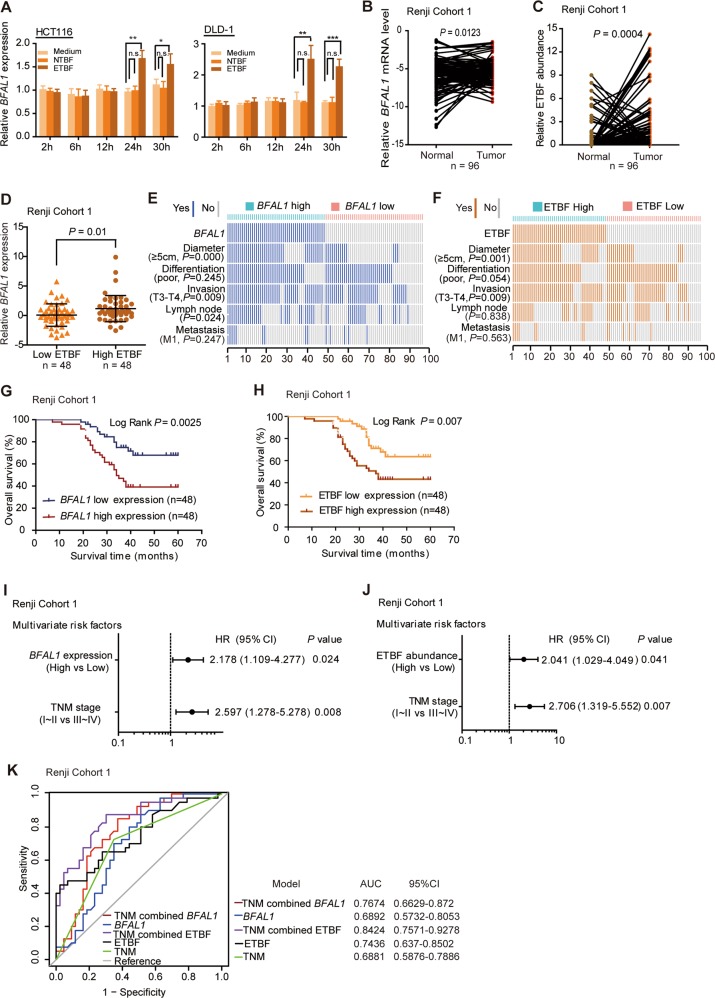
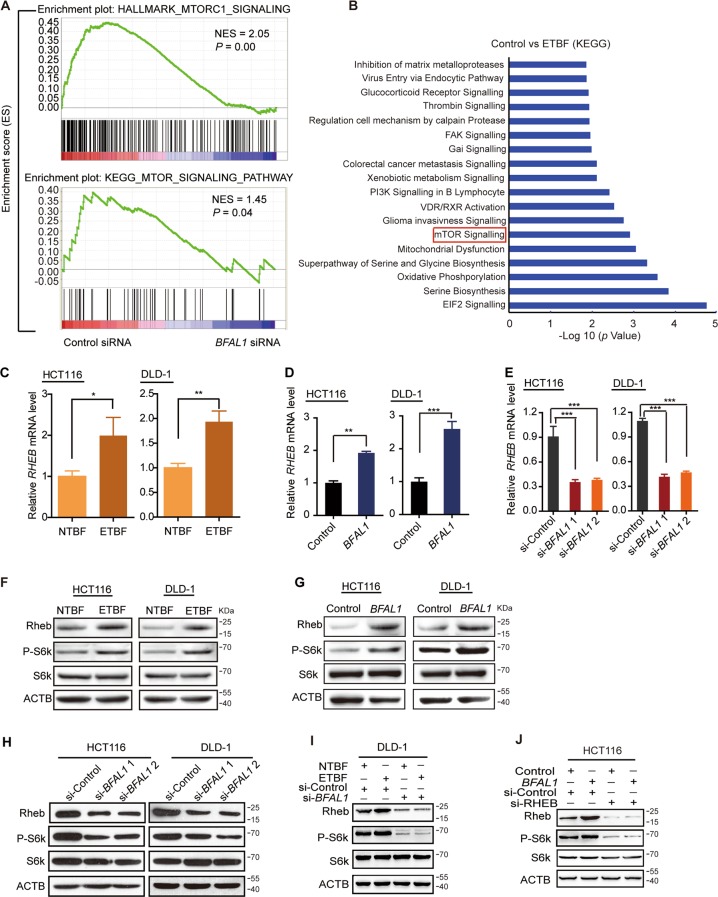
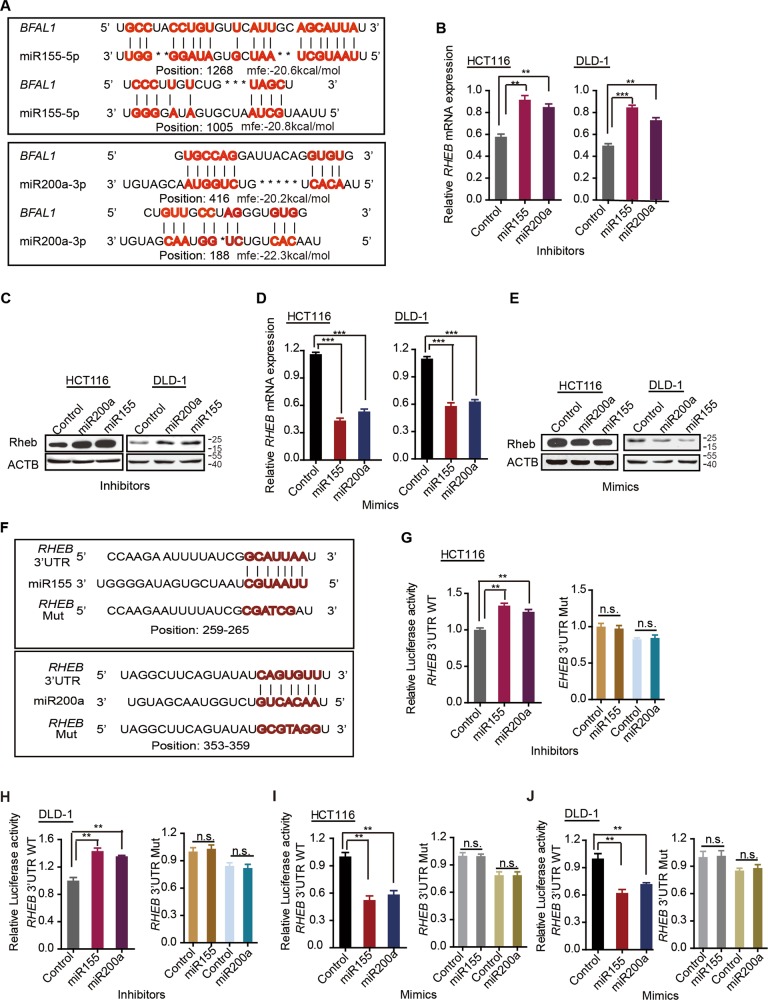
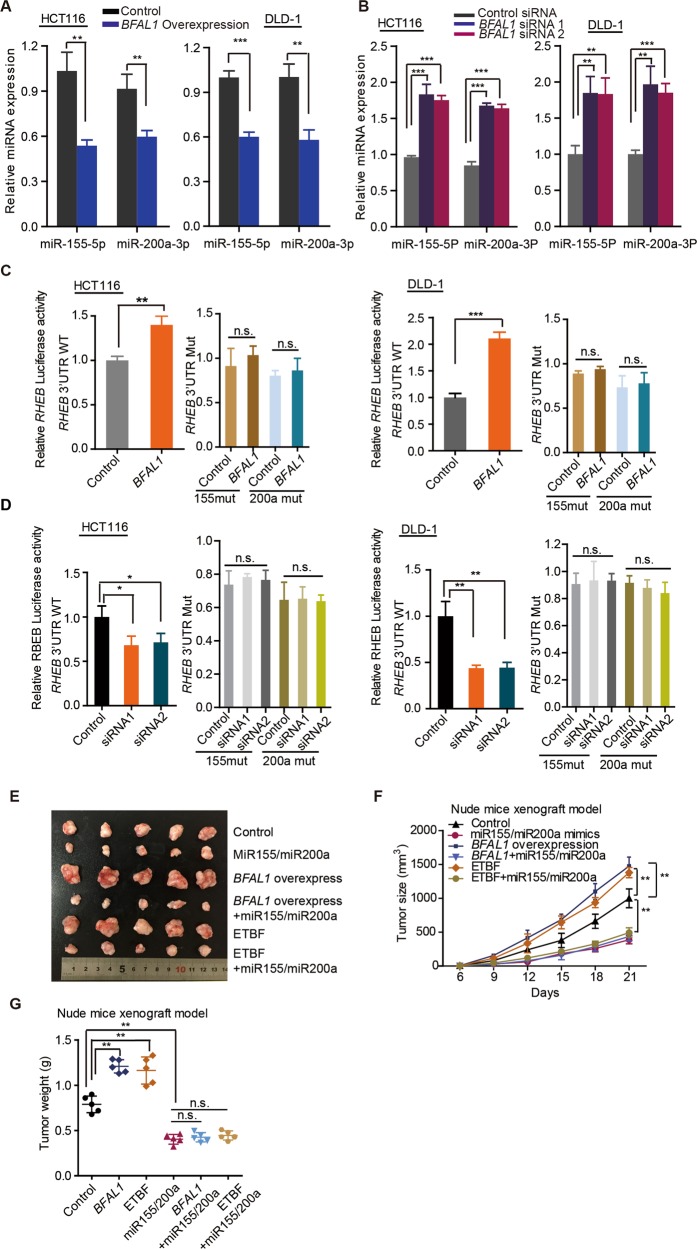
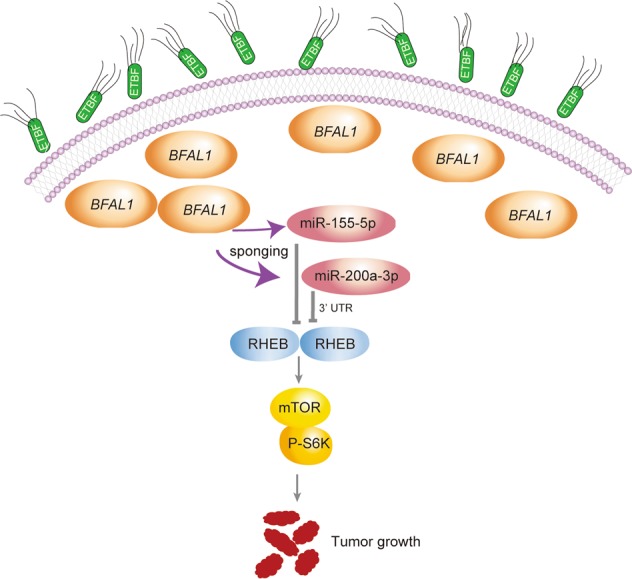
Long noncoding RNAs (lncRNAs) contribute to many steps in carcinogenesis and often serve as biomarkers or therapeutic targets for tumor diagnosis and therapy. Although the role of lncRNAs in tumor formation is becoming clear, whether lncRNAs mediate gut microbiota-induced colorectal cancer (CRC) is largely unknown. Enterotoxigenic Bacteroides fragilis (ETBF) is a well-known tumor-inducing bacterium in the human gut; however, its tumorigenic effect remains to be explored. In the present study, we revealed the mechanism by which a lncRNA participates in gut bacteria-induced carcinogenesis: Bacteroides fragilis-associated lncRNA1 (BFAL1) in CRC tissues mediates ETBF carcinogenesis. BFAL1 was highly expressed in CRC tissues compared with that in adjacent normal tissues. In vitro, BFAL1 was upregulated in ETBF-treated CRC cells. Mechanistically, ETBF promoted tumor growth via BFAL1 by activating the Ras homolog, which is the MTORC1 binding/mammalian target of the rapamycin (RHEB/mTOR) pathway. Furthermore, BFAL1 regulated RHEB expression by competitively sponging microRNAs miR-155-5p and miR-200a-3p. Clinically, both high expression of BFAL1 and high abundance of ETBF in CRC tissues predicted poor outcomes for patients with CRC. Thus, BFAL1 is a mediator of ETBF-induced carcinogenesis and may be a potential therapeutic target for ETBF-induced CRC.


Conflict of interest statement

The authors declare that they have no conflict of interest.

Figures

Fig. 1
Fig. 1. BFAL1 is upregulated by ETBF and both of them are clinicopathologically related to CRC features and outcomes.
a The mRNA level of BFAL1 in ETBF or NTBF-treated HCT116 cells and DLD-1 cells at different time points, compared with cells in a single bacterial medium (mean ± SD of three independent experiments; Student's t-test, *P < 0.05, **P < 0.01, ***P < 0.001). b Comparison of BFAL1 mRNA levels in CRC tumor tissues and pair-matched normal tissues in Renji Cohort 1 (n = 96, Student's t-test, P < 0.05). c Relative DNA abundance of ETBF in tumor tissues and pair-matched normal tissues, Renji Cohort 1 (n = 96, Student's t-test, P < 0.001). d Comparison of BFAL1 mRNA levels between high ETBF abundance tissues (n = 48) and low ETBF abundance tissues (n = 48) (Student's t-test, P < 0.05). e Comparing the tumor diameter, pathological differentiation, invasion depth, lymph node involvement, and vascular metastasis between BFAL1 high and low tumors in Renji Cohort 1. The association of different clinicopathological features was illustrated in a heatmap (statistical significance was performed using the χ2 test). f The correlation of different clinicopathological features with ETBF high- and low-abundance tumors (χ2 test). gOverall survival of patients with CRC patients with high or low BFAL1 expression in Renji cohort 1, Kaplan–Meier survival analysis (P = 0.0025; HR 2.656; 95% CI: 1.409–5.007). h Overall survival of patients with CRC with high or low ETBF abundance in Renji Cohort 1, Kaplan–Meier survival analysis (P = 0.007; HR 2.351; 95% CI: 1.281–4.462). i, j Multivariate regression analysis of Renji Cohort 1. i included all the CRC clinicopathological factors. j Excluded the factor of BFAL1 expression. k ROC analysis based on the ETBF abundance, BFAL1 expression, and TNM stage in Renji Cohort 1 (bars correspond to 95% confidence intervals)
Fig. 2
Fig. 2. ETBF exerts a biological function on CRC cell growth via BFAL1 in vitro and in vivo.
a CCK-8 assay of ETBF-treated HCT116 cells and DLD-1 cells compared with NTBF or single bacterial medium-treated cells (n = 6, ANOVA, ***P < 0.001). b CCK-8 assay of BFAL1 overexpression and control cells (n = 6, ANOVA, ***P < 0.001). c CCK-8 assay of BFAL1 knockdown in HCT116 cells and DLD-1 cells (n = 6, ANOVA, ***P < 0.001). d CCK-8 assays of ETBF-treated, BFAL1 knockdown HCT116 cells and DLD-1 cells (n = 6, ANOVA, ***P < 0.001). e Cell cycle analysis of ETBF-treated HCT116 cells and DLD-1 cells (mean ± SD of three independent experiments; ANOVA, *P < 0.05). f Cell cycle analysis of BFAL1 knockdown of HCT116 cells and DLD-1 cells (mean ± SD of three independent experiments; ANOVA, *P < 0.05). g Xenograft tumors in the nude mouse model under different treatments (n = 5). h Statistical analysis of tumor sizes (mean ± SD, n = 5, ANOVA, **P < 0.01). i Tumor weights of different mouse groups (mean ± SD, n = 5, ANOVA, *P < 0.05, **P < 0.01)
Fig. 3
Fig. 3. ETBF activates the RHEB/mTOR-signaling pathway via BFAL1 in CRC.
a GSEA analysis: enrichment hallmark of mTORC1 signaling (NES = 2.05, P = 0.00) and KEGG mTOR-signaling pathway (NES = 1.45, P < 0.05). b KEGG pathway analysis of ETBF-treated DLD-1 cells. (c) The mRNA level of RHEB in ETBF-treated HCT116 cells and DLD-1 cells compared with that in NTBF-treated cells. d The RHEB mRNA level in BFAL1-overexpressing HCT116 cells and DLD-1 cells. e The RHEB mRNA level in BFAL1-knockdown HCT116 cells and DLD-1 cells. f The protein expression of the RHEB/mTOR pathway in ETBF-treated HCT116 cells and DLD-1 cells, compared with that in NTBF-treated cells. g The expression of the RHEB/mTOR pathway in BFAL1-overexpressing HCT116 cells and DLD-1 cells. h The expression of the RHEB/mTOR pathway in BFAL1-knockdown HCT116 cells and DLD-1 cells. i The expression of the RHEB/mTOR pathway in DLD-1 cells treated with ETBF after BFAL1 knockdown. j The expression of the RHEB/mTOR pathway in HCT116 cells overexpressing BFAL1 after RHEB knockdown
Fig. 4
Fig. 4. miR-155-5p and miR-200a-3p target the RHEB 3ʹ UTR.
a The predicted binding sites of miR-155-5p and miR-200a-3p on the BFAL1 transcripts. b RHEB mRNA levels in HCT116 cells and DLD-1 cells treated with inhibitors of miR-155-5p or miR-200a-3p. c RHEB levels in HCT116 cells and DLD-1 cells transfected with inhibitors of miR-155-5p or miR-200a-3p. d RHEB mRNA levels in HCT116 cells and DLD-1 cells transfected with mimics of miR-155-5p or miR-200a-3p. e RHEB levels in HCT116 cells and DLD-1 cells transfected with mimics of miR-155-5p or miR-200a-3p. f The predicted miR-155-5p and miR-200a-3p binding sites on the RHEB 3′ UTR and the mutated sites. g, h Luciferase reporter assays were performed in HCT116 cells and DLD-1 cells transfected with inhibitors of miR-155-5p or miR-200a-3p. The luciferase reporters expressing wild-type or mutant human RHEB 3ʹ UTR were used (data represent mean ± SD of three independent experiments, ANOVA, **P < 0.01). i, j Luciferase reporter assays were performed in HCT116 cells and DLD-1 cells transfected with mimics of miR-155-5p or miR-200a-3p. The luciferase reporters expressing wild-type or mutant human RHEB 3ʹ UTR were used (data represent mean ± SD of three independent experiments, ANOVA, **P < 0.01)
Fig. 5
Fig. 5. BFAL1 regulates RHEB expression by sponging miR-155-5p and miR-200a-3p.
a The miR-155-5p and miR-200a-3p mRNA levels in HCT116 cells and DLD-1 cells overexpressing BFAL1. b The miR-155-5p and miR-200a-3p mRNA levels in HCT116 cells and DLD-1 cells with BFAL1 knockdown. c Luciferase reporter assays were performed in HCT116 cells and DLD-1 cells overexpressing BFAL1. Luciferase reporters expressing wild-type or mutant human RHEB 3ʹ UTR were used (mean ± SD of three independent experiments, ANOVA, *P < 0.05, **P < 0.01, ***P < 0.001). d Luciferase reporter assays were performed in HCT116 cells and DLD-1 cells with BFAL1 knockdown. Luciferase reporters expressing wild-type or mutant human RHEB 3ʹ UTR were used (mean ± SD of three independent experiments, ANOVA, *P < 0.05, **P < 0.01, ***P < 0.001). e Xenograft tumors in the nude mouse model under different treatments (n = 5). f Statistical analysis of tumor sizes (mean ± SD, n = 5, ANOVA, **P < 0.01). g Analysis of tumor weights in different groups (mean ± SD, n = 5, ANOVA, **P < 0.01)
Fig. 6
Fig. 6. Schematic diagram of ETBF–BFAL1 functions in CRC tumor growth.
ETBF may stimulate BFAL1 overexpression, which competitively binds with miR-155-5p and miR-200a-3p, resulting in the activation of the RHEB/mTOR pathway, ultimately promoting CRC tumor growth

Similar articles

Cited by

References

    1. Labianca R, et al. Colon Cancer. Crit. Rev. Oncol./Hematol. 2010;74:106–133. doi: 10.1016/j.critrevonc.2010.01.010. - DOI - PubMed
    1. Smith RA, Cokkinides V, Brooks D, Saslow D, Brawley OW. Cancer screening in the United States, 2010: a review of current American cancer society guidelines and issues in cancer screening. CA: A Cancer J. Cilni. 2010;60:99–119. - PubMed
    1. Siegel R, Desantis C, Jemal A. Colorectal cancer statistics, 2014. CA: A Cancer J. Clini. 2014;64:104–117. - PubMed
    1. Terzic J, Grivennikov S, Karin E, Karin M. Inflammation and colon cancer. Gastroenterology. 2010;138:2101–2114. doi: 10.1053/j.gastro.2010.01.058. - DOI - PubMed
    1. Viaud S, et al. The intestinal microbiota modulates the anticancer immune effects of cyclophosphamide. Science. 2013;342:971–976. doi: 10.1126/science.1240537. - DOI - PMC - PubMed

Publication types

MeSH terms