. 2019 Sep 12;10(9):680.
doi: 10.1038/s41419-019-1921-6.

ΔNp63α suppresses cells invasion by downregulating PKCγ/Rac1 signaling through miR-320a

Affiliations

ΔNp63α suppresses cells invasion by downregulating PKCγ/Rac1 signaling through miR-320a

Amjad A Aljagthmi et al. Cell Death Dis. .

Abstract

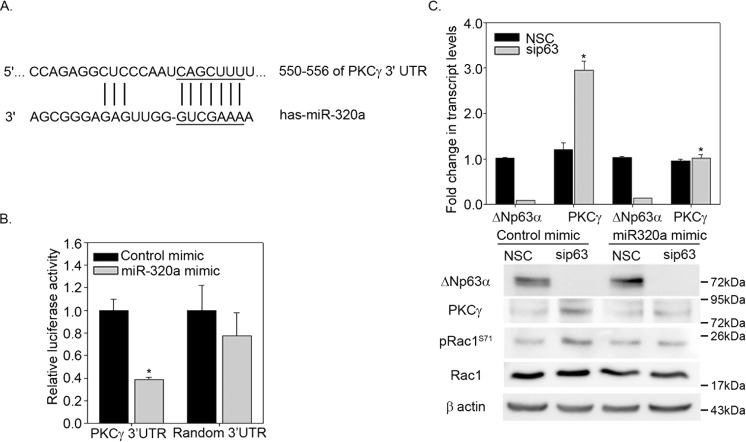
ΔNp63α, a member of the p53 family of transcription factors, is overexpressed in a number of cancers and plays a role in proliferation, differentiation, migration, and invasion. ΔNp63α has been shown to regulate several microRNAs that are involved in development and cancer. We identified miRNA miR-320a as a positively regulated target of ΔNp63α. Previous studies have shown that miR-320a is downregulated in colorectal cancer and targets the small GTPase Rac1, leading to a reduction in noncanonical WNT signaling and EMT, thereby inhibiting tumor metastasis and invasion. We showed that miR-320a is a direct target of ΔNp63α. Knockdown of ΔNp63α in HaCaT and A431 cells downregulates miR-320a levels and leads to a corresponding elevation in PKCγ transcript and protein levels. Rac1 phosphorylation at Ser71 was increased in the absence of ΔNp63α, whereas overexpression of ΔNp63α reversed S71 phosphorylation of Rac1. Moreover, increased PKCγ levels, Rac1 phosphorylation and cell invasion observed upon knockdown of ΔNp63α was reversed by either overexpressing miR-320a mimic or Rac1 silencing. Finally, silencing PKCγ or treatment with the PKC inhibitor Gö6976 reversed increased Rac1 phosphorylation and cell invasion observed upon silencing ΔNp63α. Taken together, our data suggest that ΔNp63α positively regulates miR-320a, thereby inhibiting PKCγ expression, Rac1 phosphorylation, and cancer invasion.


Conflict of interest statement

The authors declare that they have no conflict of interest.

Figures

Fig. 1
Fig. 1. ΔNp63α positively regulates miR-320a.
a A431 and HaCaT cells were transfected with non-silencing control siRNA (NSC) or siRNA specific to p63. Total RNA was extracted and ΔNp63α transcript level was measured by TaqMan based qRT-PCR. y-Axis represents the fold change in p63 transcript levels relative to NSC-transfected cells. Immunoblots of p63 in A431 and HaCaT cells transfected are shown in the bottom panels. b TaqMan based qRT-PCR was used to quantify miR-320a levels from the experiment described in (a). c H1299 and SW480 cells null for p63 were transfected with empty vector (EV) control or expression plasmid encoding ΔNp63α. Transcripts were quantified by qRT-PCR (upper panel) while protein levels were confirmed using immunoblot analyses (lower panel). d Taqman based qRT-PCR was used to quantify miR-320a levels from the experiment described in (c). Immunoblot with β-actin was performed to confirm equivalent protein loading. Error bars represent standard deviation. Significant changes (P ≤ 0.05) relative to controls are indicated with an asterisk. e H1299 cells were co-transfected with p63-BS-Luc reporter construct along with either empty vector or increasing concentrations of ΔNp63α as indicated. Cells were subjected to dual luciferase assay at 24 h after transfection. The y-axis represents fold change in relative luciferase units (RLU) compared with cells transfected with empty vector. RLU values are shown as means ± S.E.M. from n = 3 experiments
Fig. 2
Fig. 2. ΔNp63α negatively regulates Rac1 phosphorylation.
a A431 and HaCaT cells were transfected with non-silencing control siRNA (NSC) or siRNA targeting p63. b H1299 and SW480 cells were transfected with empty vector (EV) control or expression plasmid encoding ΔNp63α. The change in transcript and protein levels of Rac1 were measured by TaqMan based qRT-PCR (* indicates P ≤ 0.05) and immunoblot analysis, respectively. Error bars represent standard deviation. c A431 and HaCaT cells were transfected with nonsilencing control siRNA (NSC) or siRNA against p63. d Caco2 and SW480 cells were transfected with empty vector control or ΔNp63α and subjected to immunoblot analysis for the indicated proteins. The change in Rac1 protein expression was measured by immunoblot analysis using Rac1 and pRac1 (S71) antibodies as indicated. Immunoblot with β-actin was performed to confirm equivalent protein loading
Fig. 3
Fig. 3. Knockdown Rac1 reversed increased cell invasion observed upon ΔNp63α knockdown.
A431 cells were transfected with NSC siRNA, p63 siRNA, and/or Rac1 siRNA as indicated. At 24 h after the second round of transfection, 8.0 × 104 cells were subjected to Matrigel-based invasion assay (a) and the number of invading cells was quantitated after 21 h (b). The y-axis indicates the average number of cells invaded per field. Error bars represent standard deviation. Significant changes (P ≤ 0.05) relative to NSC controls are indicated with an asterisk. c The change in protein expression was measured by immunoblot analysis using Rac1 and pRac1 (S71) antibodies to measure unphosphorylated and phosphorylated levels of Rac1, respectively. Immunoblot with β-actin was performed to confirm equivalent protein loading
Fig. 4
Fig. 4. Overexpression of a miR-320a mimic rescues the effect of ΔNp63α knockdown on Rac1 phosphorylation and cell invasion.
A431 cells were transfected with either non-silencing control (NSC) or sip63 in conjunction with a negative control mimic or miR-320a mimic for two rounds of transfections. a The change in indicated protein levels were analyzed via immunoblotting with p63, Rac1, and pRac1 (S71) antibodies as indicated. Immunoblot with β-actin was performed to confirm equivalent protein loading. Twenty four hour after the second of transfection, 8.0 × 104 cells were subjected to Matrigel-based invasion assay (b) and the number of invading cells was quantitated after 21 h (c). The y-axis indicates the average number of cells invaded per field +1 standard deviation. Significant changes (P ≤ 0.05) relative to cells transfected with NSC and control mimic are indicated with an asterisk
Fig. 5
Fig. 5. Negative regulation of PKCγ expression by ΔNp63α is dependent on miR-320a.
a A putative miR-320a binding site in PKCγ 3′UTR identified by Target Scan. b A431 cells were co-transfected with a luciferase reporter carrying PKCγ 3′UTR or a random 3′UTR along with control mimic or miR-320a mimic. At 24 h post transfection, a luciferase reporter assays were performed. y-Axis represents the relative change in the luciferase activity. Significant changes (P ≤ 0.05) relative to control mimic are indicated with an asterisk. c HaCaT cells were transfected with either NSC siRNA or p63 siRNA in conjunction with a negative control mimic or miR-320a mimic as indicated. Total RNA was extracted and transcript levels of ΔNp63α and PKCγ was measured by Taqman based qRT-PCR (upper panel). y-Axis represents the fold change in ΔNp63α and PKCγ transcript levels relative to NSC-transfected cells. Error bars indicate standard deviation. Significant changes (P ≤ 0.05) relative to respective NSC controls are indicated with an asterisk. The change in indicated protein levels were measured analyzed via immunoblotting with p63, PKCγ, Rac1, and pRac1 (S71) antibodies as indicated (lower panel). Immunoblot with β-actin was performed to confirm equivalent protein loading
Fig. 6
Fig. 6. PKCγ knockdown reversed the effect of ΔNp63α knockdown on pRac1 and cell invasion.
A431 cells were transfected with either non-silencing control (NSC), sip63 alone, siPKCγ alone, or sip63 in conjugation with siPKCγ for two rounds of transfections. a At 24 h post transfection, the change in transcript levels of PKCγ was measured by TaqMan based qRT-PCR. y-Axis represents the fold change in PKCγ transcript levels relative to NSC-transfected cells. Error bars represent standard deviation. b The change in indicated protein levels were analyzed via immunoblotting with p63, Rac1 and pRac1 (S71) antibodies as indicated. Immunoblot with β-actin was performed to confirm equivalent protein loading. c Quantification of pRac1 levels. Relative protein values are shown as means ± S.E.M. from n = 3 experiments. Twenty four hour after the second round of transfection, 8.0 × 104 cells were subjected to Matrigel-based invasion assay (d) and the number of invading cells was quantitated after 21 h (e). The y-axis indicates the average number of cells invaded per field +1 standard deviation. Significant changes (P ≤ 0.05) relative to NSC controls are indicated with an asterisk
Fig. 7
Fig. 7. ΔNp63α inhibits Rac1 phosphorylation and invasion by reducing PKCγ levels.
A431 cells were transfected with either NSC siRNA or siRNA targeting p63 for two rounds of transfections followed by treatment with DMSO or Gӧ6976 for 2 h as indicated. a The change in indicated protein levels were analyzed via immunoblotting with p63, Rac1, and pRac1 (S71) antibodies as indicated. Immunoblot with β-actin was performed to confirm equivalent protein loading. b The fold change in pRac1 levels relative to NSC DMSO-treated cells levels. Relative protein values are shown as means ± S.E.M. from n = 3 experiments. c At 24 h after the second round of transfection, 8.0 × 104 cells were subjected to Matrigel-based invasion assay (c) and the number of invading cells was quantitated after 21 h. d The y-axis indicates the average number of cells invaded per field +1 standard deviation. Significant changes (P ≤ 0.05) relative to NSC controls are indicated with an asterisk. e A431 cells were incubated with DMSO or 100 nM of PMA for the indicated times. The change in indicated protein levels were analyzed via immunoblotting with Rac1 and pRac1 (S71) antibodies as indicated. f A431 cells were treated with DMSO or Gö6976 for 2 h and followed by incubation with 100 nM of PMA for 15 min. The change in indicated protein levels were analyzed via immunoblotting as indicated. g A431 cells were transfected with nonsilencing control siRNA (NSC) or siRNA specific to PKCγ followed by treatment with DMSO or 100 nM PMA for 15 min. Total RNA was extracted and transcript levels of PKCγ was analyzed by qRT-PCR. y-Axis represents the fold change in PKCγ transcript levels relative to NSC-transfected cells. The change in Rac1 and pRac1 levels was measured by immunoblot analysis (h). Immunoblot with β-actin was performed to confirm equivalent protein loading
Fig. 8
Fig. 8. Gene-expression analysis of ΔNp63α and miR-320a in correlation with PKCγ expression among human cancers.
a TCGA Pan-Cancer dataset were used to analyze ΔNp63α expression in 8885 primary cancer cases from 32 tumor locations. b Correlation of ΔNp63α and PKCγ levels within the cervical squamous cell carcinomas (CESC) dataset. c Expression of ΔNp63α and PKCγ in 296 CESC samples divided into high and low categories for each mRNA using StepMiner algorithm. d Kaplan–Meier curve and log-rank test for the survival of 100 CESC patients categorized as either low ΔNp63α or miR-320a with high PKCγ (n = 32) or high ΔNp63α and miR-320a with low PKCγ (n = 68). e Model representing the regulation of Rac1 phopshorylation by ΔNp63α via the miR-320a/PKCγ axis

References

    1. Mills AA, et al. p63 is a p53 homologue required for limb and epidermal morphogenesis. Nature. 1999;398:708–713. doi: 10.1038/19531. - DOI - PubMed
    1. Yang A, et al. p63 is essential for regenerative proliferation in limb, craniofacial and epithelial development. Nature. 1999;398:714–718. doi: 10.1038/19539. - DOI - PubMed
    1. Shimada A, et al. The transcriptional activities of p53 and its homologue p51/p63: similarities and differences. Cancer Res. 1999;59:2781–2786. - PubMed
    1. Hill NT, et al. 1α, 25-Dihydroxyvitamin D(3) and the vitamin D receptor regulates ΔNp63α levels and keratinocyte proliferation. Cell Death Dis. 2015;6:e1781. doi: 10.1038/cddis.2015.148. - DOI - PMC - PubMed
    1. Stacy AJ, Craig MP, Sakaram S, Kadakia M. ΔNp63α and microRNAs: leveraging the epithelial-mesenchymal transition. Oncotarget. 2017;8:2114–2129. doi: 10.18632/oncotarget.13797. - DOI - PMC - PubMed

Publication types

MeSH terms