. 2019 Sep 12;10(1):4148.
doi: 10.1038/s41467-019-11918-y.

Discovery and preclinical evaluation of anti-miR-17 oligonucleotide RGLS4326 for the treatment of polycystic kidney disease

Affiliations

Discovery and preclinical evaluation of anti-miR-17 oligonucleotide RGLS4326 for the treatment of polycystic kidney disease

Edmund C Lee et al. Nat Commun. .

Abstract

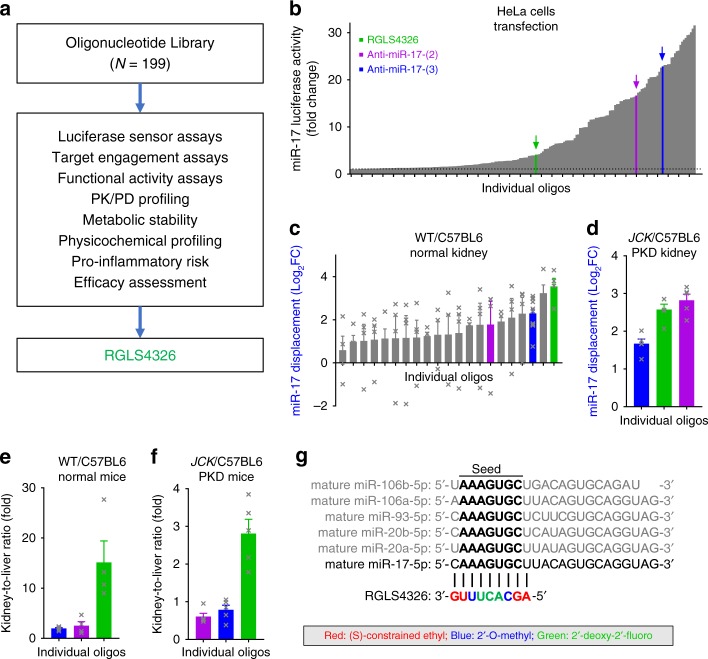
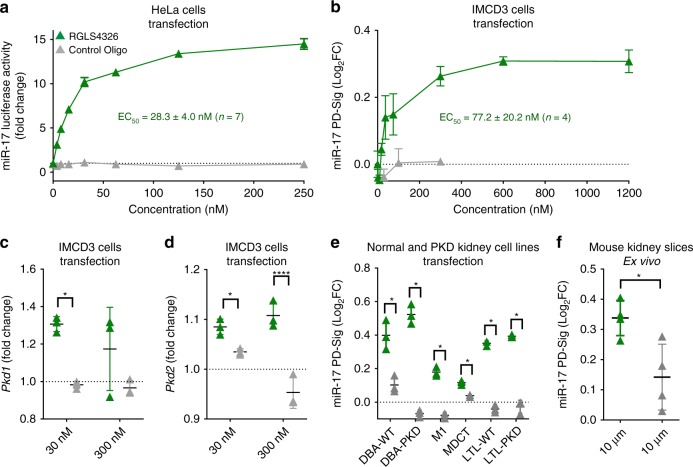
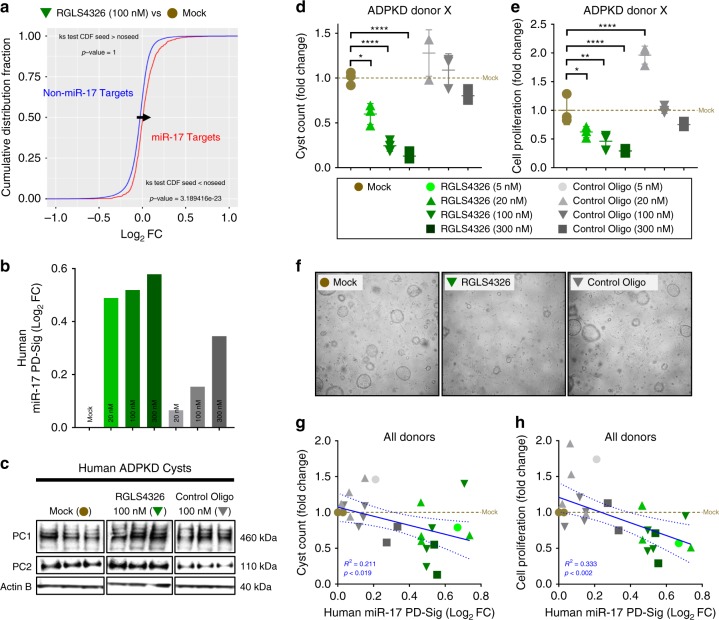
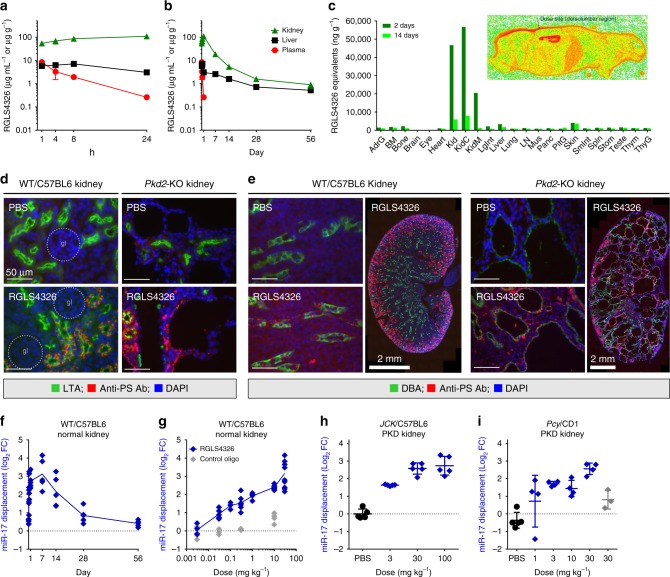
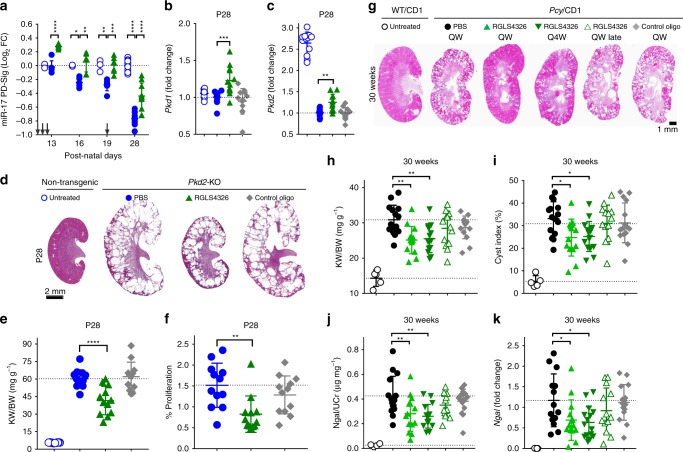
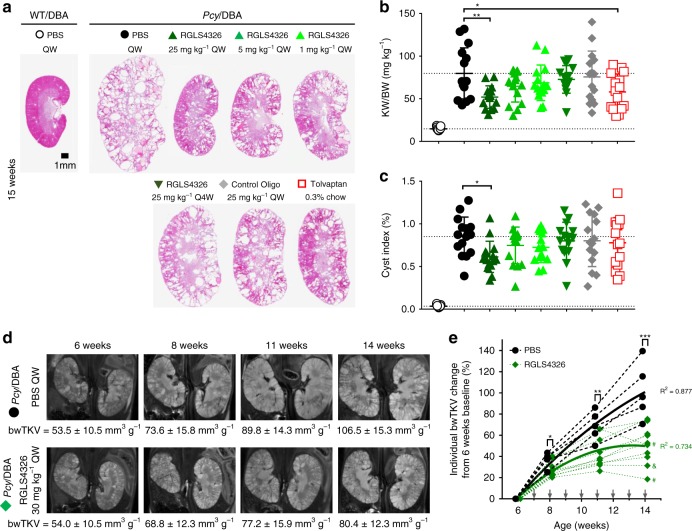
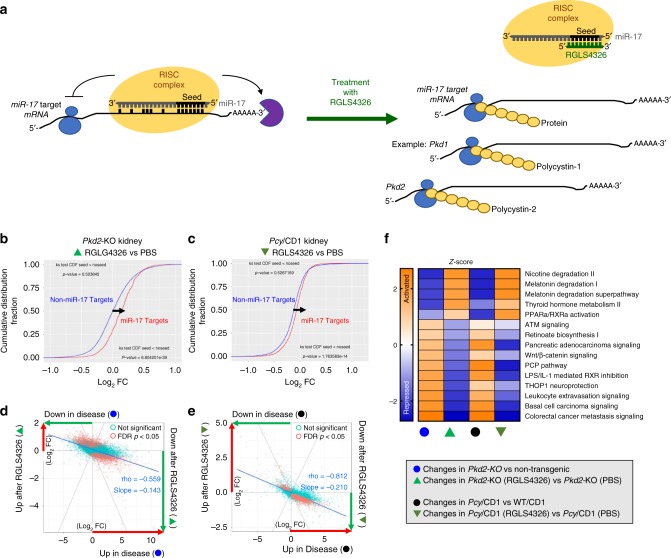
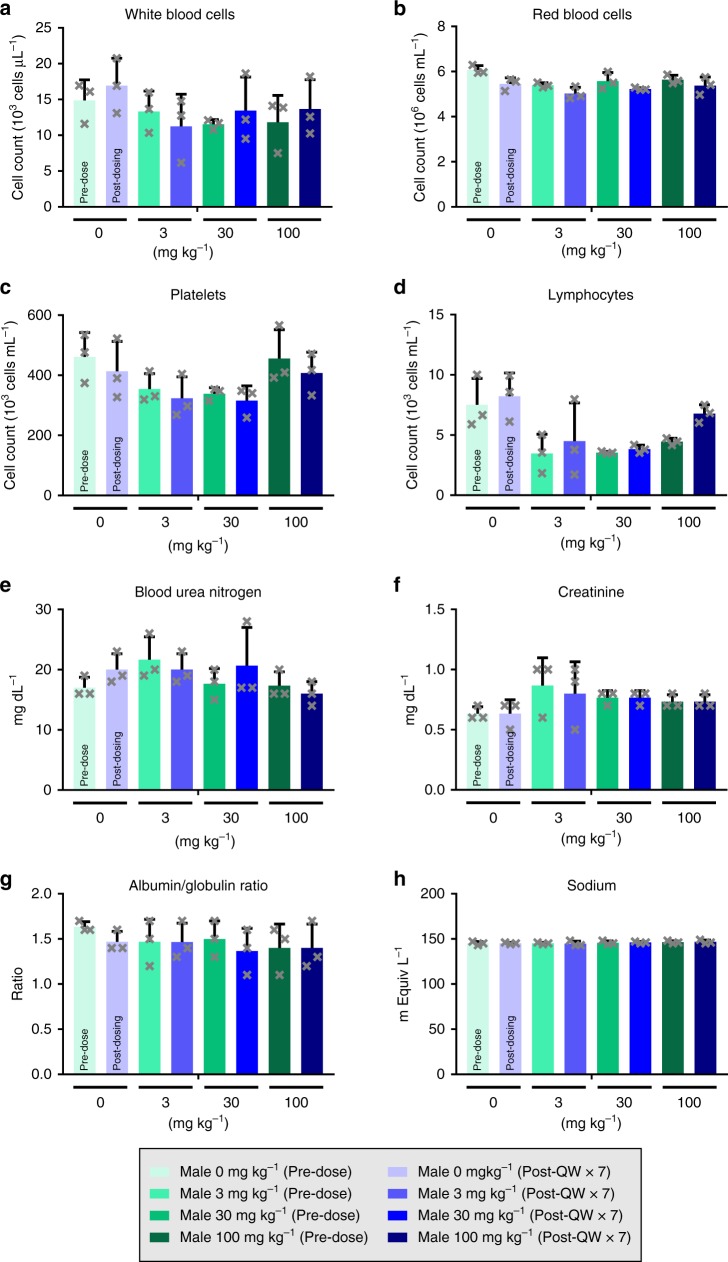
Autosomal dominant polycystic kidney disease (ADPKD), caused by mutations in either PKD1 or PKD2 genes, is one of the most common human monogenetic disorders and the leading genetic cause of end-stage renal disease. Unfortunately, treatment options for ADPKD are limited. Here we report the discovery and characterization of RGLS4326, a first-in-class, short oligonucleotide inhibitor of microRNA-17 (miR-17), as a potential treatment for ADPKD. RGLS4326 is discovered by screening a chemically diverse and rationally designed library of anti-miR-17 oligonucleotides for optimal pharmaceutical properties. RGLS4326 preferentially distributes to kidney and collecting duct-derived cysts, displaces miR-17 from translationally active polysomes, and de-represses multiple miR-17 mRNA targets including Pkd1 and Pkd2. Importantly, RGLS4326 demonstrates a favorable preclinical safety profile and attenuates cyst growth in human in vitro ADPKD models and multiple PKD mouse models after subcutaneous administration. The preclinical characteristics of RGLS4326 support its clinical development as a disease-modifying treatment for ADPKD.


Conflict of interest statement

J.R.A. and V.P. have applied for a patent related to the treatment of polycystic kidney disease using miR-17 inhibitors. The Patel lab has a sponsored research agreement with Regulus Therapeutics. All authors, apart from A.F., M.Y., and V.P. are current or former employees of, or consultants for, Regulus Therapeutics.

Figures

Fig. 1
Fig. 1
Discovery of RGLS4326, a chemically modified oligonucleotide inhibitor of miR-17. a Screening cascade used for the discovery of RGLS4326. b Over 190 anti-miR-17 oligonucleotides of diverse chemical designs were screened at 10 μM in a miR-17 HeLa cell luciferase assay and plotted in ascending order of potency (n = 1/oligonucleotides). Selected oligonucleotides including RGLS4326 (green) are highlighted for illustration purposes. c A subset of oligonucleotides was tested in WT/C57BL6 mice for their ability to engage and displace miR-17 in the kidney 7 days after a single 30 mg kg−1 SC dose (n = 4). d A smaller set of oligonucleotides were further tested in the JCK/C57BL6 PKD model for miR-17 target engagement (n = 5). ef Preferential distribution to kidney over liver 7 days after a single 30 mg kg−1 SC dose of selected oligonucleotides in WT/C57BL6 (n = 4) and JCK/C57BL6 mice (n = 5) are shown. g Chemical modifications, base sequence, and corresponding complementarity to the miR-17 family of mature miRNAs for RGLS4326 is illustrated. Error bars represent standard error of means. Source data for Fig. 1bf is provided in Source data files
Fig. 2
Fig. 2
RGLS4326 inhibits miR-17 and de-represses direct miR-17 targets. a RGLS4326 (green triangle) dose-responsively inhibits miR-17 in HeLa cell luciferase assay 24 h after transfection, with an EC50 value of 28.3 ± 4.0 nM (mean ± standard deviation, n = 7 independent experiments). b RGLS4326 dose-responsively de-represses multiple miR-17 target genes (as measured by miR-17 PD-Sig) in mouse IMCD3 cells 24 h after transfection, with an EC50 value of 77.2 ± 20.2 nM (n = 4 independent experiments). cd RGLS4326 treatment results in de-repression of the direct miR-17 target genes, Pkd1 and Pkd2 in IMCD3 cells (n = 3). e RGLS4326, but not control oligo, functionally inhibited miR-17 and de-repressed miR-17 PD-Sig in six cell lines derived from normal (DBA-WT, M1, MDCT, LTL-WT) or PKD (DBA-PKD and LTL-PKD) mouse kidneys after 24 h treatment by transfection at 30 nM (n = 3) and in f normal mouse kidney tissue slice culture after 72 h ex vivo incubation at 10 μM (n = 4). Control oligo (grey triangle) containing the same chemical-modification, length, and design as RGLS4326, but different base pair sequence, was used as a negative control. Error bars represent standard deviations. *p < 0.05, ****p < 0.0001. One-way ANOVA, Dunnette’s multiple comparison test. Source data for Fig. 2af is provided in Source data files
Fig. 3
Fig. 3
RGLS4326 suppresses the growth of primary human ADPKD cysts in vitro. a Primary cyst cultures derived from human ADPKD donors were transfected with RGLS4326 at 100 nM for 24 h and harvested for RNA-seq analysis. Kolmogorov-Smironov test statistics comparing the cumulative distribution of global mRNA changes between RGLS4326-treated (inverted green triangle) vs. mock-treated (brown circle) samples indicated significant de-repression of predicted miR-17 target genes (as defined by TargetScanHuman v7.1) after RGLS4326 treatment. b For each subsequent experiment, functional inhibition of miR-17 was assessed by measuring de-repression of human miR-17 PD-Sig in representative cyst samples (n = 1/treatment/dose) after 24 h transfection with RGLS4326 (shades of green) or control oligo (shades of grey) and prior to further culturing in 3D Matrigel for an additional 8 days. c Western blot analysis demonstrating increased expression of polycystin-1 (PC1) and polycystin-2 (PC2) 72 h following RGLS4326 treatment (n = 3). de Quantification and (f) representative images of 3D cyst formation showing a reduction in cyst count and proliferation 9 days following initial RGLS4326 treatment (n = 3). gh Inhibition of miR-17 as measured by miR-17 PD-Sig correlates with anti-cyst and anti-proliferation activity (n = 4 independent experiments among 2 donors). R2, p-values and 95% confidence interval limits (dotted lines) from corresponding linear regression models were shown. Error bars represent standard deviations. *p < 0.05, **p < 0.01, ****p < 0.0001. One-way ANOVA, Dunnette’s multiple comparison test. Source data for Fig. 3be, and gh is provided in Source data files
Fig. 4
Fig. 4
Pharmacokinetic, tissue distribution and pharmacodynamic profile of RGLS4326. ab Kidney (green triangle), liver (black square) and plasma (red circle) exposures-vs.-time profiles of RGLS4326 following a single 30 mg kg−1 SC dose in WT/C57BL6 mice (n = 5/group). c Tissue distribution profile of RGLS4326 showing preferential kidney distribution based on quantitative whole-body autoradiography of [35S]-RGLS4326-derived radioactivity in male WT/CD1 mice 2 days (dark green) and 14 days (light green) after a single SC dose of RGLS4326 at 30 mg kg−1 and target radioactivity of 100 μCi kg−1 (n = 1/timepoint). Representative whole-body autoradioluminogram showing tissue distribution of radioactivity at Day 2 is shown. Red indicates intensity of radioactivity detected. de WT/C57BL6 (n = 3) or Pkd2-KO mice (n = 3) were dosed SC with PBS or 20 mg kg−1 of RGLS4326 on postnatal day (P)21, P22 and P23, and kidneys were harvested on P26. Kidney sections were co-stained with LTA (proximal tubules marker) or DBA (collecting ducts marker), anti-PS antibody (antibody labels RGLS4326) and DAPI. Representative merged immunofluorescence images of stained kidney sections demonstrating delivery of RGLS4326 to (d) proximal tubules and (e) collect duct cyst cells are shown. No glomerulus localization of RGLS4326 was observed in all mice tested. f Kidney target engagement-vs.-time profile of RGLS4326 showed kidney target engagement (blue diamond) peaked at 7 days, and continued through to at least 14 days, after a single 30 mg kg−1 SC dose in WT/C57BL6 mice (n = 5/group). g Dose-responsive target engagement of miR-17 in kidney tissues 7 days following a single SC dose of RGLS4326 at 0.003 (n = 4), 0.03 (n = 8), 0.1 (n = 4), 0.3 (n = 8), 3 (n = 4), 10 (n = 8), and 30 mg kg−1 (n = 10) in WT/C57BL6 mice. hi RGLS4326 treatment dose-responsively engaged miR-17 in polycystic kidneys of two PKD mouse models 7 days after a single SC dose compare to PBS (closed black circle). RGLS4326 was dosed at 3, 30, and 100 mg kg−1 in JCK/C57BL6 mice (n = 5), and at 1, 3, 10, 30 mg kg−1 in Pcy/CD1 mice (n = 4). Control oligo (grey) was used as a negative control. Error bars represent standard deviations. Glomerulus, gl (dotted circle). Scale bars, 50 μm (except as specified in e, 2 mm). Source data for Fig. 4ac and fi is provided in Source data files
Fig. 5
Fig. 5
RGLS4326 confers efficacy in Pkd2-KO and Pcy/CD1 mouse models. af Pkd2-KO mice were dosed SC with PBS (closed blue circle) or 20 mg kg−1 of RGLS4326 (green triangle) or control oligo (grey diamond) at P10, P11, P12, and P19. Kidneys were harvested on P13, P16, P19 (n = 6/group), and P28 (n = 12), and total RNA was extracted. Age-matched untreated non-transgenic (UNT) control mice were also included for analysis (open blue circle; n = 3 for P13, P16, and P19 and n = 12 for P28). a Pkd2-KO kidneys show low level of miR-17 PD-sig, indicative of higher baseline miR-17 functional activity compared to UNT. RGLS4326 treatment de-repressed miR-17 PD-Sig. Arrows indicate dosing days. bc RGLS4326 treatment results in de-expression of Pkd1 and Pkd2. d Representative H&E staining of kidney sections from each treatment groups at the end of the study on P28. e Kidney-weight-to-body-weight ratio (KW/BW), as well as (f) number of proliferating cyst epithelial cells (as stained by anti-pHH3 antibody) were reduced after RGLS4326 treatment. gk Five-weeks-old male Pcy/CD1 mice were dosed SC once-weekly (QW) with PBS (closed black circle) or 25 mg kg−1 of RGLS4326 (green triangle) or control oligos (grey diamond), or once-every-4-weeks (Q4W) with 25 mg kg−1 of RGLS4326 (inverted green triangle). An additional group of Pcy/CD1 mice were dosed SC once-weekly with 25 mg kg−1 of RGLS4326 starting at 15-weeks of age (QW late; open green triangle). All Pcy/CD1 mice (n = 15/group) were euthanized at 30-weeks of age, and kidney and urine samples were harvested. g Representative H&E staining of kidney sections from each treatment groups at the end of the study are shown. h KW/BW ratio, (i) cyst index, (j) urine Ngal protein, and (k) kidney Ngal mRNA expression were significantly reduced in Pcy/CD1 mice following RGLS4326 treatment. Corresponding values from wild-type controls (n = 5) are shown for reference (open black circle). Error bars represent standard deviations. *p < 0.05, **p < 0.01, ***p < 0.001, ****p < 0.0001. One-way ANOVA, Dunnette’s multiple comparison test. Scale bars, 2 mm (d) and 1 mm (g). Source data for Fig. 5ac, e, f, and hk is provided in Source data files
Fig. 6
Fig. 6
RGLS4326 confers efficacy in Pcy/DBA mouse model. ac Six-weeks-old Pcy/DBA mice were dosed SC QW with PBS (closed black circle), or 25 mg kg−1 (dark green triangle), 5 mg kg−1 (green triangle) or 1 mg kg−1 of RGLS4326 (light green triangle), or Q4W with 25 mg kg−1 of RGLS4326 (inverted green triangle), or QW with 25 mg kg−1 of control oligos (grey diamond). Another group of 6-weeks-old Pcy/DBA mice was treated with 0.3% tolvaptan via diet ad libitum (open red square). All Pcy/DBA mice (n = 15/group) were euthanized at 15-weeks of age, and kidneys were harvested. a Representative H&E staining of kidney sections from each treatment groups are shown. b KW/BW ratio and (c) cyst index were significantly reduced in Pcy/DBA mice following weekly RGLS4326 treatment. Tolvaptan conferred efficacy based on KW/BW ratio, but not cyst index. Corresponding values from PBS-treated WT/DBA mice are shown for reference (open black circle, n = 5). d Baseline body-weight-adjusted total kidney volume (bwTKV) were obtained from 6-weeks-old male Pcy/DBA mice by T2-weighted MRI and used for treatment group randomization. Assigned mice were dosed SC QW with PBS (n = 5; closed black circle), or 30 mg kg−1 RGLS4326 (n = 10; green diamond). Representative MRI images and mean bwTKV ± standard deviations from 6-, 8-, 11-, and 14-week-old mice from each treatment groups are shown. e Percentage change of individual bwTKV changes from 6 weeks baseline values for each timepoints are shown. The bwTKV-vs.-time profiles for each treatment groups were fitted with second-order polynomial regression for illustration purposes. R2 values are shown. Arrows indicate dosing days. Pcy/DBA mice with stabilized and reduced bwTKV from last measurements at the end of the study are indicated by & and #, respectively. Error bars represent standard deviations. *p < 0.05, **p < 0.01, ***p < 0.001. One-way ANOVA, Dunnette’s multiple comparison test. Scale bar, 1 mm. Source data for Fig. 6b, c and e is provided in Source data files
Fig. 7
Fig. 7
RGLS4326 improves expression of dysregulated gene networks in PKD models. a Schematic illustration of RGLS4326-mediated inhibition of miR-17. RGLS4326 displaces miR-17 from the translationally active polysome fractions and de-represses miR-17 target genes including Pkd1 and Pkd2 and their encoded proteins PC1 and PC2. be RNA-seq analysis was performed to compare mRNA expression profiles between kidneys from non-transgenic (n = 12), PBS-treated Pkd2-KO (n = 8), RGLS4326-treated Pkd2-KO (n = 11), and control oligo-treated Pkd2-KO mice (n = 8). RNA-seq analysis was also performed from wild-type (n = 2), PBS-treated Pcy/CD1 (n = 4), RGLS4326-treated Pcy/CD1 (n = 4), and control oligo-treated Pcy/CD1 mice (n = 3). bc Kolmogorov-Smironov test statistics comparing the cumulative distribution of global mRNA changes between RGLS4326-treated vs. PBS-treated kidney samples indicated significant de-repression of predicted miR-17 target genes (as defined by TargetScanMouse v7.1) after RGLS4326 treatment in Pkd2-KO (green triangle) and Pcy/CD1 model (inverted green triangle). de Comparative differential expression analysis demonstrated a clear trend in global transcriptomic changes where dysregulated gene expression in Pkd2-KO (blue circles) and Pcy/CD1 kidneys (black circles) (x-axis) were improved after RGLS4326 treatment (y-axis). Rho-values and slopes from corresponding Spearman’s correlations are shown. RGLS4326 treatment improves the expression of 994 genes in Pkd2-KO (n = 11) and 658 genes in Pcy/CD1 kidney (n = 4) (FDR < 0.05 and Log2FC > ∣0.5∣). f Top 15 pathways as predicted by the ingenuity pathway analysis software (based on ∣z-scores∣) potentially responsible for the gene changes are shown. Positive z-scores (shades of orange) indicate activation, while negative z-scores (shades of blue) indicate repression. Source data for Fig. 7f is provided in Source data files
Fig. 8
Fig. 8
RGLS4326 does not cause hematopoietic or kidney toxicity in monkeys. Male cynomolgus monkeys (n = 3/group) were dosed SC QW with 0, 3, 30, or 100 mg kg−1 of RGLS4326 for 7 consecutive weeks (QWx7). Prior to the study, animals were acclimated to the study room for 14 days. On the final day of acclimation, animals weighed between 2.8 and 6.1 kg and were 3 to 6 years of age. Blood was collected for hematology and serum chemistry analysis before and at 48 h after the last dose. Specimens were analyzed using an Advia 120 automated hematology analyzer and an AU680 chemistry analyzer. Comparison between pre-dose and post-QWx7 values for each treatment groups indicated no hematological abnormalities (ad) and no renal toxicity (eh) following RGLS4326 treatment. Error bars represent standard deviations. Source data for Fig. ah is provided in Source data files

References

    1. Torres VE, Harris PC. Autosomal dominant polycystic kidney disease: the last 3 years. Kidney Int. 2009;76:149–168. doi: 10.1038/ki.2009.128. - DOI - PMC - PubMed
    1. Harris PC, Torres VE. Genetic mechanisms and signaling pathways in autosomal dominant polycystic kidney disease. J. Clin. Invest. 2014;124:2315–2324. doi: 10.1172/JCI72272. - DOI - PMC - PubMed
    1. Chapman AB, et al. Autosomal-dominant polycystic kidney disease (ADPKD): executive summary from a Kidney Disease: Improving Global Outcomes (KDIGO) Controversies Conference. Kidney Int. 2015;88:17–27. doi: 10.1038/ki.2015.59. - DOI - PMC - PubMed
    1. Baek D, et al. The impact of microRNAs on protein output. Nature. 2008;455:64–71. doi: 10.1038/nature07242. - DOI - PMC - PubMed
    1. Bartel DP. MicroRNAs: genomics, biogenesis, mechanism, and function. Cell. 2004;116:281–297. doi: 10.1016/S0092-8674(04)00045-5. - DOI - PubMed

Publication types

MeSH terms