. 2019 Sep 12;10(1):4147.
doi: 10.1038/s41467-019-12099-4.

Differentiation but not ALS mutations in FUS rewires motor neuron metabolism

Affiliations

Differentiation but not ALS mutations in FUS rewires motor neuron metabolism

Tijs Vandoorne et al. Nat Commun. .

Abstract

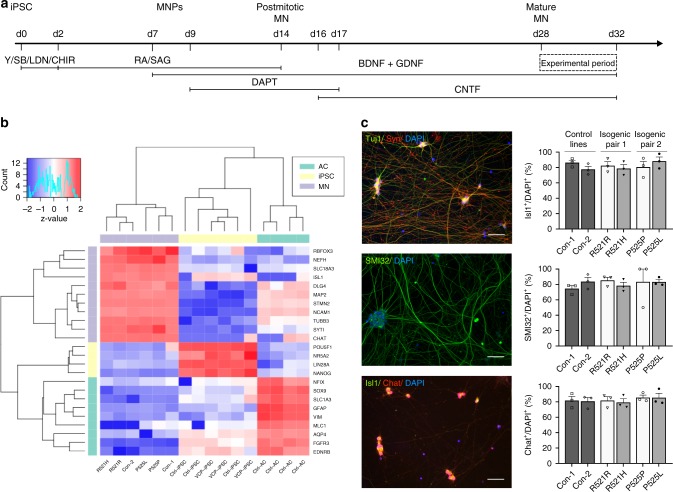
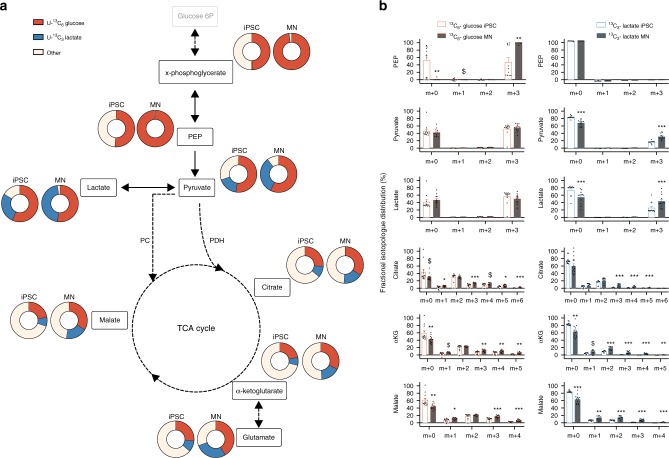
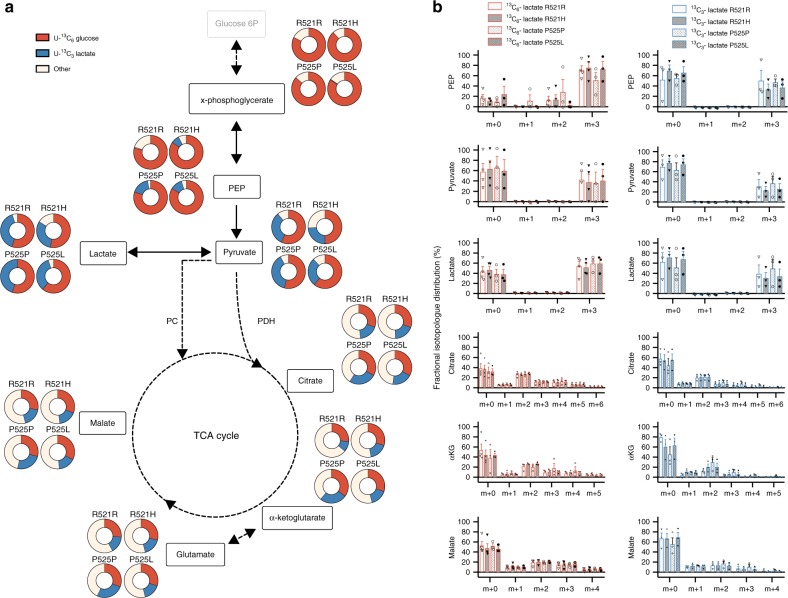
Energy metabolism has been repeatedly linked to amyotrophic lateral sclerosis (ALS). Yet, motor neuron (MN) metabolism remains poorly studied and it is unknown if ALS MNs differ metabolically from healthy MNs. To address this question, we first performed a metabolic characterization of induced pluripotent stem cells (iPSCs) versus iPSC-derived MNs and subsequently compared MNs from ALS patients carrying FUS mutations to their CRISPR/Cas9-corrected counterparts. We discovered that human iPSCs undergo a lactate oxidation-fuelled prooxidative metabolic switch when they differentiate into functional MNs. Simultaneously, they rewire metabolic routes to import pyruvate into the TCA cycle in an energy substrate specific way. By comparing patient-derived MNs and their isogenic controls, we show that ALS-causing mutations in FUS did not affect glycolytic or mitochondrial energy metabolism of human MNs in vitro. These data show that metabolic dysfunction is not the underlying cause of the ALS-related phenotypes previously observed in these MNs.


Conflict of interest statement

The authors declare no competing interests.

Figures

Fig. 1
Fig. 1
Characterisation of iPSC-derived MNs from ALS patients and controls. a Schematic overview of motor neuron differentiation from iPSCs with indication of timing when motor neuron experiments were performed. b Bulk RNA-sequencing analysis indicating enrichment of motor neuron-specific transcripts in human iPSC-derived motor neurons versus iPSCs and astrocytes. Raw data are deposited publicly, EGA (EGAS00001003785). c Representative staining of pan-neuronal markers (Tuj1 and Synapsin1) and staining and quantification of motor neuron markers (Isl1, ChAT and SMI-32) in motor neurons from controls (black bars; Con-1, Con-2), FUS-patients (dark grey bars; R521H, P525L) or isogenic controls from these patients (light grey bars; R521R, P525P). Scale bar, 50 μm. Motor neurons were between 28 and 32 days old for all experiments. Statistical analyses in panel c was performed by one-way ANOVA with post hoc two-tailed t tests between cell lines. In c, data are presented as mean ± s.e.m. from three individual experiments, with the individual data points shown. Source data are provided as a source data file. iPSC induced pluripotent stem cell, MNPs motor neuron progenitors, MN motor neuron, Y Y-27632, SB SB 431542, LDN LDN-193189, CHIR CHIR99021, RA retinoic acid, SAG smoothened agonist, DAPT a γ-secretase inhibitor, BDNF brain-derived neurotrophic factor, GDNF glial cell-derived neurotrophic factor, CNTF ciliary neurotrophic factor, AC astrocyte, Con-1 control cell line 1, Con-2 control cell line 2, R521H cell line derived from a patient carrying the R521H mutation in FUS, R521R CRISPR-Cas9-corrected R521H, P525L cell line derived from a patient carrying the P525L mutation in FUS, P525P CRISPR-Cas9-corrected P525L.
Fig. 2
Fig. 2
Metabolic fate of lactate and glucose in human iPSCs and MNs. a Fractional contribution of uniformly labelled 13C glucose (red) and uniformly labelled 13C lactate (blue) to metabolites from glycolysis and TCA cycle in human iPSCs and motor neurons. b Relative abundance of each isotopologue for specific metabolites. $p < 0.10, *p < 0.05, **p < 0.01, ***p < 0.0001 versus iPSC. Statistical analyses were performed by two-tailed t tests to compare iPSCs and motor neurons. The data represent mean ± s.e.m. from four control cell lines from three independent experiments, with individual data points shown. Thin black arrows represent direct metabolic pathway connections; dashed arrows indicate that additional intermediate reactions are involved in the metabolic pathway. Source data are provided as a source data file. 13C6-glucose uniformly labelled glucose, 13C3-lactate uniformly labelled lactate, PEP phosphoenolpyruvate, PC pyruvate carboxylase, PDH pyruvate dehydrogenase, αKG alpha-ketoglutarate, TCA tricarboxylic acid
Fig. 3
Fig. 3
Mitochondrial respiration and metabolic flux in human iPSCs and MNs. a Overview of the oxygen consumption rate (OCR) throughout the mitochondrial respiration test in human iPSCs and motor neurons. Arrows indicate the time when mitochondrial inhibitors where added to the media to assess respiratory parameters. b ATP-coupled oxygen consumption was determined by inhibiting ATP synthase using oligomycin. c Basal respiration in iPSCs and motor neurons. d Maximal respiration was assessed following mitochondria uncoupling by FCCP. e Spare respiratory capacity was determined by subtracting basal respiration from maximal respiration in iPSCs and motor neurons. f Proton leakage in both cell types was determined after inhibiting complex III via antimycin-A. g Lactate oxidation in iPSCs and motor neurons. h Glucose oxidation in iPSCs and motor neurons. i Glucose uptake in iPSCs and motor neurons. j Glycolytic flux in iPSCs and motor neurons. k Glutamine oxidation in iPSCs and motor neurons. l Fatty acid oxidation in iPSCs and motor neurons. **p < 0.01, ***p < 0.0001. Statistical analyses were performed by two-tailed t tests to compare iPSCs and motor neurons in panel bl. The data represent mean ± s.e.m. from four control cell lines from three independent experiments, with individual data points shown. Source data are provided as a source data file. iPSC induced pluripotent stem cell, MN motor neuron, OCR oxygen consumption rate, FCCP carbonyl cyanide‐4‐(trifluoromethoxy) phenylhydrazone, 2DG 2-deoxy-glucose
Fig. 4
Fig. 4
Mitochondrial morphology and respiration in MNs derived from FUS–ALS patients and isogenic controls. a Representative transmission electron microscope (TEM) images of the mitochondria from patient (R521H, P525L) and isogenic control (R521R, P525P) motor neurons from three independent experiments. TEM operated at 80 kV at ×10.000 magnification. Scale bar, 1 μm. b Overview of the oxygen consumption rates (OCR) throughout the mitochondrial respiration test in patient and isogenic control motor neurons. Arrows indicate the time when mitochondrial inhibitors were added to the media to assess respiratory parameters. c ATP-coupled oxygen consumption was determined by inhibiting ATP synthase using oligomycin. d Basal respiration in patient and isogenic control motor neurons. e Maximal respiration was assessed following mitochondrial uncoupling by FCCP. f Spare respiratory capacity was determined by subtracting basal respiration from maximal respiration in patient and isogenic control motor neurons. g Proton leakage was determined after inhibiting complex III via antimycin-A. The data represent mean ± s.e.m. from six independent experiments, with individual data points shown. Statistical analyses in panel cg were performed by one-way ANOVA with post hoc two-tailed t tests between cell lines (p > 0.05). Dark grey bars indicate FUS-patient cell lines. Light grey bars indicate isogenic controls from these patients. Source data are provided as a source data file. FCCP carbonyl cyanide‐4‐(trifluoromethoxy) phenylhydrazone
Fig. 5
Fig. 5
Metabolic fate of glucose and lactate in MNs derived from FUS–ALS patients and isogenic controls. a Fractional contribution of uniformly labelled 13C glucose (red) and uniformly labelled 13C lactate (blue) to metabolites from glycolysis and TCA cycle in patient (R521H or P525L) and isogenic control (R521R or P525P) motor neurons. b Relative abundance of each isotopologue for specific metabolites in patient and isogenic control motor neurons. The data represent mean ± s.e.m. from three independent experiments, with individual data points shown. Two-way ANOVA analysis with Tukey post hoc test was used to compare FUS-patients and isogenic controls, but did not show differences (p > 0.05). Dark grey bars indicate FUS-patient cell lines. Light grey bars indicate isogenic controls from these patients. Bar fill patterns show the corresponding patient and isogenic control. Thin black arrows represent direct metabolic pathway connections; dashed arrows indicate that additional intermediate reactions are involved in a metabolic pathway. Source data are provided as a source data file. 13C6-glucose uniformly labelled glucose, 13C3-lactate uniformly labelled lactate, PEP phosphoenolpyruvate, PC pyruvate carboxylase, PDH pyruvate dehydrogenase, αKG alpha-ketoglutarate, TCA tricarboxylic acid
Fig. 6
Fig. 6
Mitochondrial and glycolytic flux in MNs derived from FUS–ALS patients and isogenic controls. a Lactate oxidation in patient (R521H or P525L) and isogenic control (R521R or P525P) motor neurons. b Glucose uptake in patient and isogenic control motor neurons. c Glycolytic flux in patient and isogenic control motor neurons. d Glucose oxidation in patient and isogenic control motor neurons. e Glutamine oxidation in patient and isogenic control motor neurons. f Fatty acid oxidation in patient and isogenic control motor neurons. The data represent mean ± s.e.m. from at least three independent experiments, with individual data points shown. Statistical analyses were performed by one-way ANOVA with post hoc two-tailed t tests between cell lines (p > 0.05). Dark grey bars indicate FUS-patient cell lines. Light grey bars indicate isogenic controls from these patients. Source data are provided as a source data file. 2DG 2-deoxy-glucose

Similar articles

Cited by

References

    1. Brown RH, Al-Chalabi A. Amyotrophic lateral sclerosis. N. Engl. J. Med. 2017;377:162–172. doi: 10.1056/NEJMra1603471. - DOI - PubMed
    1. Taylor JP, Brown RH, Jr., Cleveland DW. Decoding ALS: from genes to mechanism. Nature. 2016;539:197–206. doi: 10.1038/nature20413. - DOI - PMC - PubMed
    1. Arthur KC, et al. Projected increase in amyotrophic lateral sclerosis from 2015 to 2040. Nat. Commun. 2016;7:12408. doi: 10.1038/ncomms12408. - DOI - PMC - PubMed
    1. Borthwick Gillian M., Johnson Margaret A., Ince Paul G., Shaw Pamela J., Turnbull Douglass M. Mitochondrial enzyme activity in amyotrophic lateral sclerosis: Implications for the role of mitochondria in neuronal cell death. Annals of Neurology. 1999;46(5):787–790. doi: 10.1002/1531-8249(199911)46:5<787::AID-ANA17>3.0.CO;2-8. - DOI - PubMed
    1. Vandoorne T, De Bock K, Van Den Bosch L. Energy metabolism in ALS: an underappreciated opportunity? Acta Neuropathol. 2018;135:489–509. doi: 10.1007/s00401-018-1835-x. - DOI - PMC - PubMed

Publication types

MeSH terms