. 2019 Sep 12;6(1):170.
doi: 10.1038/s41597-019-0169-4.

PEST-CHEMGRIDS, global gridded maps of the top 20 crop-specific pesticide application rates from 2015 to 2025

Affiliations

PEST-CHEMGRIDS, global gridded maps of the top 20 crop-specific pesticide application rates from 2015 to 2025

Federico Maggi et al. Sci Data. .

Abstract

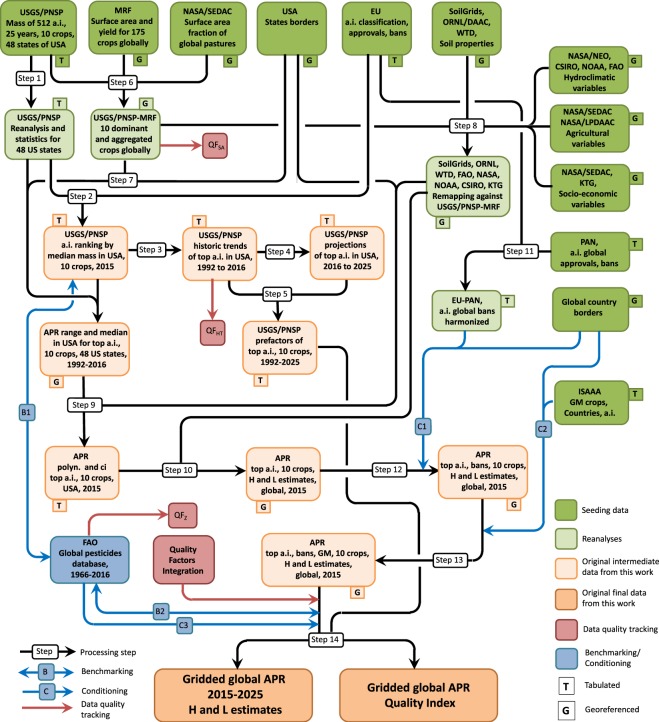
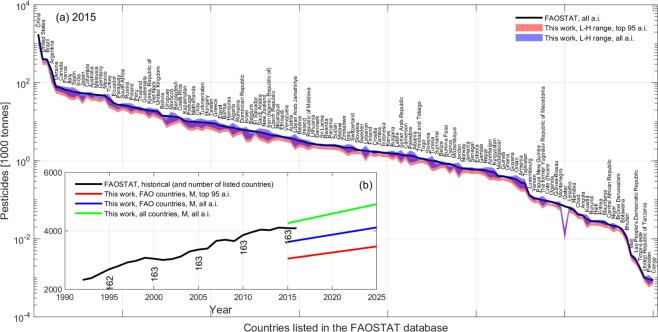
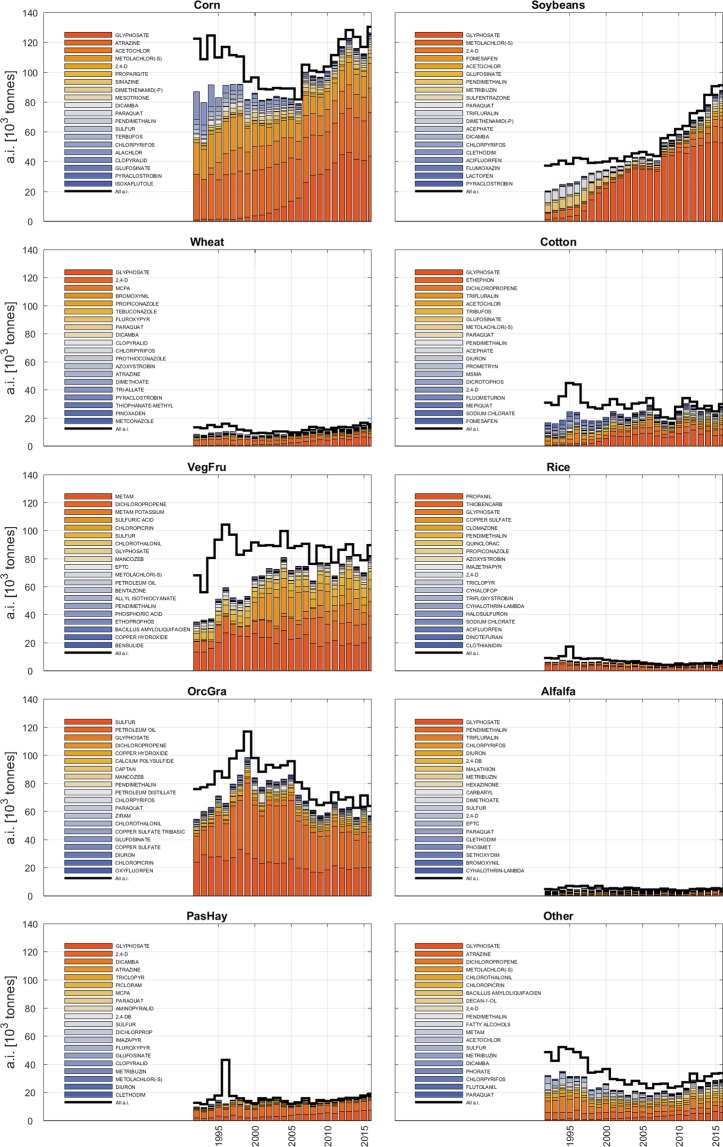
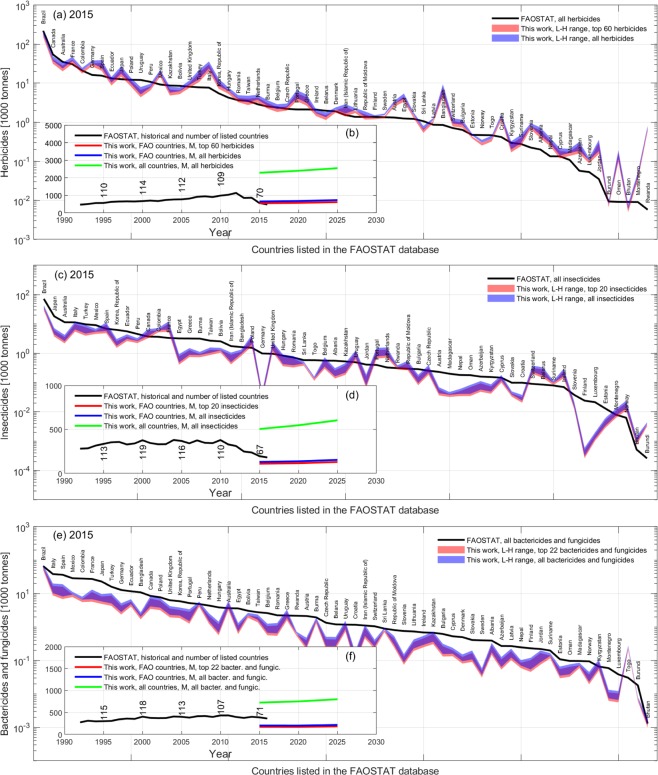
Available georeferenced environmental layers are facilitating new insights into global environmental assets and their vulnerability to anthropogenic inputs. Geographically gridded data of agricultural pesticides are crucial to assess human and ecosystem exposure to potential and recognised toxicants. However, pesticides inventories are often sparse over time and by region, mostly report aggregated classes of active ingredients, and are generally fragmented across local or government authorities, thus hampering an integrated global analysis of pesticide risk. Here, we introduce PEST-CHEMGRIDS, a comprehensive database of the 20 most used pesticide active ingredients on 6 dominant crops and 4 aggregated crop classes at 5 arc-min resolution (about 10 km at the equator) projected from 2015 to 2025. To estimate the global application rates of specific active ingredients we use spatial statistical methods to re-analyse the USGS/PNSP and FAOSTAT pesticide databases along with other public inventories including global gridded data of soil physical properties, hydroclimatic variables, agricultural quantities, and socio-economic indices. PEST-CHEMGRIDS can be used in global environmental modelling, assessment of agrichemical contamination, and risk analysis.


Conflict of interest statement

The authors declare no competing interests.

Figures

Fig. 1
Fig. 1
Flow chart. Processing steps implemented to elaborate source data sets and produce globally gridded yearly application rates of the top 20 crop-specific pesticides and their quality index maps.
Fig. 2
Fig. 2
Top 5 of the 20 most used crop-specific active ingredients. The panels represents the “high” and “low” historical (within blue shaded areas from 1992 to 2016) and projected (dashed lines) application rates in kg/ha obtained for the 5 out 20 top active ingredients used on dominant and aggregated crops in the USA. Historical data are from the USGS/PNSP database while projections are obtained from step 4 in Fig. 1. Columns refer to dominant and aggregated crop classes. Shaded red, blue and green areas from 2016 to 2025 highlight active ingredients with increasing, steady and decreasing projection trends, respectively. Panels for the top 6 to 20 ingredients are available in,.
Fig. 3
Fig. 3
Benchmarking of conditioned estimates against the FAOSTAT pesticide data. (a) Aggregated pesticide use for all countries listed in the FAOSTAT database in 2015 and corresponding conditioned estimated for the top 95 and all active ingredients (a.i.), with the latter estimated using the correction factor FM = 0.842. (b) Projected global pesticide mass for the countries listed in the FAOSTAT and all countries benchmarked against historical FAOSTAT records.
Fig. 4
Fig. 4
Examples of global gridded application rate and quality index maps. The top two panels show the high (HIGH) estimate in 2015 for the annual application rate of glyphosate on corn globally gridded and the corresponding quality index QI map. Panes in the second row show regional application rates.
Fig. 5
Fig. 5
Global outlook. The mass (a) and application rate (b) are represented for the top 50 active ingredients globally. Ingredients are sorted in decreasing order of global applied mass and application rate. HBC, INS, FUN, ACA, PGR, NEM, and REP stand for ‘herbicide’, ‘insecticide’, ‘fungicide’, ‘acaricide’, ‘plant growth regulator’, ‘nematicide’, and ‘repellent’, respectively.
Fig. 6
Fig. 6
Patterns in pesticide use in the USA. Cumulative mass of all (black line) and the 20 most used crop-specific active ingredients (colour bars) in the USA from 1992 to 2016. Data are redrawn from the USGS/PNSP database in. a.i. refers to active ingredients.
Fig. 7
Fig. 7
Reanalysis and benchmarking of USGS/PNSP against FAOSTAT. (a) Represents the mass in all and the 95 selected pesticides; (bd) refer to the mass in all and the selected 60 “herbicides”, 20 “insecticides and seed treatments”, and 22 “bactericides and fungicides”, respectively. The selected active ingredients (a.i.) are the cumulative of the top 20 crop-specific ingredients grouped by pesticide class as in the FAOSTAT database.
Fig. 8
Fig. 8
Validation of estimates. The main panels (a–c) represent the country-specific cumulative mass of active ingredients reported in the FAOSTAT pesticide database and the PEST-CHEMGRIDS estimates for “herbicides”, “insecticides”, and “bactericides and fungicides”, respectively, in 2015. Estimates for all a.i. in blue were obtained using the correction factor FM = 0.842. Inset panels (b,d,f) represent the global cumulative mass of the corresponding projections from 2015 to 2025 relative to the countries listed in the FAOSTAT and all countries. Ideally, the blue line should be as closer as possible to the FAOSTAT historical data. Panel (c) excludes Sweden, Denmark, Latvia and Lithuania because none or only a few insecticides selected in PEST-CHEMGRIDS are allowed in those countries, and thus comparison is not possible even if they are included in the FAOSTAT database.
Fig. 9
Fig. 9
Validation of estimates against data in the United Kingdom, Australia, South Korea, and South Africa. (a) masses of active ingredients applied in the United Kingdom in the year 2015 were sourced from PUS STATS, (b) masses of active ingredients applied in Australia relative to the year 2006 were obtained from AUDEE, (c) masses of active ingredients applied in South Korea relative to the year 2011 were sourced from, and (d) atrazine mass applied in South Africa in the year 2009 was reported in.

References

    1. Food and Agriculture Organization of the United Nations. Database Collection of the Food and Agriculture Organization of the United Nations, http://www.fao.org/faostat/en/#data (FAOSTAT, 2018).
    1. Department of Economic and Social Affairs, Population Division. World Population Prospects: The 2017 Revision, World Population 2017. Data Booklet. ST/ESA/SER.A/401 (United Nations, 2017).
    1. Haynes D, Müller J, Carter S. Pesticide and herbicide residues in sediments and seagrasses from the Great Barrier Reef World Heritage Area and Queensland coast. Mar. Pollut. Bull. 2000;41(7–12):279–287. doi: 10.1016/S0025-326X(00)00097-7. - DOI
    1. Silva V, et al. Pesticide residues in European agricultural soils–a hidden reality unfolded. Sci. Total Environ. 2019;653:1532–1545. doi: 10.1016/j.scitotenv.2018.10.441. - DOI - PubMed
    1. Hayes TB, et al. Hermaphroditic, demasculinized frogs after exposure to the herbicide atrazine at low ecologically relevant doses. Proc. Natl. Acad. Sci. 2002;99(8):5476–5480. doi: 10.1073/pnas.082121499. - DOI - PMC - PubMed

Publication types