

Histone methyltransferase G9a protects against acute liver injury through GSTP1
- PMID: 31515511
- PMCID: PMC7206029
- DOI: 10.1038/s41418-019-0412-8
Histone methyltransferase G9a protects against acute liver injury through GSTP1
Abstract
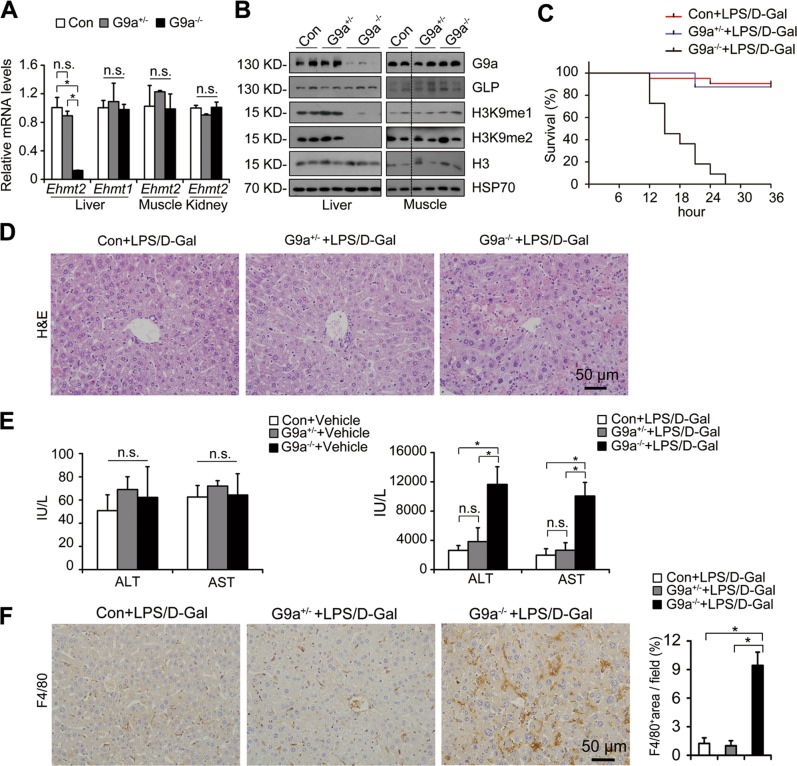
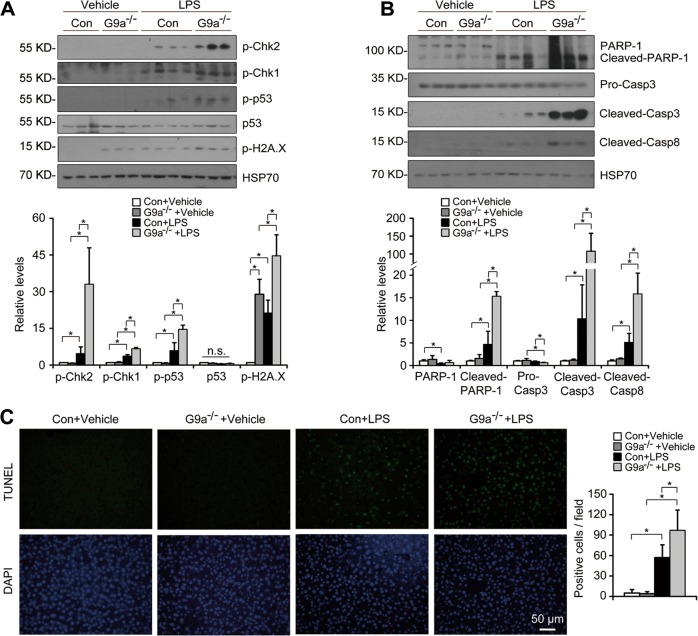
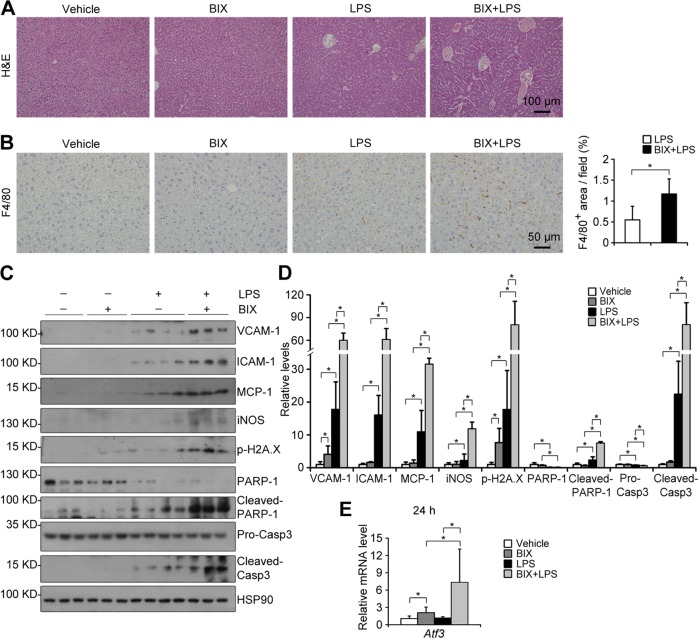
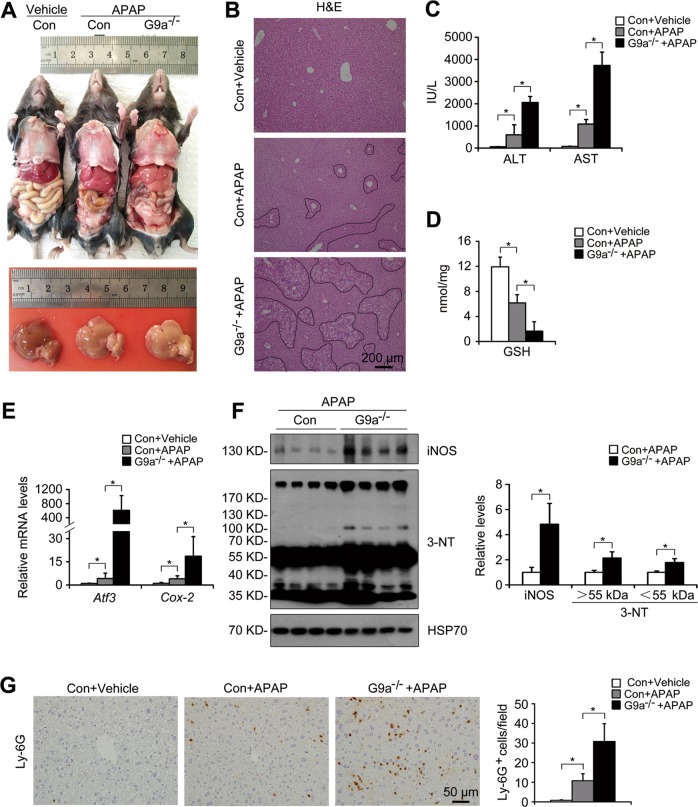
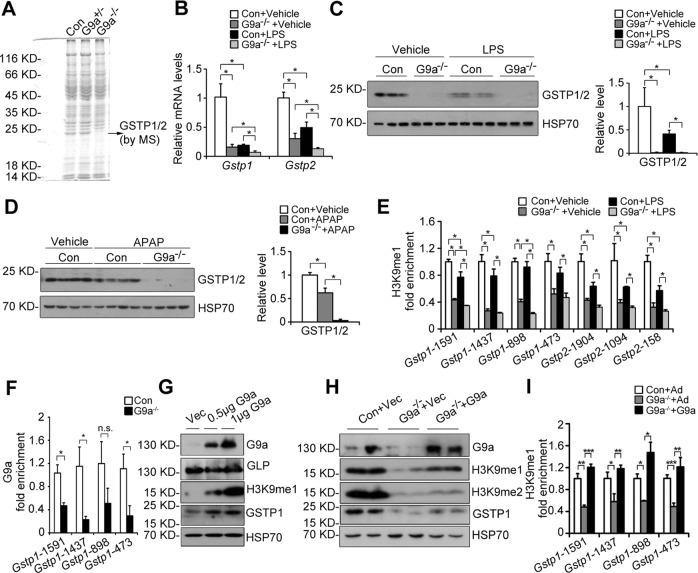
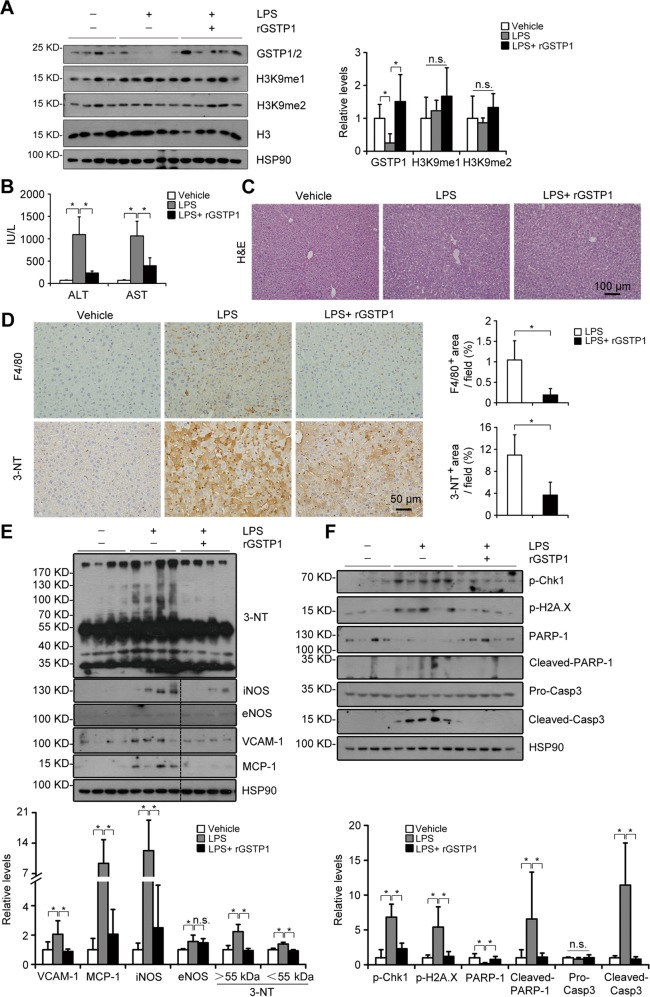
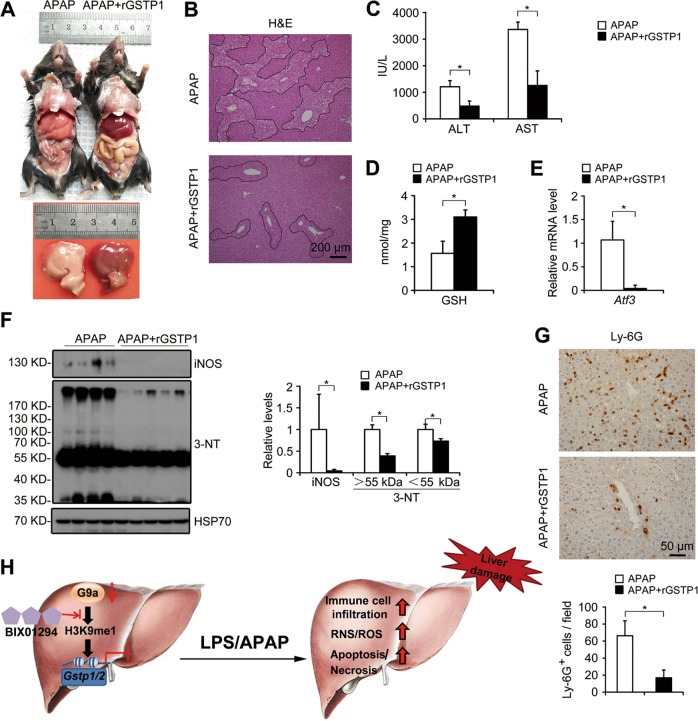
Acute liver injury is commonly caused by bacterial endotoxin/lipopolysaccharide (LPS), and by drug overdose such as acetaminophen (APAP). The exact role of epigenetic modification in acute liver injury remains elusive. Here, we investigated the role of histone methyltransferase G9a in LPS- or APAP overdose-induced acute liver injury. Under D-galactosamine sensitization, liver-specific G9a-deficient mice (L-G9a-/-) exhibited 100% mortality after LPS injection, while the control and L-G9a+/- littermates showed very mild mortality. Moreover, abrogation of hepatic G9a or inhibiting the methyltransferase activity of G9a aggravated LPS-induced liver damage. Similarly, under sublethal APAP overdose, L-G9a-/- mice displayed more severe liver injury. Mechanistically, ablation of G9a inhibited H3K9me1 levels at the promoters of Gstp1/2, two liver detoxifying enzymes, and consequently suppressed their transcription. Notably, treating L-G9a-/- mice with recombinant mouse GSTP1 reversed the LPS- or APAP overdose-induced liver damage. Taken together, we identify a novel beneficial role of G9a-GSTP1 axis in protecting against acute liver injury.
Conflict of interest statement
The authors declare that they have no conflict of interest.
Figures

Similar articles
-
Coordinated recruitment of histone methyltransferase G9a and other chromatin-modifying enzymes in SHP-mediated regulation of hepatic bile acid metabolism.Mol Cell Biol. 2007 Feb;27(4):1407-24. doi: 10.1128/MCB.00944-06. Epub 2006 Dec 4. Mol Cell Biol. 2007. PMID: 17145766 Free PMC article.
-
Liver-specific knockout of histone methyltransferase G9a impairs liver maturation and dysregulates inflammatory, cytoprotective, and drug-processing genes.Xenobiotica. 2019 Jun;49(6):740-752. doi: 10.1080/00498254.2018.1490044. Epub 2018 Jul 23. Xenobiotica. 2019. PMID: 29912608 Free PMC article.
-
Histone methyltransferase G9a modulates hepatic insulin signaling via regulating HMGA1.Biochim Biophys Acta Mol Basis Dis. 2018 Feb;1864(2):338-346. doi: 10.1016/j.bbadis.2017.10.037. Epub 2017 Oct 31. Biochim Biophys Acta Mol Basis Dis. 2018. PMID: 29101051
-
Recruitment of histone methyltransferase G9a mediates transcriptional repression of Fgf21 gene by E4BP4 protein.J Biol Chem. 2013 Feb 22;288(8):5417-25. doi: 10.1074/jbc.M112.433482. Epub 2013 Jan 2. J Biol Chem. 2013. PMID: 23283977 Free PMC article.
-
CXCL16 deficiency attenuates acetaminophen-induced hepatotoxicity through decreasing hepatic oxidative stress and inflammation in mice.Acta Biochim Biophys Sin (Shanghai). 2017 Jun 1;49(6):541-549. doi: 10.1093/abbs/gmx040. Acta Biochim Biophys Sin (Shanghai). 2017. PMID: 28459937
Cited by
-
IL-33 Downregulates Hepatic Carboxylesterase 1 in Acute Liver Injury via Macrophage-derived Exosomal miR-27b-3p.J Clin Transl Hepatol. 2023 Oct 28;11(5):1130-1142. doi: 10.14218/JCTH.2022.00144. Epub 2023 Mar 16. J Clin Transl Hepatol. 2023. PMID: 37577217 Free PMC article.
-
Phase Separation of Chromatin Structure-related Biomolecules: A Driving Force for Epigenetic Regulations.Curr Protein Pept Sci. 2024;25(7):553-566. doi: 10.2174/0113892037296216240301074253. Curr Protein Pept Sci. 2024. PMID: 38551058 Review.
-
ANGPTL3 negatively regulates IL-1β-induced NF-κB activation by inhibiting the IL1R1-associated signaling complex assembly.J Mol Cell Biol. 2024 Jan 17;15(8):mjad053. doi: 10.1093/jmcb/mjad053. J Mol Cell Biol. 2024. PMID: 37634084 Free PMC article.
-
Modeling the weaning diet of piglets with fermented feed material: effects on growth performance and health parameters.Front Vet Sci. 2025 Jul 3;12:1616209. doi: 10.3389/fvets.2025.1616209. eCollection 2025. Front Vet Sci. 2025. PMID: 40678496 Free PMC article.
-
Andrographolide ameliorates sepsis-induced acute liver injury by attenuating endoplasmic reticulum stress through the FKBP1A-mediated NOTCH1/AK2 pathway.Cell Biol Toxicol. 2025 Mar 7;41(1):56. doi: 10.1007/s10565-025-10007-9. Cell Biol Toxicol. 2025. PMID: 40053226 Free PMC article.
References
Publication types
MeSH terms
Substances
LinkOut - more resources
Full Text Sources
Molecular Biology Databases
Research Materials
Miscellaneous
