. 2019 Sep 12;10(1):4135.
doi: 10.1038/s41467-019-11974-4.

Assembly and seasonality of core phyllosphere microbiota on perennial biofuel crops

Affiliations

Assembly and seasonality of core phyllosphere microbiota on perennial biofuel crops

Keara L Grady et al. Nat Commun. .

Abstract

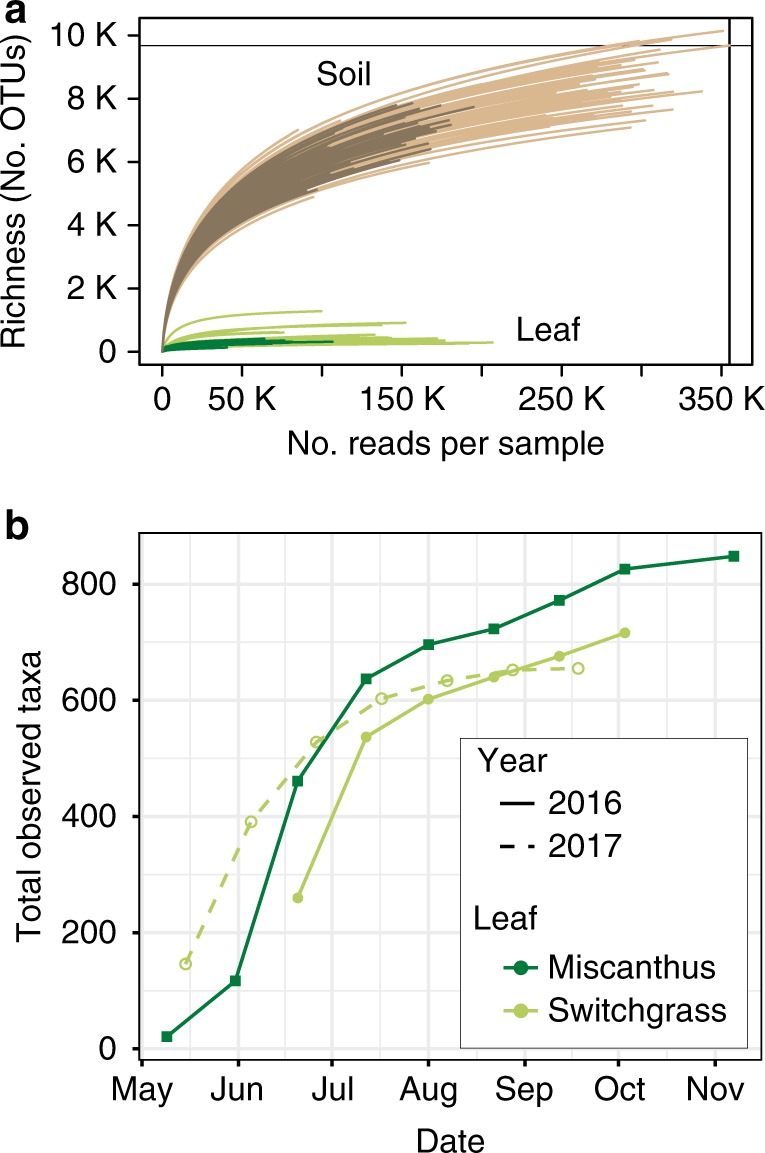
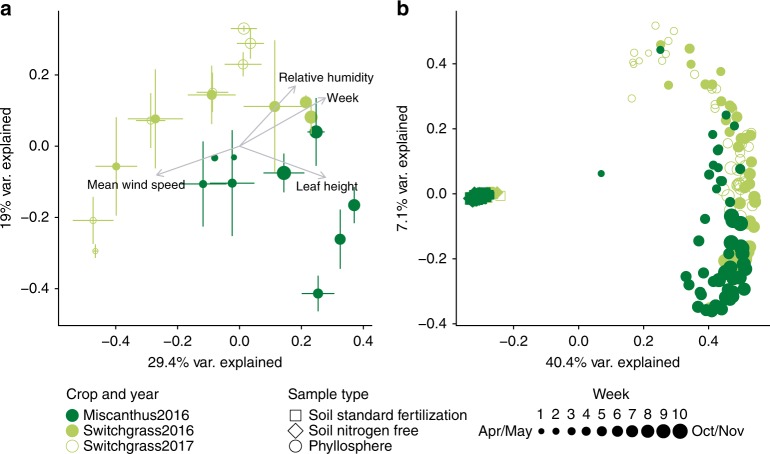
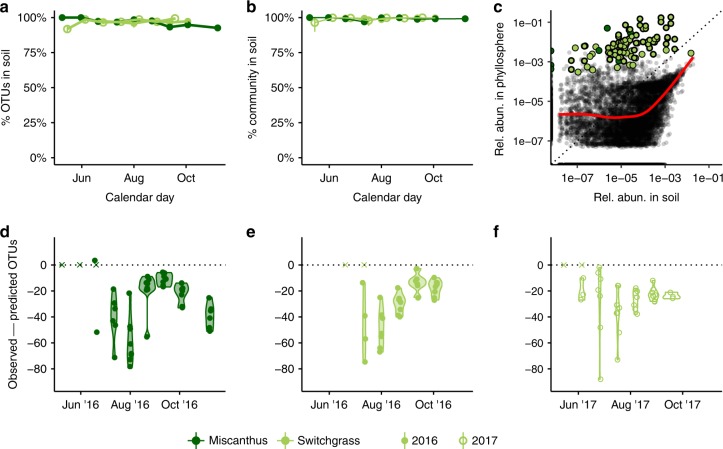
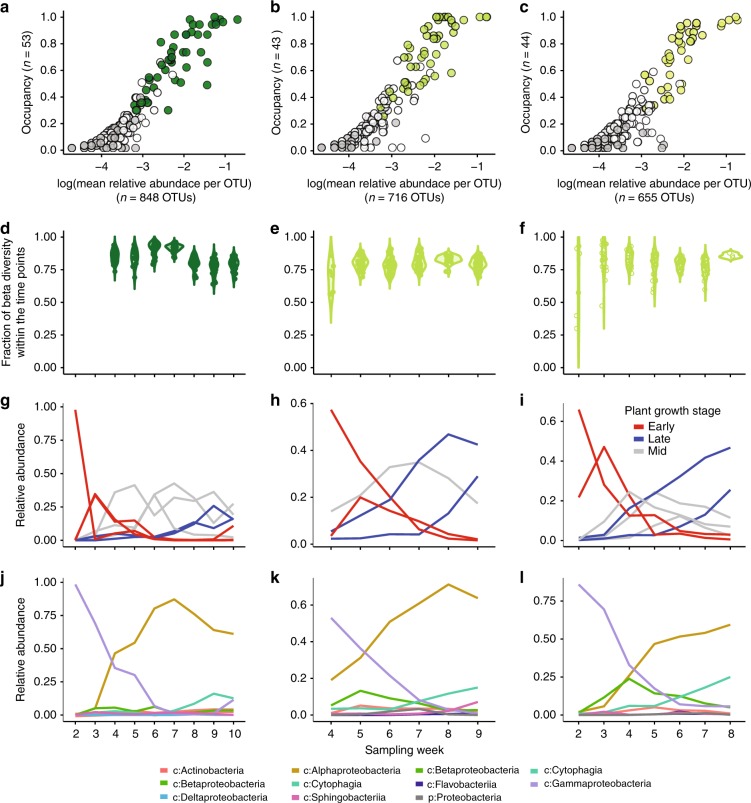
Perennial grasses are promising feedstocks for biofuel production, with potential for leveraging their native microbiomes to increase their productivity and resilience to environmental stress. Here, we characterize the 16S rRNA gene diversity and seasonal assembly of bacterial and archaeal microbiomes of two perennial cellulosic feedstocks, switchgrass (Panicum virgatum L.) and miscanthus (Miscanthus x giganteus). We sample leaves and soil every three weeks from pre-emergence through senescence for two consecutive switchgrass growing seasons and one miscanthus season, and identify core leaf taxa based on occupancy. Virtually all leaf taxa are also detected in soil; source-sink modeling shows non-random, ecological filtering by the leaf, suggesting that soil is an important reservoir of phyllosphere diversity. Core leaf taxa include early, mid, and late season groups that were consistent across years and crops. This consistency in leaf microbiome dynamics and core members is promising for microbiome manipulation or management to support crop production.


Conflict of interest statement

The authors declare no competing interests.

Figures

Fig. 1
Fig. 1
Sequencing effort and alpha diversity for switchgrass and miscanthus phyllosphere (green lines) and soils (brown lines). Operational taxonomic units (OTUs) were defined at 97% sequence identity of 16S rRNA gene amplicons. a Rarefaction curves of quality-controlled reads. The vertical line is the maximum number of sequences observed in a sample, and the horizontal line is the richness of that sample. b Phyllosphere richness accumulation for switchgrass (light green lines and circles) and miscanthus (dark green lines and squares) over time for 2016 (solid lines) and 2017 (dashed lines), using a dataset subsampled to 1000 sequences per sample
Fig. 2
Fig. 2
Seasonal patterns in the structures of bacterial and archaeal communities inhabiting the phyllosphere and associated soils of the biofuel feedstocks switchgrass and miscanthus. a Principal coordinates analysis (PCoA) of switchgrass (light green circles, 2016 = filled and 2017 = open) and miscanthus phyllosphere communities (dark green circles, Bray-Curtis dissimilarity), error bars show 1 deviation around the centroid (n = 1 to 8 replicate plots/time point; please see Supplementary Table 1 for exact replicates per time point). b PCoA of the phyllosphere communities (circles) relative to the soil (standard fertilization are squares and nitrogen free are diamonds). For both a and b, subsampling depth was 1000 reads per sample and environmental vectors were fitted when r2 > 0.4 and p < 0.05. For both panels, the size of the symbol reflects the sampling week in the season, with smaller symbols used for the earlier time points and larger symbols for the late time points
Fig. 3
Fig. 3
The majority of phyllosphere taxa were also present in the soil. a Circles represent the mean number of OTUs found in up to eight replicate phyllosphere samples, subsampled to 1000 sequences, for each crop (miscanthus is dark green, filled circles, switchgrass is light green) at each time point (2016 is filled and 2017 is open). An OTU was considered present in the soil if it occurred at any abundance in any of the 202 unrarefied soil samples over two years. b The fractions of the phyllosphere communities present in the soil were even greater when considering the relative abundances of taxa; each circle represents the mean total relative abundance of leaf taxa present in the soil in up to eight replicate phyllosphere samples. c The relative abundances of taxa in pooled phyllosphere samples and pooled soil samples were positively correlated among taxa that were present at greater than 0.01% total abundance in the soil. Each black circle represents an OTU present in both phyllosphere and soil communities; a LOESS smoothing function is shown as a red line. Core members are shown as large green circles. df Source-sink models of phyllosphere community assembly from soils. Violin plots show the numbers of observed taxa in the phyllosphere were consistently lower than the richness values predicted by model simulations. The model assumed random increases and decreases in taxon abundances between time points and random immigration from the soil community (see Methods). Each circle represents a single phyllosphere sample
Fig. 4
Fig. 4
Selection and dynamics of core phyllosphere members. Abundance-occupancy of leaf taxa for a miscanthus 2016, b switchgrass 2016, and c switchgrass 2017, and their inclusion in their respective cores. Each point is an OTU. Abundance-occupancy distributions were calculated at each time point, and taxa that had 100% occupancy at any time point (e.g., were detected in all replicate plots at one sampling date) were included in the core (green filled circles). Non-core taxa that were detected in both crops (white/open circles), and crop-specific taxa (gray) are also indicated. df Contributions of the core taxa to changes in beta diversity over time. gi Patterns of core taxa that share similar temporal changes, as determined by hierarchical clustering of standardized dynamics. Red lines are taxa that have early peaks in relative abundance, blue lines are late, and gray lines are mid-season. Colors correspond to the dendrograms in Fig. S7. jl Patterns of core taxa summed by relative abundances within bacterial class. c: is class and p: is phylum, and lines are colored by taxonomic group
Fig. 5
Fig. 5
Compensatory patterns of Protobacteria classes over crops and season in the phyllosphere of switchgrass and miscanthus. Proteobacteria OTUs contributed 35.2% of the total taxa detected in the phyllosphere and contributed 116,760 total reads (34.1% of the leaf reads). a Changes in the relative contributions of all 521 leaf-detected Proteobacteria OTUs by class, over time. Colors are Proteobacteria class: Alphaproteobacterial are red, Betaproteobacteria are brown, Deltaproteobacteria are tan, and Gammaproteobacterial are yellow. bd Vignettes showing different dynamics of Proteobacteria OTUs that were detected within the phyllosphere core microbiome, over time (upper is 2016 and lower is 2017) and across crops (miscanthus are dark green lines, switchgrass are light green lines). Genus is g, and shading around each line shows the 95% confidence interval around the replicate series

References

    1. Peñuelas J, Terradas J. The foliar microbiome. Trends Plant Sci. 2014;19:278–280. doi: 10.1016/j.tplants.2013.12.007. - DOI - PubMed
    1. Lindow SE, Brandl MT. Microbiology of the phyllosphere. Appl. Environ. Microbiol. 2003;69:1875–1883. doi: 10.1128/AEM.69.4.1875-1883.2003. - DOI - PMC - PubMed
    1. Vorholt JA. Microbial life in the phyllosphere. Nat. Rev. Microbiol. 2012;10:828–840. doi: 10.1038/nrmicro2910. - DOI - PubMed
    1. Foley JA, et al. Solutions for a cultivated planet. Nature. 2011;478:337–342. doi: 10.1038/nature10452. - DOI - PubMed
    1. Hamilton CE, Gundel PE, Helander M, Saikkonen K. Endophytic mediation of reactive oxygen species and antioxidant activity in plants: a review. Fungal Divers. 2012;54:1–10. doi: 10.1007/s13225-012-0158-9. - DOI

Publication types