. 2019 Oct;68(10):1585-1596.
doi: 10.1007/s00262-019-02391-z. Epub 2019 Sep 12.

Peripheral changes in immune cell populations and soluble mediators after anti-PD-1 therapy in non-small cell lung cancer and renal cell carcinoma patients

Affiliations

Peripheral changes in immune cell populations and soluble mediators after anti-PD-1 therapy in non-small cell lung cancer and renal cell carcinoma patients

Estefanía Paula Juliá et al. Cancer Immunol Immunother. 2019 Oct.

Abstract

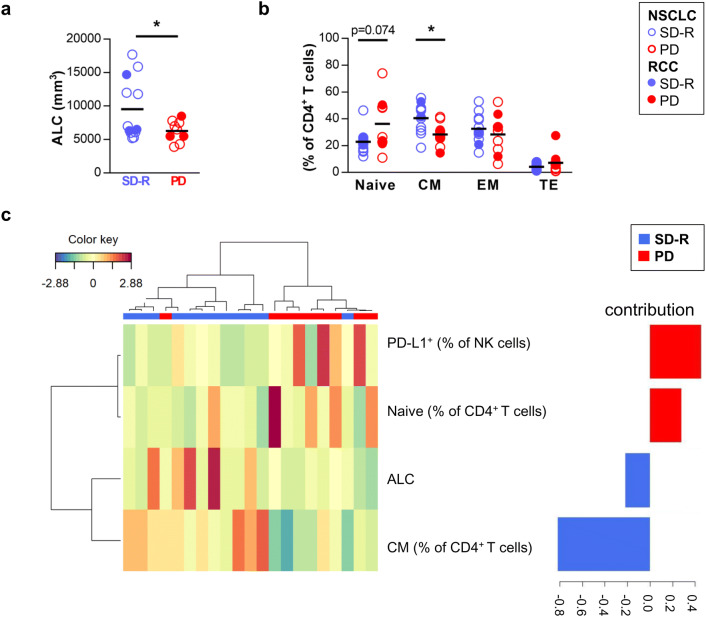
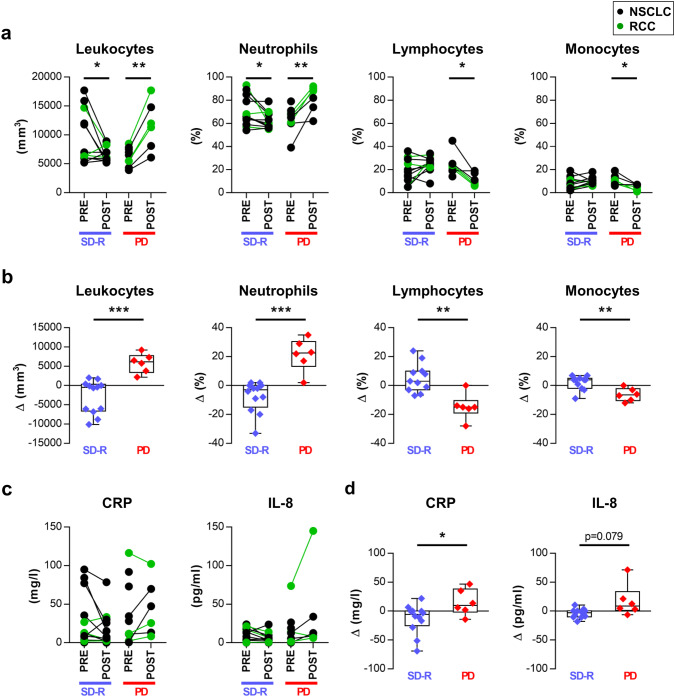
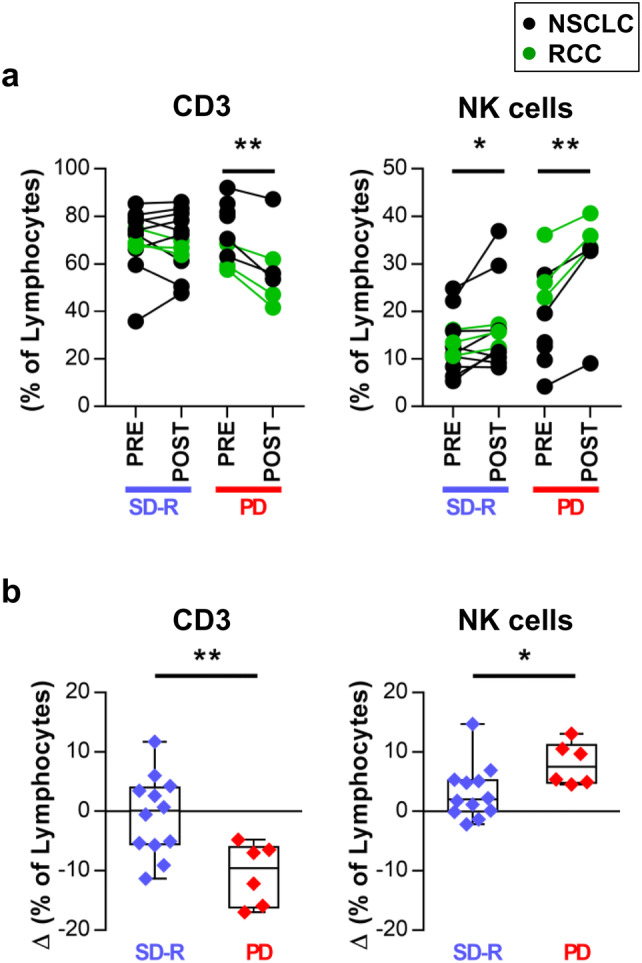
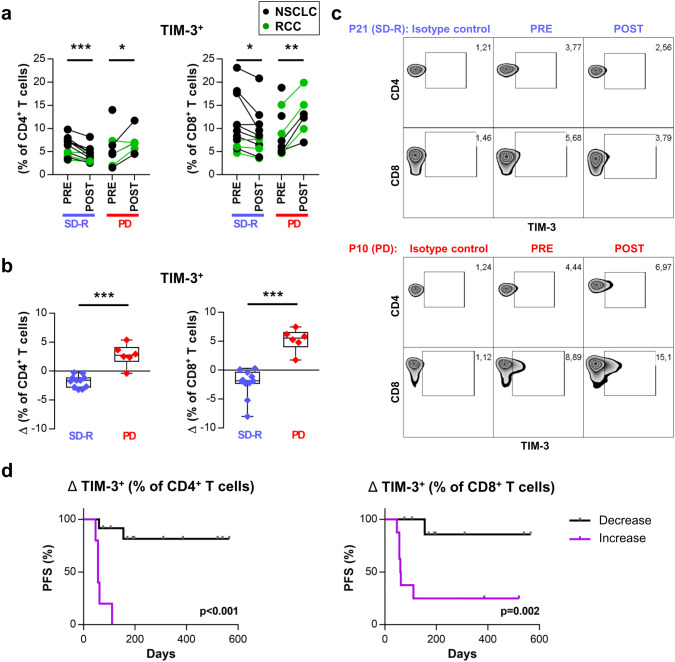
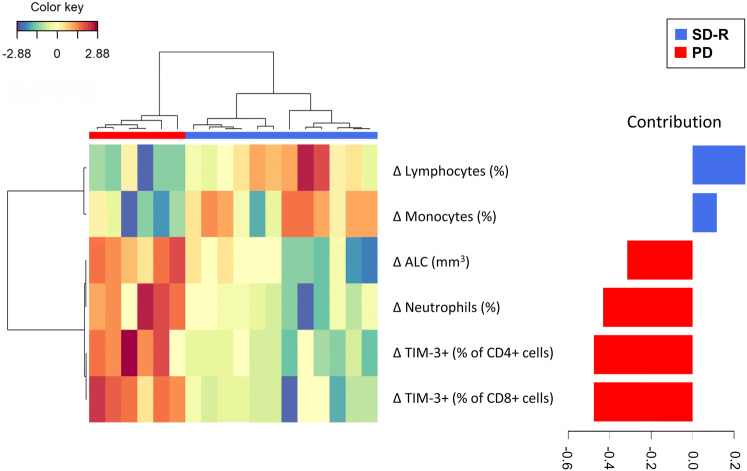
Patients with non-small cell lung cancer (NSCLC) and renal cell carcinoma (RCC) have shown benefit from anti-PD-1 therapies. However, not all patients experience tumor shrinkage, durable responses or prolonged survival, demonstrating the need to find response markers. In blood samples from NSCLC and RCC patients obtained before and after anti-PD-1 treatment, we studied leukocytes by complete blood cell count, lymphocyte subsets using flow cytometry and plasma concentration of nine soluble mediators, in order to find predictive biomarkers of response and to study changes produced after anti-PD-1 therapy. In baseline samples, discriminant analysis revealed a combination of four variables that helped differentiate stable disease-response (SD-R) from progressive disease (PD) patients: augmented frequency of central memory CD4+ T cells and leukocyte count was associated with response while increased percentage of PD-L1+ natural killer cells and naïve CD4+ T cells was associated with lack of response. After therapy, differential changes between responders and non-responders were found in leukocytes, T cells and TIM-3+ T cells. Patients with progressive disease showed an increase in the frequency of TIM-3 expressing CD4+ and CD8+ T cells, whereas SD-R patients showed a decrease in these subsets. Our findings indicate that a combination of immune variables from peripheral blood (PB) could be useful to distinguish response groups in NSCLC and RCC patients treated with anti-PD-1 therapy. Frequency of TIM-3+ T cells showed differential changes after treatment in PD vs SD-R patients, suggesting that it may be an interesting marker for monitoring progression during therapy.

Keywords: Anti-PD-1 therapy; NSCLC; Nivolumab; Pembrolizumab; Renal cell carcinoma; TIM-3.


Conflict of interest statement

Claudio Martín has served as speaker and advisory board member for Bristol Myers Squibb and Merck Sharp and Dohme. Carmen Pupareli has served as speaker and advisor board member for Merck Sharp and Dohme and as speaker for Bristol Myers Squibb. The authors declare that there is no other conflict of interest.

Figures

Fig. 1
Fig. 1
Analysis of PRE-treatment samples. NSCLC and RCC patients were divided into two groups according to their best clinical response to anti-PD-1 therapy: stable disease-response (SD-R) and progressive disease (PD) patients. a Absolute leukocyte count (ALC) by complete blood cell count. b Frequency of memory CD4+ T cell subsets by FACS: CD45ROCCR7+ naïve cells, CD45RO+CCR7+ central memory (CM) cells, CD45RO+CCR7 effector memory (EM) cells and CD45ROCCR7 terminal effector (TE) cells. *p < 0.05. c Clustered image map showing the model that best classifies patients (represented in columns) into both groups (SD-R or PD) based on markers at baseline (represented in rows). Barplot on the right displays the loading weights associated to each marker, with colors indicating the response group with the maximum average value. Partial least-squares discriminant analysis (PLS-DA) was done
Fig. 2
Fig. 2
Variations in leukocytes and soluble mediators after anti-PD-1 therapy were associated with treatment response. a Absolute leukocyte count (ALC) and frequency of neutrophils, lymphocytes and monocytes from paired PRE and POST-treatment samples are shown for both response groups. b Comparison of the variation (Δ: POST minus PRE value) in these cell populations between both response groups. c C-reactive protein (CRP) and IL-8 plasma levels from paired PRE and POST-treatment samples. d Comparison of the variation (Δ) in the concentration of CRP and IL-8 between SD-R and PD patients. *p < 0.05, **p < 0.01, ***p < 0.001
Fig. 3
Fig. 3
Changes in lymphocyte populations after anti-PD-1 treatment. a Frequency of T and NK cells within lymphocytes from paired PRE and POST-treatment samples are shown for both response groups. b Comparison of the variation (Δ: POST minus PRE value) in T and NK cell frequencies between SD-R and PD patients. *p < 0.05, **p < 0.01
Fig. 4
Fig. 4
Frequency of TIM-3+ CD4+ and CD8+ T cells increased after treatment in PD but not in SD-R patients. a Frequency of TIM-3 expressing cells in CD4+ (left) and CD8+ (right) T cells from paired PRE and POST-treatment samples is shown for both groups of response. b Comparison of the variation (Δ: POST minus PRE value) in the frequency of TIM-3+ CD4+ (left) and CD8+ (right) T cells between both response groups. *p < 0.05, **p < 0.01, ***p < 0.001. c Representative density plots showing TIM-3 expression in CD4+ and CD8+ T cells from two patients. d PFS analysis with patients dichotomized as those with either an increase or a decrease in TIM-3 expressing cells after anti-PD-1 treatments. Kaplan–Meier curves are shown and p-values were determined by log-rank test
Fig. 5
Fig. 5
Multivariate analysis of changes after treatment. Clustered image map showing the model that best classifies patients (represented in columns) into both groups (SD-R or PD) based on the variations (Δ: POST minus PRE-values) of the markers after treatment (represented in rows). Barplot on the right displays the loading weights associated to each marker, with colors indicating the response group with the maximum average value. Partial least-squares discriminant analysis (PLS-DA) was done

References

    1. Brahmer J, Reckamp KL, Baas P, Crinò L, Eberhardt WEE, Poddubskaya E, et al. Nivolumab versus docetaxel in advanced squamous-cell non-small-cell lung cancer. N Engl J Med. 2015;373:123–135. doi: 10.1056/NEJMoa1504627. - DOI - PMC - PubMed
    1. Ferris RL, Blumenschein G, Fayette J, Guigay J, Colevas AD, Licitra L, et al. Nivolumab for recurrent squamous-cell carcinoma of the head and neck. N Engl J Med. 2016;375:1856–1867. doi: 10.1056/NEJMoa1602252. - DOI - PMC - PubMed
    1. Hodi FS, Chesney J, Pavlick AC, Robert C, Grossmann KF, McDermott DF, et al. Combined nivolumab and ipilimumab versus ipilimumab alone in patients with advanced melanoma: 2-year overall survival outcomes in a multicentre, randomised, controlled, phase 2 trial. Lancet Oncol. 2016;17:1558–1568. doi: 10.1016/S1470-2045(16)30366-7. - DOI - PMC - PubMed
    1. Motzer RJ, Escudier B, McDermott DF, George S, Hammers HJ, Srinivas S, et al. Nivolumab versus everolimus in advanced renal-cell carcinoma. N Engl J Med. 2015;373:1803–1813. doi: 10.1056/NEJMoa1510665. - DOI - PMC - PubMed
    1. Robert C, Long GV, Brady B, Dutriaux C, Maio M, Mortier L, et al. Nivolumab in previously untreated melanoma without BRAF mutation. N Engl J Med. 2015;372:320–330. doi: 10.1056/NEJMoa1412082. - DOI - PubMed

MeSH terms

Substances