

Dysregulation of the miRNA biogenesis components DICER1, DROSHA, DGCR8 and AGO2 in clear cell renal cell carcinoma in both a Korean cohort and the cancer genome atlas kidney clear cell carcinoma cohort
- PMID: 31516620
- PMCID: PMC6732956
- DOI: 10.3892/ol.2019.10759
Dysregulation of the miRNA biogenesis components DICER1, DROSHA, DGCR8 and AGO2 in clear cell renal cell carcinoma in both a Korean cohort and the cancer genome atlas kidney clear cell carcinoma cohort
Abstract
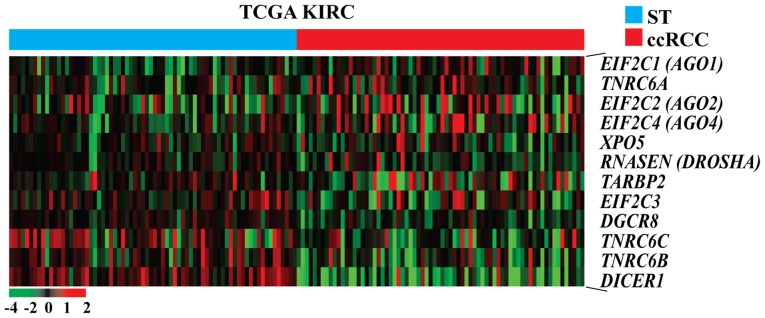
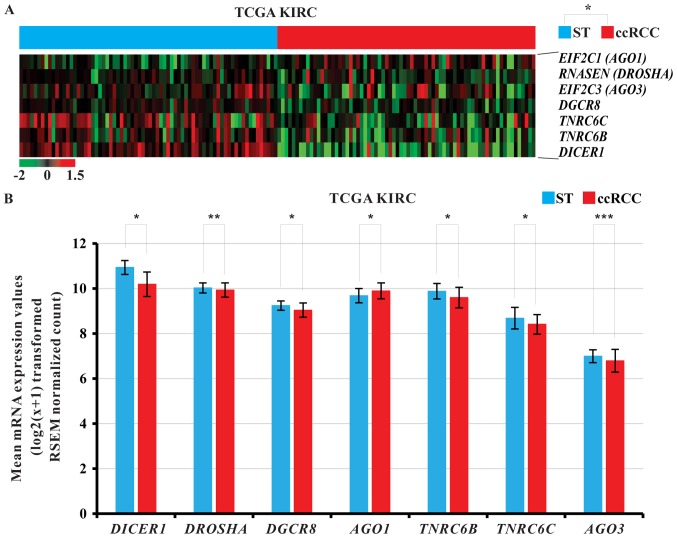
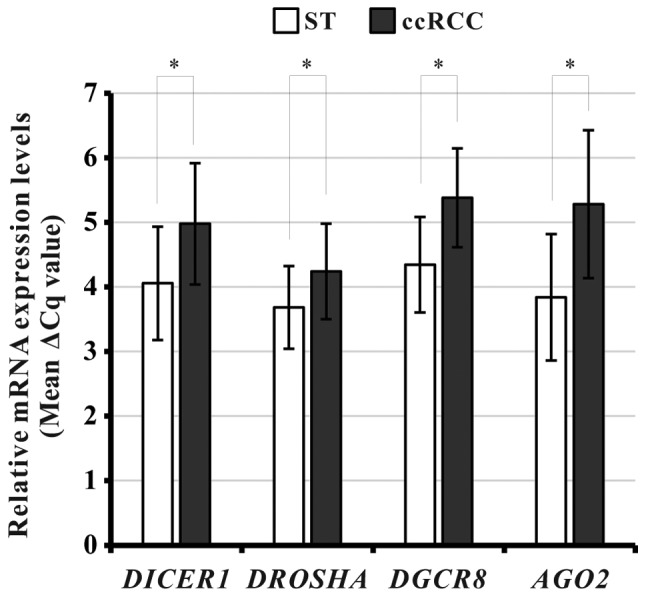
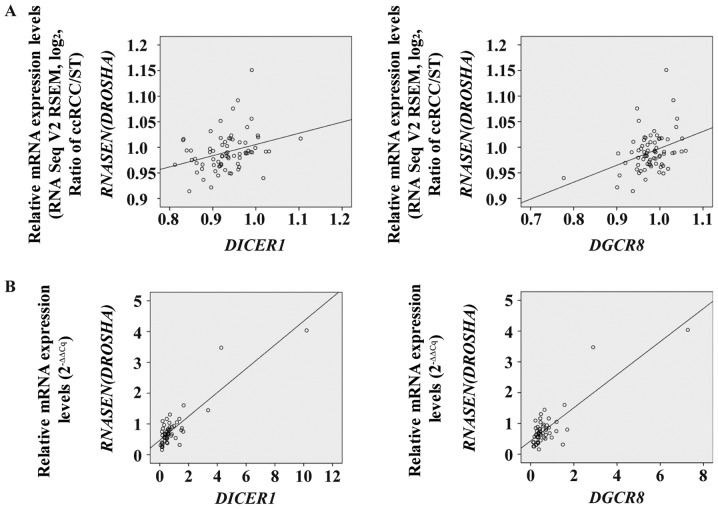
Impairment of microRNA (miRNA) biogenesis may be involved in clear cell renal cell carcinoma (ccRCC). The objective of the present study was to investigate the mRNA levels of important miRNA machinery components, DICER1, DROSHA, DiGeroge syndrome critical region gene 8 (DGCR8), and Argonaute 2 (AGO2), and their correlations with clinicopathological characteristics of ccRCC using mRNA expression data from The Cancer Genome Atlas kidney clear cell carcinoma (TCGA KIRC) cohort and a Korean ccRCC cohort. mRNA levels of DICER1, DROSHA, and DGCR8 were significantly decreased in both cohorts. However, AGO2 was significantly downregulated only in the Korean ccRCC cohort. Additionally, positive correlations were observed between the altered mRNA levels of DICER1 and DROSHA as well as DROSHA and DGCR8 in both cohorts. In the TCGA KIRC cohort, alterations in the mRNA levels of DICER1 were significantly correlated with histological grade. Furthermore, the altered mRNA levels of DGCR8 showed significant associations with sex and histologic grades. However, in the Korean ccRCC cohort, no factors were significantly associated with any clinicopathological parameters, including sex, age, T stage, Fuhrman grade/The International Society of Urological Pathology grade, lymphovascular invasion, and peri-renal fat invasion. Taken together, these findings indicate that DICER1, DROSHA, DGCR8 and AGO2 are significantly dysregulated in ccRCC, suggesting that they are important in the pathophysiology of this malignancy.
Keywords: clear cell renal cell carcinoma; miRNA biogenesis; the cancer genome atlas.
Figures
Similar articles
-
Racial Differences in Expression Levels of miRNA Machinery-Related Genes, Dicer, Drosha, DGCR8, and AGO2, in Asian Korean Papillary Thyroid Carcinoma and Comparative Validation Using the Cancer Genome Atlas.Int J Genomics. 2017;2017:5789769. doi: 10.1155/2017/5789769. Epub 2017 Mar 2. Int J Genomics. 2017. PMID: 28352639 Free PMC article.
-
Genes Involved in miRNA Biogenesis Are Not Downregulated in SARS-CoV-2 Infection.Viruses. 2023 May 16;15(5):1177. doi: 10.3390/v15051177. Viruses. 2023. PMID: 37243263 Free PMC article.
-
The Expression of AGO2 and DGCR8 in Idiopathic Sudden Sensorineural Hearing Loss.Clin Exp Otorhinolaryngol. 2014 Dec;7(4):269-74. doi: 10.3342/ceo.2014.7.4.269. Epub 2014 Nov 14. Clin Exp Otorhinolaryngol. 2014. PMID: 25436045 Free PMC article.
-
MicroRNA Machinery Genes as Novel Biomarkers for Cancer.Front Oncol. 2014 May 19;4:113. doi: 10.3389/fonc.2014.00113. eCollection 2014. Front Oncol. 2014. PMID: 24904827 Free PMC article. Review.
-
Does chromophobe renal cell carcinoma have better survival than clear cell renal cell carcinoma? A clinical-based cohort study and meta-analysis.Int Urol Nephrol. 2016 Feb;48(2):191-9. doi: 10.1007/s11255-015-1161-3. Epub 2015 Nov 20. Int Urol Nephrol. 2016. PMID: 26589610 Review.
Cited by
-
Argonaute Proteins Take Center Stage in Cancers.Cancers (Basel). 2021 Feb 13;13(4):788. doi: 10.3390/cancers13040788. Cancers (Basel). 2021. PMID: 33668654 Free PMC article. Review.
-
Synthesis and Regulation of miRNA, Its Role in Oncogenesis, and Its Association with Colorectal Cancer Progression, Diagnosis, and Prognosis.Diagnostics (Basel). 2024 Jul 7;14(13):1450. doi: 10.3390/diagnostics14131450. Diagnostics (Basel). 2024. PMID: 39001340 Free PMC article. Review.
-
Implication of microRNAs in Carcinogenesis with Emphasis on Hematological Malignancies and Clinical Translation.Int J Mol Sci. 2022 May 23;23(10):5838. doi: 10.3390/ijms23105838. Int J Mol Sci. 2022. PMID: 35628648 Free PMC article. Review.
-
microRNAs Biogenesis, Functions and Role in Tumor Angiogenesis.Front Oncol. 2020 Nov 27;10:581007. doi: 10.3389/fonc.2020.581007. eCollection 2020. Front Oncol. 2020. PMID: 33330058 Free PMC article. Review.
-
Circular RNA profiling identifies circ102049 as a key regulator of colorectal liver metastasis.Mol Oncol. 2021 Feb;15(2):623-641. doi: 10.1002/1878-0261.12840. Epub 2020 Dec 29. Mol Oncol. 2021. PMID: 33131207 Free PMC article.
References
LinkOut - more resources
Full Text Sources