Clinical Trial
. 2019 Aug 8;6(5):e598.
doi: 10.1212/NXI.0000000000000598. eCollection 2019 Sep.

High serum neurofilament light chain normalizes after hematopoietic stem cell transplantation for MS

Affiliations
Clinical Trial

High serum neurofilament light chain normalizes after hematopoietic stem cell transplantation for MS

Simon Thebault et al. Neurol Neuroimmunol Neuroinflamm. .

Abstract

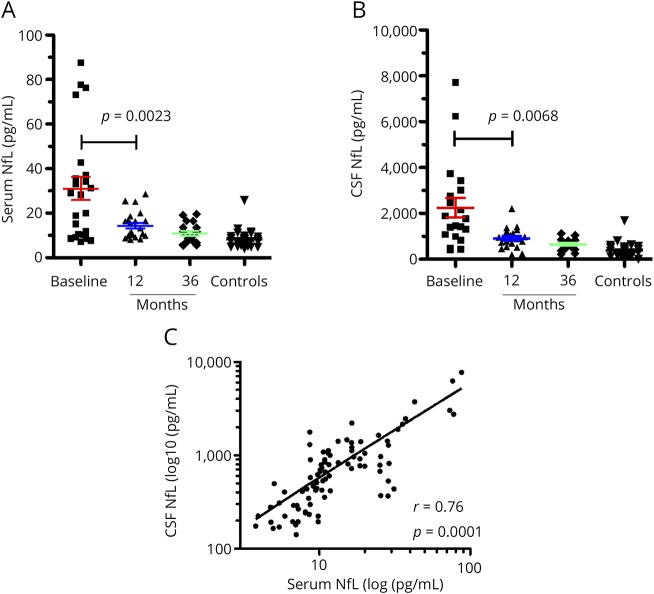
Objective: To evaluate neurofilament light chain (NfL) levels in serum and CSF of patients with aggressive MS pre- and post-treatment with immunoablation followed by autologous hematopoietic stem cell transplantation (IAHSCT) and examine associations with clinical and MRI outcomes.

Methods: Paired serum and CSF in addition to MRI and clinical measures were collected on 23 patients with MS at baseline and 1 and 3 years post-IAHSCT. An additional 33 sera and CSF pairs were taken from noninflammatory neurologic controls. NfL levels were quantitated using the Simoa platform (Quanterix).

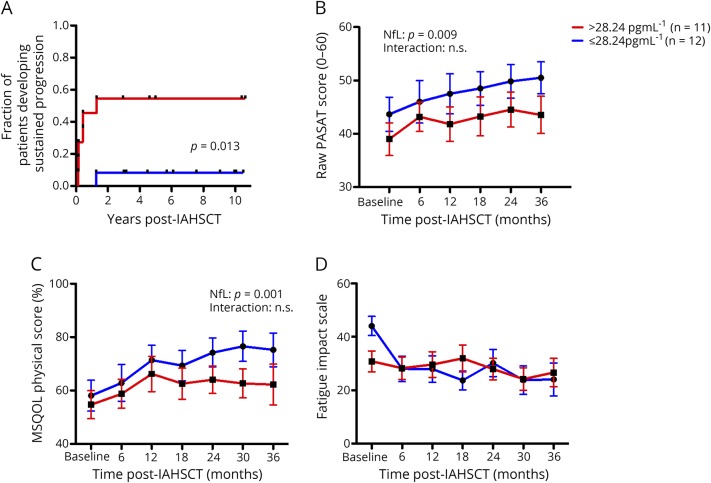
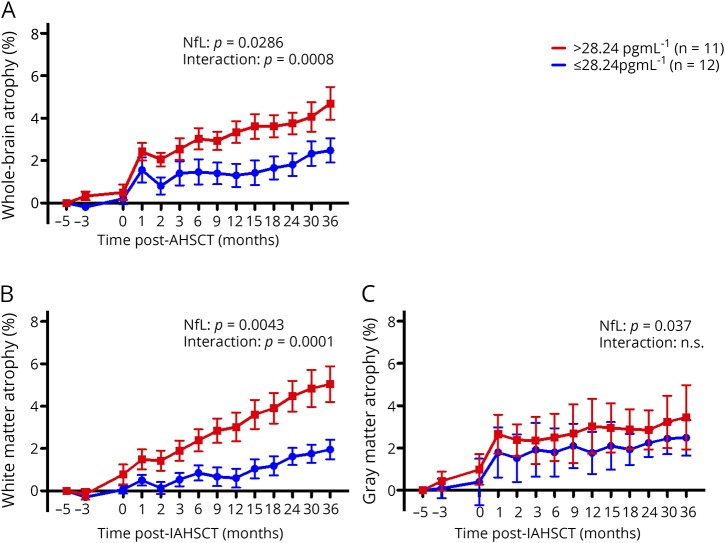
Results: Baseline MS NfL levels were significantly elevated relative to controls in serum (p = 0.001) and CSF (p = 0.001). Following IAHSCT, high pretreatment NfL levels significantly reduced in serum (p = 0.0023) and CSF (p = 0.0068) and were not significantly different from controls. Serum and CSF NfL levels highly correlated (r = 0.81, p < 0.0001). Baseline NfL levels were associated with worse pretreatment disease measures (Expanded Disability Status Scale [EDSS], relapses, MRI lesions, and MR spectroscopy (MRS) N-acetylaspartate/creatine). Elevated baseline NfL levels were associated with persistently worse indices of disease burden post-IAHSCT (sustained EDSS progression, cognition, quality of life, T1 and T2 lesion volumes, MRS, and brain atrophy).

Conclusion: These data substantiate that serum and CSF NfL levels reflect disease severity and treatment response in patients with MS and may therefore be a useful biomarker. Baseline serum levels associated with markers of pretreatment disease severity and post-treatment outcomes.

Classification of evidence: This study provides Class II evidence that for patients with aggressive MS, serum NfL levels are associated with disease severity.


Figures

Figure 1
Figure 1. Serum and CSF neurofilament levels following Immunoablative Autologous Haematopoietic Stem Cell Transplant
Baseline NfL levels (n = 23) were significantly elevated relative to controls (n=33) in (A), serum (p = 0.0001, 95% CI 13.33-32.38) and (B), CSF (p = 0.0001, 95% CI 1122-2638 ). Following IAHSCT, levels significantly reduced in both compartments (serum p=0.0023, 95% CI 6.39-26.94; CSF p = 0.0068, 95% CI 522.0-2141). Post-ASCT NfL levels (12 and 36m) in both serum and CSF were not significantly different from controls (p ≥ 0.05). Serum and CSF NfL levels were c, correlated (p = 0.0001, Spearman r = 0.76). 12m: 12 months post IAHSCT. 36m: 36 months post IAHSCT. Error bars represent the standard error of the mean. CI = confidence interval; IAHSCT = immunoablation followed by autologous hematopoietic stem cell transplantation; NfL = neurofilament light chain.
Figure 2
Figure 2. Baseline clinical status of patients and serum NfL levels
Patients who had a baseline NfL greater than the median value (>28.24 pgml-1, red line, n = 11) had rapidly reached EDSS score of 6 prior to IAHSCT, (A), median duration 6.91 years, compared to patients with lower levels (≤28.24 pgml-1, blue line, n = 12). Nine of the 23 patients had clinical relapses in the 12 months prior to IAHSCT. On average these patients had higher baseline serum NfL compared to the 13 patients who had not (p = 0.047). Error bars represent the standard error of the mean. EDSS = Expanded Disability Status Scale; IAHSCT = immunoablation followed by autologous hematopoietic stem cell transplantation; NfL = neurofilament light chain.
Figure 3
Figure 3. Baseline NfL levels and post IAHSCT clinical outcomes
A baseline serum Nf-L greater than the median value (>28.24 pgml-1, red line, n = 11) compared to less than the median (<28.24 pgml-1, blue line, n = 12) was associated with (A) a greater chance of experiencing sustained progression (p = 0.029, Kaplan-Meir Log-rank test), (B) worse cognitive outcomes (p = 0.009), and (C) worse quality of life scores (p = 0.001) after IAHSCT. There were no differences in (D) fatigue scores following AHSCT. All interactions were non-significant, indicating that differences, where seen, were attributable to baseline differences between the high and low NfL groups. Error bars represent the standard error of the mean. IAHSCT = immunoablation followed by autologous hematopoietic stem cell transplantation; NfL = neurofilament light chain; ns = non-significant.
Figure 4
Figure 4. Baseline NfL levels and post IAHSCT MRI outcomes
A baseline serum Nf-L >28.24 pgml-1 (red lines, n = 11) compared to <28.24 pgml-1 (blue lines, n = 12) was associated with (A) greater T1 lesion volumes (p = 0.017), (B) greater T2 lesion volumes (p = 0.0009) and (C) reduced MRI spectroscopy NAA/Cr ratio (p = 0.0038). The interaction of NfL over time was only significant for T1, accounting for 0.9% of the variability; patients with high baseline NfL had slightly more T1 lesion volume accrual post-treatment. Error bars represent the standard error. NfL = neurofilament light chain.
Figure 5
Figure 5. Baseline NfL levels and post IAHSCT MRI brain atrophy
High baseline NfL (>28.24 pgml-1, red lines, n = 11) was associated with (A) more brain atrophy following AHSCT (p = 0.029) compared to low baseline NfL (<28.24 pgml-1, blue lines, n = 12). Moreover, the high NfL group continued to endure a greater rate of on-going brain atrophy post IAHSCT signified by the interaction of NfL over time between the groups (p = 0.0008, 3.51% of total variation). This was more attributable to (B) white matter (p = 0.0043) rather than (C) grey matter volume loss (p = 0.037). The greatest differential rate of brain atrophy was seen in the white matter which persisted at 36 months post IAHSCT (p < 0.0001). Error bars represent the standard error. IAHSCT = immunoablation followed by autologous hematopoietic stem cell transplantation; NfL = neurofilament light chain.

Comment in

References

    1. Freedman MS. Induction vs. escalation of therapy for relapsing multiple sclerosis: the evidence. Neurol Sci 2008;29:250–252. - PubMed
    1. Wattjes MP, Steenwijk MD, Stangel M. MRI in the diagnosis and monitoring of multiple sclerosis: an update. Clin Neuroradiol 2015;25:157–165. - PubMed
    1. Rovira Á, Wattjes MP, Tintoré M, et al. . Evidence-based guidelines: MAGNIMS consensus guidelines on the use of MRI in multiple sclerosis—clinical implementation in the diagnostic process. Nat Rev Neurol 2015;11:471–482. - PubMed
    1. Nielsen S, Nagelhus EA, Amiry-Moghaddam M. Specialized membrane domains for water transport in glial cells: high-resolution immunogold cytochemistry of aquaporin-4 in rat brain. J Neurosci 1997;17:171–180. - PMC - PubMed
    1. Kearney H, Miller DH, Ciccarelli O. Spinal cord MRI in multiple sclerosis-diagnostic, prognostic and clinical value. Nat Rev Neurol 2015;11:327–338. - PubMed

Publication types