

Model-based approach to the design of pharmaceutical roller-compaction processes
- PMID: 31517270
- PMCID: PMC6733294
- DOI: 10.1016/j.ijpx.2019.100005
Model-based approach to the design of pharmaceutical roller-compaction processes
Erratum in
-
Erratum regarding missing Conflict of Interest statements in previously published articles.Int J Pharm X. 2021 Jan 22;4:100071. doi: 10.1016/j.ijpx.2020.100071. eCollection 2022 Dec. Int J Pharm X. 2021. PMID: 36573183 Free PMC article.
Abstract
This work presents a new model based approach to process design and scale-up within the same equipment of a roller compaction process. The prediction of the operating space is not performed fully in-silico, but uses low-throughput experiments as input. This low-throughput data is utilized in an iterative calibration routine to describe the behavior of the powder in the roller compactor and improves the predictive quality of the mechanistic models at low and high-throughput. The model has been validated with an experimental design of experiments of two ibuprofen formulations. The predicted sweet spots in the operating space are in good agreement with the experimental results.
Keywords: Design space prediction; Roller compaction; Solid fraction; Throughput.
Figures
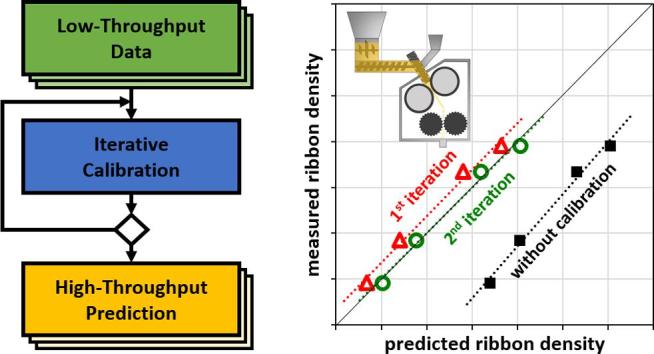
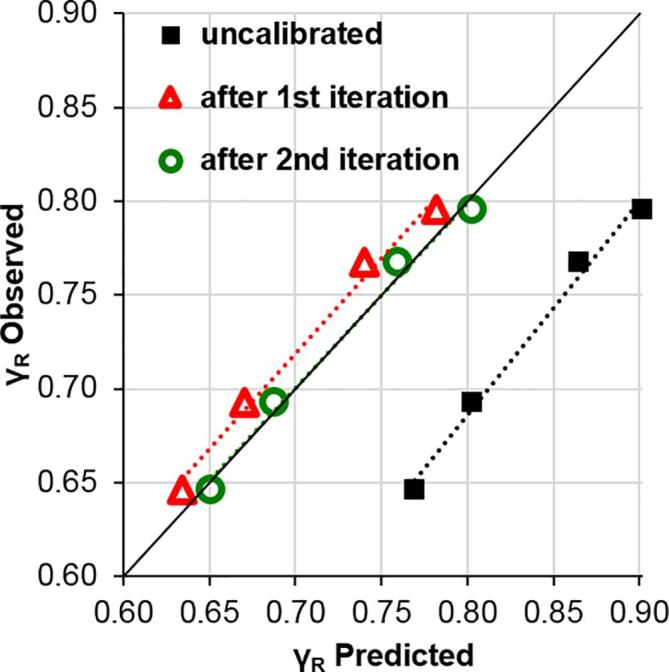
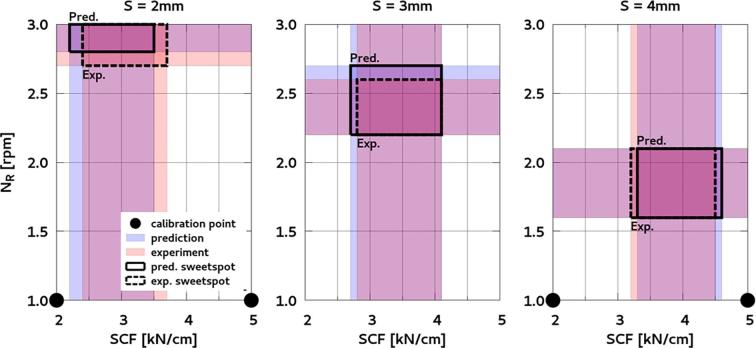
 ) and the ribbon solid fraction prediction after a second iteration (
 ).
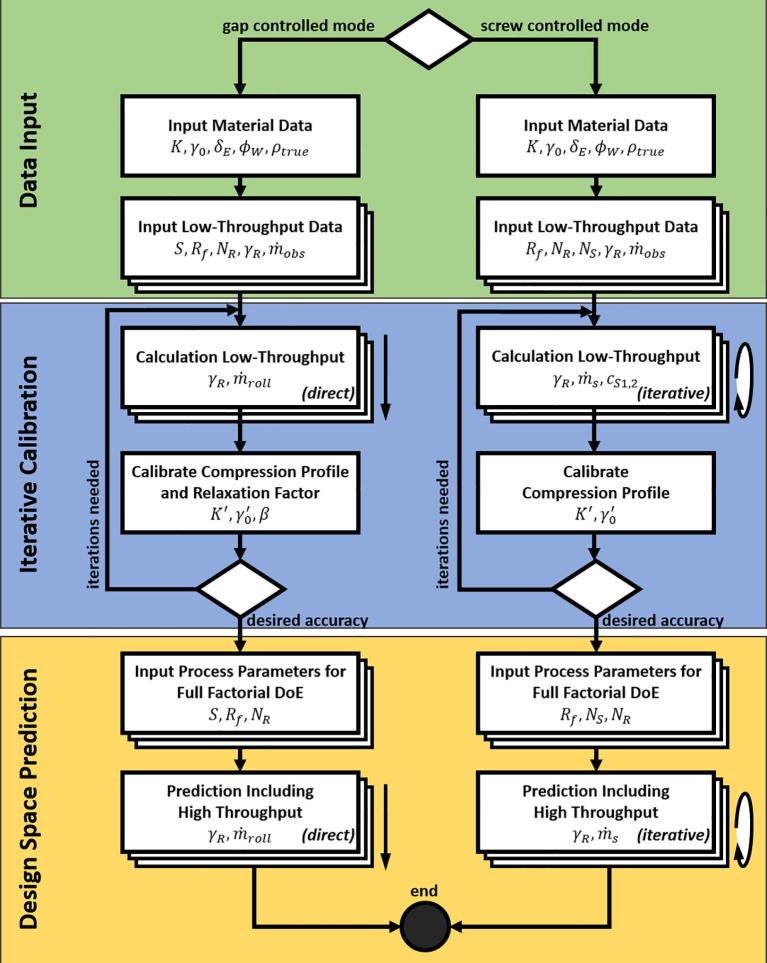
).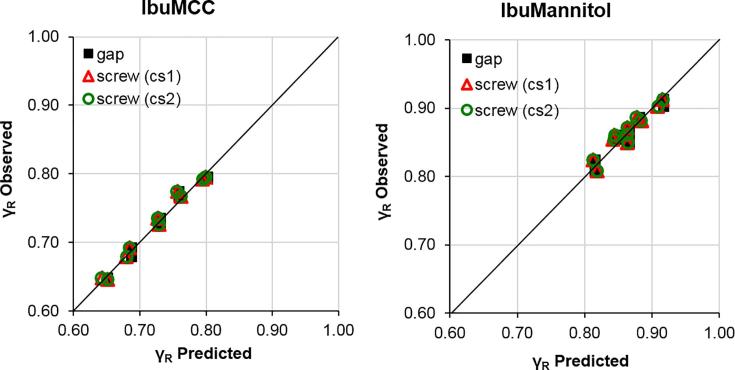 ) or cS2 () as the model input.
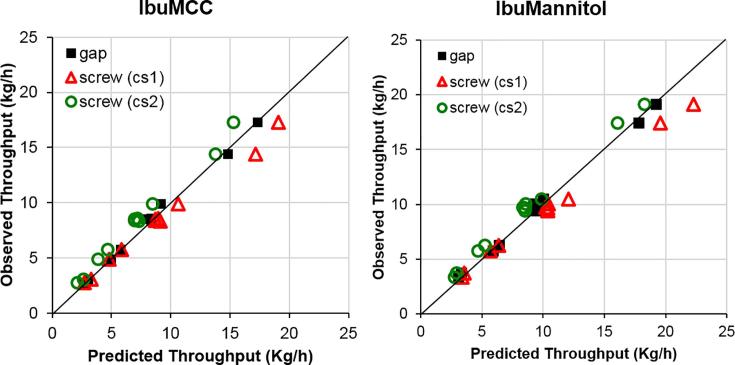 ) or cS2 ().
References
-
- Bi M., Alvarez-Nunez F., Alvarez F. Evaluating and Modifying Johanson’s Rolling Model to Improve its Predictability. J. Pharm. Sci. 2014;103:2062–2071. - PubMed
-
- Csordas K., Wiedey R., Kleinebudde P. Impact of roll compaction design, process parameters, and material deformation behaviour on ribbon relative density. Drug Dev. Ind. Pharm. 2018;44:1295–1306. - PubMed
-
- Cunningham J.C. Drexel University; 2005. Experimental studies and modeling of the roller compaction of pharmaceutical powders (PhD Thesis)
-
- Dec R.T., Zavaliangos A., Cunningham J.C. Comparison of various modeling methods for analysis of powder compaction in roller press. Powder Technol. 2003;130:265–271.
LinkOut - more resources
Full Text Sources
