. 2020 Jun;16(6):1044-1060.
doi: 10.1080/15548627.2019.1659608. Epub 2019 Sep 13.

De novo phosphatidylcholine synthesis is required for autophagosome membrane formation and maintenance during autophagy

Affiliations

De novo phosphatidylcholine synthesis is required for autophagosome membrane formation and maintenance during autophagy

Gabriela Andrejeva et al. Autophagy. 2020 Jun.

Erratum in

  • Correction.
    [No authors listed] [No authors listed] Autophagy. 2025 Mar;21(3):iii. doi: 10.1080/15548627.2024.2431342. Epub 2025 Jan 15. Autophagy. 2025. PMID: 39814343 Free PMC article. No abstract available.

Abstract

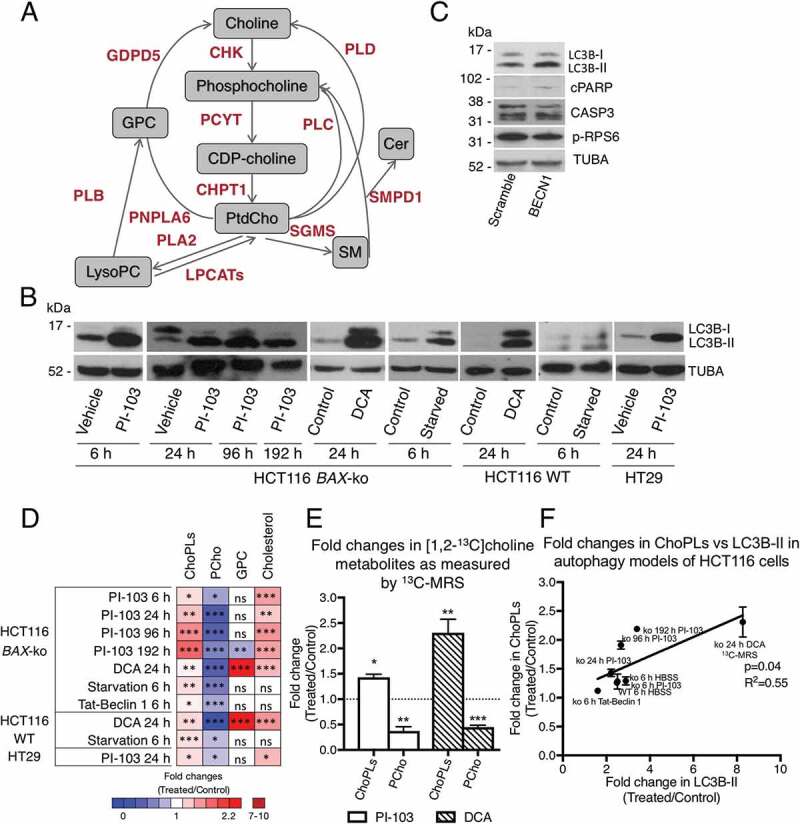
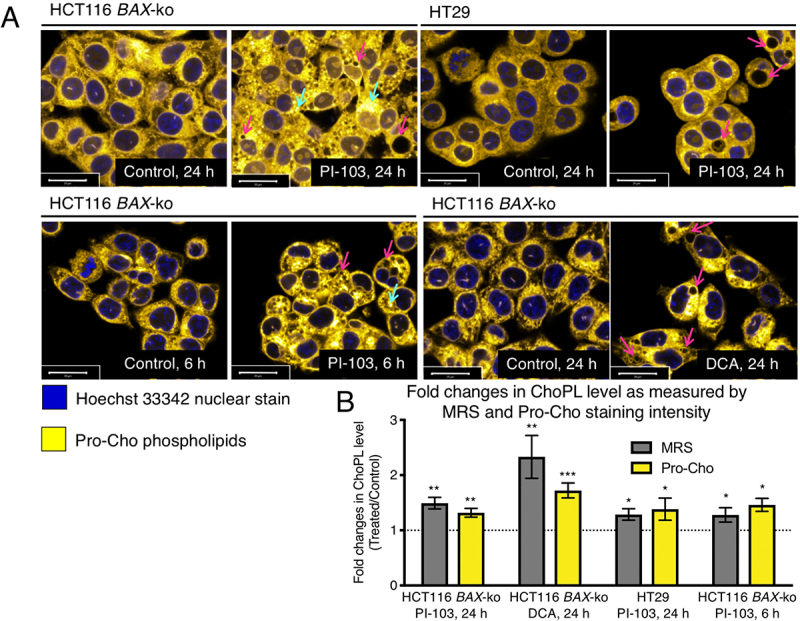
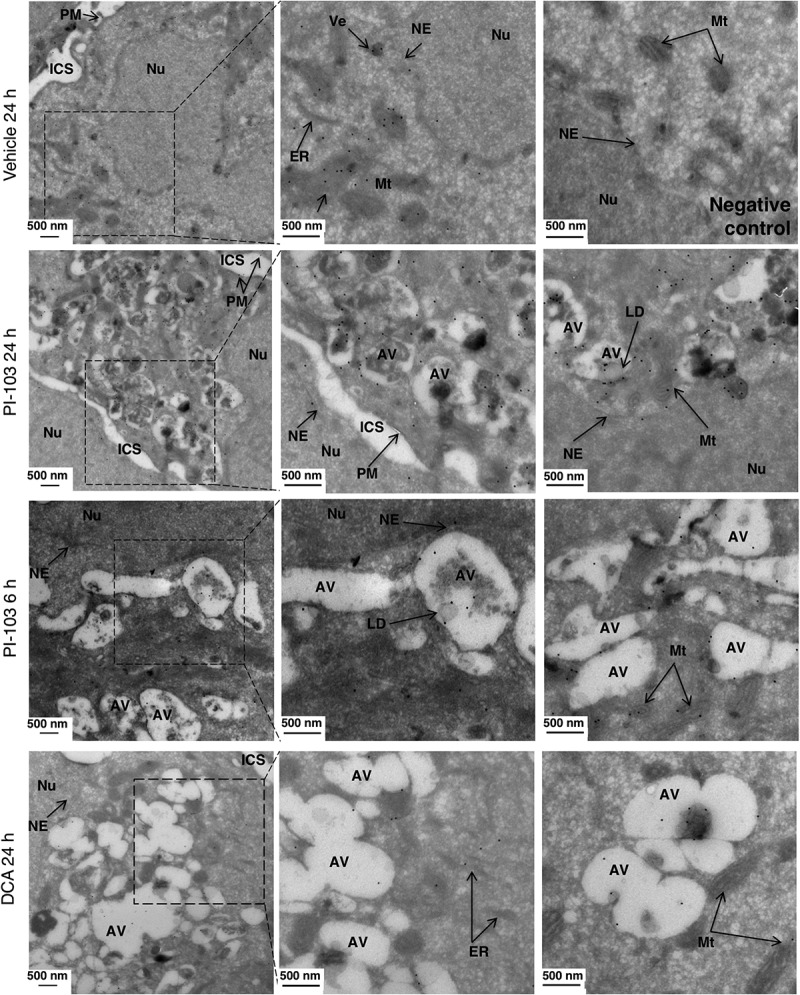
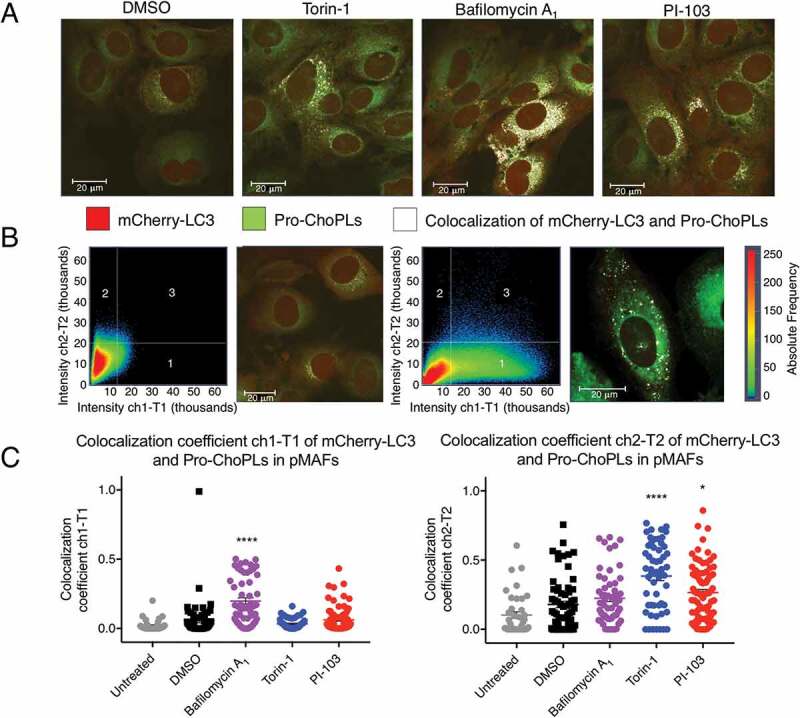
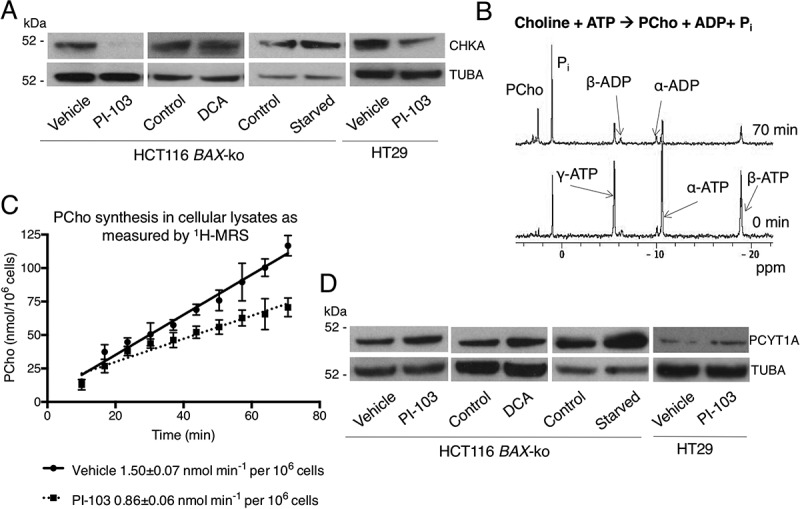
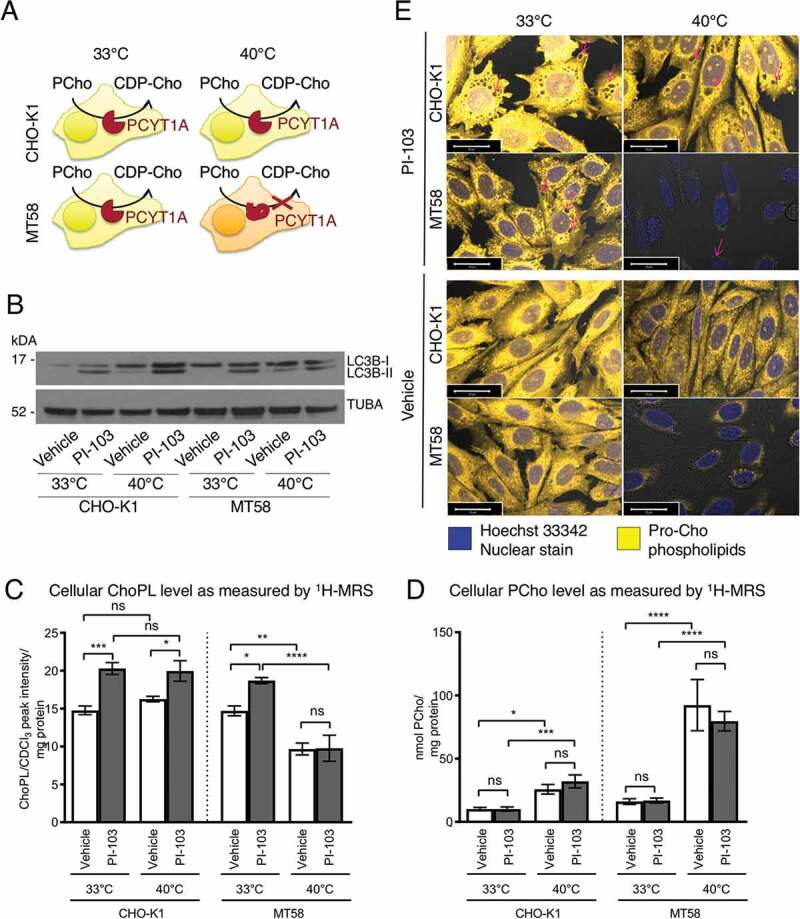
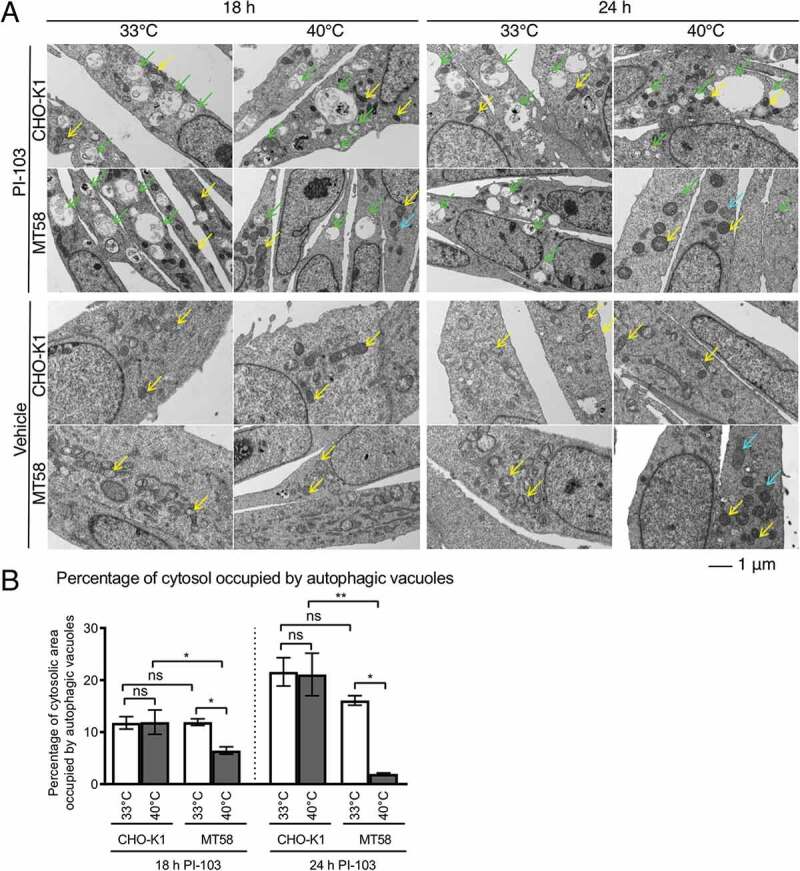
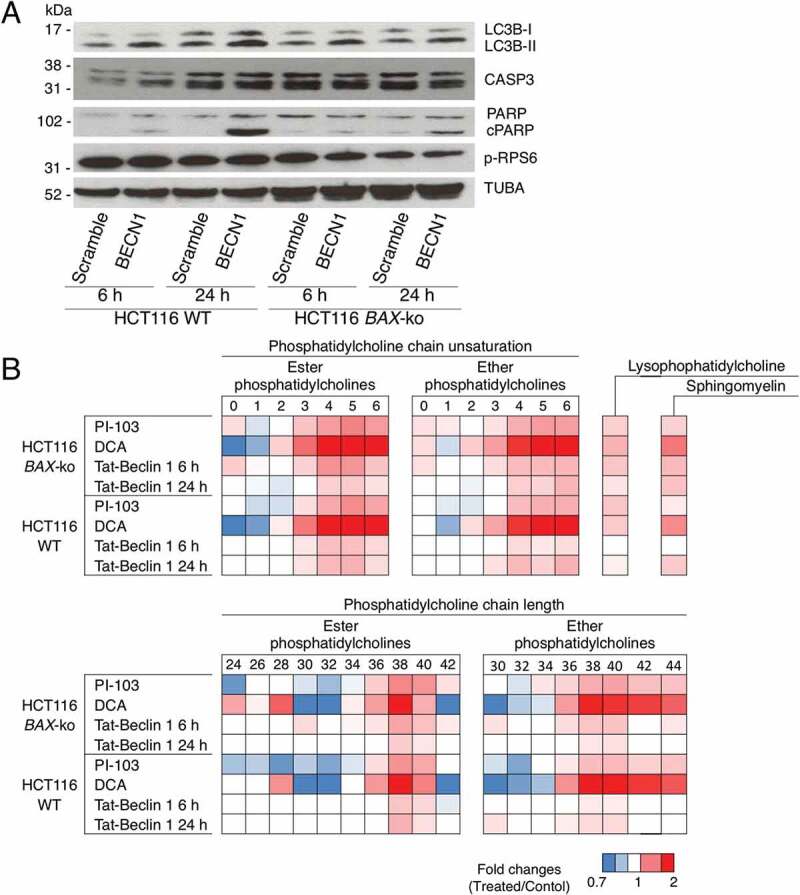
Macroautophagy/autophagy can enable cancer cells to withstand cellular stress and maintain bioenergetic homeostasis by sequestering cellular components into newly formed double-membrane vesicles destined for lysosomal degradation, potentially affecting the efficacy of anti-cancer treatments. Using 13C-labeled choline and 13C-magnetic resonance spectroscopy and western blotting, we show increased de novo choline phospholipid (ChoPL) production and activation of PCYT1A (phosphate cytidylyltransferase 1, choline, alpha), the rate-limiting enzyme of phosphatidylcholine (PtdCho) synthesis, during autophagy. We also discovered that the loss of PCYT1A activity results in compromised autophagosome formation and maintenance in autophagic cells. Direct tracing of ChoPLs with fluorescence and immunogold labeling imaging revealed the incorporation of newly synthesized ChoPLs into autophagosomal membranes, endoplasmic reticulum (ER) and mitochondria during anticancer drug-induced autophagy. Significant increase in the colocalization of fluorescence signals from the newly synthesized ChoPLs and mCherry-MAP1LC3/LC3 (microtubule-associated protein 1 light chain 3) was also found on autophagosomes accumulating in cells treated with autophagy-modulating compounds. Interestingly, cells undergoing active autophagy had an altered ChoPL profile, with longer and more unsaturated fatty acid/alcohol chains detected. Our data suggest that de novo synthesis may be required to increase autophagosomal ChoPL content and alter its composition, together with replacing phospholipids consumed from other organelles during autophagosome formation and turnover. This addiction to de novo ChoPL synthesis and the critical role of PCYT1A may lead to development of agents targeting autophagy-induced drug resistance. In addition, fluorescence imaging of choline phospholipids could provide a useful way to visualize autophagosomes in cells and tissues.

Abbreviations: AKT: AKT serine/threonine kinase; BAX: BCL2 associated X, apoptosis regulator; BECN1: beclin 1; ChoPL: choline phospholipid; CHKA: choline kinase alpha; CHPT1: choline phosphotransferase 1; CTCF: corrected total cell fluorescence; CTP: cytidine-5'-triphosphate; DCA: dichloroacetate; DMEM: dulbeccos modified Eagles medium; DMSO: dimethyl sulfoxide; EDTA: ethylenediaminetetraacetic acid; ER: endoplasmic reticulum; GDPD5: glycerophosphodiester phosphodiesterase domain containing 5; GFP: green fluorescent protein; GPC: glycerophosphorylcholine; HBSS: hanks balances salt solution; MAP1LC3/LC3: microtubule associated protein 1 light chain 3; LPCAT1: lysophosphatidylcholine acyltransferase 1; LysoPtdCho: lysophosphatidylcholine; MRS: magnetic resonance spectroscopy; MTORC1: mechanistic target of rapamycin kinase complex 1; PCho: phosphocholine; PCYT: choline phosphate cytidylyltransferase; PLA2: phospholipase A2; PLB: phospholipase B; PLC: phospholipase C; PLD: phospholipase D; PCYT1A: phosphate cytidylyltransferase 1, choline, alpha; PI3K: phosphoinositide-3-kinase; pMAFs: pancreatic mouse adult fibroblasts; PNPLA6: patatin like phospholipase domain containing 6; Pro-Cho: propargylcholine; Pro-ChoPLs: propargylcholine phospholipids; PtdCho: phosphatidylcholine; PtdEth: phosphatidylethanolamine; PtdIns3P: phosphatidylinositol-3-phosphate; RPS6: ribosomal protein S6; SCD: stearoyl-CoA desaturase; SEM: standard error of the mean; SM: sphingomyelin; SMPD1/SMase: sphingomyelin phosphodiesterase 1, acid lysosomal; SGMS: sphingomyelin synthase; WT: wild-type.

Keywords: Autophagosome; CTP:phosphocholine cytidylyltransferase; autophagy; choline phospholipids; phosphatidylcholine; propargylcholine.


Conflict of interest statement

No potential conflict of interest was reported by the authors.

Figures

Figure 1.
Figure 1.
Changes in choline metabolism in cell models of autophagy. (A) A simplified diagram of cellular choline metabolism. Key metabolites are shown in gray boxes, enzymes of choline phospholipid metabolism are shown in red. (B) Western blots of autophagy marker LC3B in 20 μM PI-103 (6, 24, 96 and 192 h) or 75 mM DCA (24 h) or starvation (6 h)-treated HCT116 BAX-ko cells, in 75 mM DCA (24 h) and starvation (6 h)-treated HCT116 WT, and in 100 μM PI-103 (24 h)-treated HT29 cells. TUBA was used as a loading control. (C) Western blot of autophagy marker LC3B, apoptosis marker cleaved PARP (cPARP) and CASP3, and p-RPS6 in HCT116 BAX-ko cells treated with 50 μM Tat-Beclin 1 or 50 μM Tat-Scramble control for 6 h. TUBA was used as a loading control. (D) Summary of changes in cellular choline metabolites and cholesterol in drug- or starvation-induced autophagy models. Data shown are means of fold changes and presented as a color-coded heat map for different treatment groups compared with their respective controls. (E) Fold changes in [1,2-13C]choline metabolites in HCT116 BAX-ko cells treated with 20 μM PI-103 (24 h) or 75 mM DCA (24 h). Normal medium was substituted for medium containing [1,2-13C]choline instead of unlabeled choline in the last 6 h of treatment. Data expressed as mean ± SEM, n = 3 in each group. (F) ChoPL level as measured by MRS versus LC3B-II expression as measured by western blot densitometry in HCT116 cell autophagy models. Data expressed as fold change (treated/control). Statistically significant changes are indicated: *p < 0.05, **p < 0.01, ***p < 0.001.
Figure 2.
Figure 2.
Increased synthesis and vacuolar appearance of Pro-Cho-labeled phospholipids in drug-induced autophagic cells. (A) Imaging of Pro-ChoPLs in 20 μM PI-103 (24 h and 6 h)-treated HCT116 BAX-ko cells, 100 μM PI-103 (24 h)-treated HT29 cells and in 75 mM DCA (24 h)-treated HCT116 BAX-ko cells. Pro-Cho was added together with the PI-103 treatment but in the last 6 h of DCA treatment to adjust for the difference in the timing of autophagy onset between the two treatments (Figure S2). The cells were then stained with Alexa Fluor 647-azide. Magenta arrows indicate potential autophagosomes or autolysosomes as vesicles enclosed in Pro-ChoPL membranes, cyan arrows indicate potential autophagosomes with autophagic cargo containing Pro-ChoPLs. Scale bar 20 μm. (B) Fold changes in ChoPL level in drug-induced autophagy as measured by 1H-MRS (for PI-103 treatments) and 13C-MRS (for DCA treatment) in comparison to corrected total cell fluorescence as obtained by propargyl-choline incorporation and staining. Data expressed as mean ± SEM, min n = 3 in each group. Statistically significant changes are indicated: *p < 0.05, **p < 0.01, ***p < 0.001.
Figure 3.
Figure 3.
Localization of Pro-ChoPLs during drug-induced autophagy. Imaging of Pro-ChoPLs in 20 μM PI-103 (24 h and 6 h), and in 75 mM DCA (24 h)-treated HCT116 BAX-ko cells by immuno-electron microscopy. Pro-Cho was added together with the vehicle- or PI-103 treatment, but in the last 6 h of DCA treatment to adjust for the difference in the timing of autophagy onset between the two treatments (Figure S2). No Pro-Cho was added for the negative, vehicle-treated control. The cells were fixed, sectioned and Pro-ChoPLs reacted with biotin-azide. The sections were incubated with anti-biotin antibodies and protein A gold, counterstained with uranyl acetate and imaged by transmission electron microscopy. Arrows indicate various cellular structures: AV, autophagic vacuole; ER, endoplasmic reticulum; ICS, intercellular space; Mt, mitochondrion; NE, nuclear envelope; Nu, nucleus; PM, plasma membrane; Ve, vesicle.
Figure 4.
Figure 4.
Colocalization of Pro-ChoPLs and mCherry-LC3 fluorescence signals in drug-induced autophagic mCherry-GFP-LC3 pMAFs. (A) Imaging of Pro-ChoPLs and mCherry-LC3 in mCherry-GFP-LC3 pMAF cells following 6 h of 250 nM Torin-1, 200 nM bafilomycin A1, 20 µM PI-103 or DMSO treatment. These pMAF cells were treated in the last 6 h before the end of 24 h incubation with Pro-Cho and then stained with Alexa Fluor 350-azide. The Pro-ChoPL signals were pseudo-colored to green using the Zeiss software on the microscope, in order to enhance the contrast against the red signal. The yellow signals (colocalization of the Pro-ChoPLs and mCherry-LC3 staining) were artificially colored to white using the software on the microscope, in order to enhance the contrast against the red and green signals. Scale bar: 20 μm. (B) Colocalization Pro-ChoPLs and mCherry-LC3 showed in a scatterplot (pixels in quadrant 3) and fluorescence image (white signals) in DMSO- or bafilomycin A1-treated mCherry-GFP-LC3 pMAFs. (C) The colocalization coefficient ch1-T1 and colocalization coefficient ch2-T2 in mCherry-GFP-LC3 pMAF cells following various treatments. Bars represent mean ± SEM. ****P < 0.0001; *P < 0.05 when compared to DMSO controls.
Figure 5.
Figure 5.
Changes in CHKA and PCYT1A expression and activation in autophagy models. (A) Western blots of CHKA, the main CHK isoform, in 20 μM PI-103 (24 h)-, 75 mM DCA (24 h)-treated and in 6 h starved (in HBSS) HCT116 BAX-ko cells and in 100 μM PI-103 (24 h)-treated HT29 cells, TUBA was used as a loading control. (B) Choline kinase activity measurements: 31P NMR of the extracted cytoplasm of vehicle (24 h)-treated HCT116 BAX-ko cells after addition of exogenous choline, ATP and MgCl2 at the start and at the end of the measurement. (C) The increase of PCho peak integral over time in the soluble HCT116 BAX-ko cell lysates after the addition of exogenous choline, ATP, and MgCl2. The cells were lysed after 24 h of treatment with DMSO control or 20 μM PI-103. A linear fit to the data yields the rate constant. Data expressed as mean ± SEM, n = 3. (D) Western blots of PCYT1A in HCT116 BAX-ko cells following 20 μM PI-103 (24 h), 75mM DCA (24 h) or HBSS (6 h; starved) treatment, and in HT29 cells following 100 μM PI-103 (24 h) treatment. TUBA was used as loading control.
Figure 6.
Figure 6.
PI-103-induced autophagy and ChoPLs in cells with impaired PCYT1A activity. (A) Schematic of PCYT1A activity in wild type Cho cell line CHO-K1 and in MT58 cells, that contain a temperature sensitive mutation in PCYT1A, at the permissive temperature of 33°C and the restrictive temperature of 40°C. (B) Western blots of LC3B autophagy marker in DMSO (24 h)- and in 11.4 μM PI-103 (24 h)-treated CHO-K1 and MT58 cells at 33°C and 40°C. TUBA was used as a loading control. ChoPL (C) and PCho (D) levels in DMSO (24 h)- and PI-103 (24 h)-treated CHO-K1 and MT58 cells as measured by 1H-MRS. Data expressed as mean ± SEM, n = 3 in each group. Statistically significant changes are indicated: *p < 0.05, **p < 0.01, ***p < 0.001, ****p < 0.0001. (E) Imaging of Pro-ChoPLs in DMSO (24 h)- and PI-103 (24 h)-treated CHO-K1 and MT58 cells at 33°C and 40°C. Pro-Cho was added together with the PI-103 treatment and the cells were then stained with Alexa Fluor 647-azide. Magenta arrows indicate potential autophagosomes or autolysosomes as vesicles enclosed in Pro-ChoPL membranes. Scale bar 20 μm.
Figure 7.
Figure 7.
Autophagosome morphology in PI-103-treated cells with impaired PCYT1A activity. (A) Transmission electron micrographs of 18 h- and 24 h- DMSO- and 11.4 μM PI-103-treated CHO-K1 and MT58 cells at the permissive temperature of 33°C and the restrictive temperature of 40°C. Green arrows indicate autophagosome and autolysosomes, yellow arrows indicate mitochondria and cyan arrows indicate ER sphericles. (B) The percentage of cytosolic area occupied by autophagic vacuoles in the transmission electron micrographs shown in (A). Data expressed as mean ± SEM, min n = 3 in each group. Statistically significant changes are indicated: *p < 0.05, **p < 0.01.
Figure 8.
Figure 8.
Choline phospholipid composition of autophagic cells. (A) Western blot of autophagy marker LC3B, apoptosis marker cleaved PARP (cPARP) and CASP3, and p-RPS6 in 6 h- or 24 h- HCT116 WT and HCT116 BAX-ko cells treated with 50 μM Tat-Beclin 1 or 50 μM Tat-Scramble control. TUBA was used as a loading control. (B) Fold changes in the composition of the measured PtdChos (ester and ether) in HCT116 BAX-ko and HCT116 WT cells treated for 24 h with 20 μM PI-103 or 75 mM DCA, 6 h and 24 h 50 μM Tat-Beclin 1 when compared to their respective controls (DMSO for PI-103, water for DCA and 50 μM Tat-Scramble for 50 μM Tat-Beclin 1). The PtdChos are categorized by the total number of double bonds in the fatty acid/alcohol chains of the phospholipid or the fatty acid/alcohol chain length. Fold changes in the sum of all measured SMs and LysoPtdChos of the same treatments are also indicated. Data expressed as a color-coded heat map of fold changes, n = 4 in each group. Only statistically significant changes (p < 0.05) are indicated in colors.

References

    1. Sui X, Chen R, Wang Z, et al. Autophagy and chemotherapy resistance: a promising therapeutic target for cancer treatment. Cell Death Dis. 2013;4:e838. PMID:24113172. - PMC - PubMed
    1. Chen N, Debnath J.. Autophagy and tumorigenesis. FEBS Lett. 2010;584:1427–1435. PMID:20035753. - PMC - PubMed
    1. Kroemer G, Mariño G, Levine B. Autophagy and the integrated stress response. Mol Cell. 2010;40:280–293. PMID:20965422. - PMC - PubMed
    1. Mizushima N, Yoshimori T, Ohsumi Y. The role of Atg proteins in autophagosome formation. Annu Rev Cell Dev Biol. 2011;27:107–132. PMID:21801009. - PubMed
    1. Axe EL, Walker SA, Manifava M, et al. Autophagosome formation from membrane compartments enriched in phosphatidylinositol 3-phosphate and dynamically connected to the endoplasmic reticulum. J Cell Biol. 2008;182:685–701. PMID:18725538. - PMC - PubMed

Publication types

MeSH terms