. 2019 Sep 13;19(1):917.
doi: 10.1186/s12885-019-6096-0.

Preclinical efficacy of dual mTORC1/2 inhibitor AZD8055 in renal cell carcinoma harboring a TFE3 gene fusion

Affiliations

Preclinical efficacy of dual mTORC1/2 inhibitor AZD8055 in renal cell carcinoma harboring a TFE3 gene fusion

Eric C Kauffman et al. BMC Cancer. .

Abstract

Background: Renal cell carcinomas (RCC) harboring a TFE3 gene fusion (TfRCC) represent an aggressive subset of kidney tumors. Key signaling pathways of TfRCC are unknown and preclinical in vivo data are lacking. We investigated Akt/mTOR pathway activation and the preclinical efficacy of dual mTORC1/2 versus selective mTORC1 inhibition in TfRCC.

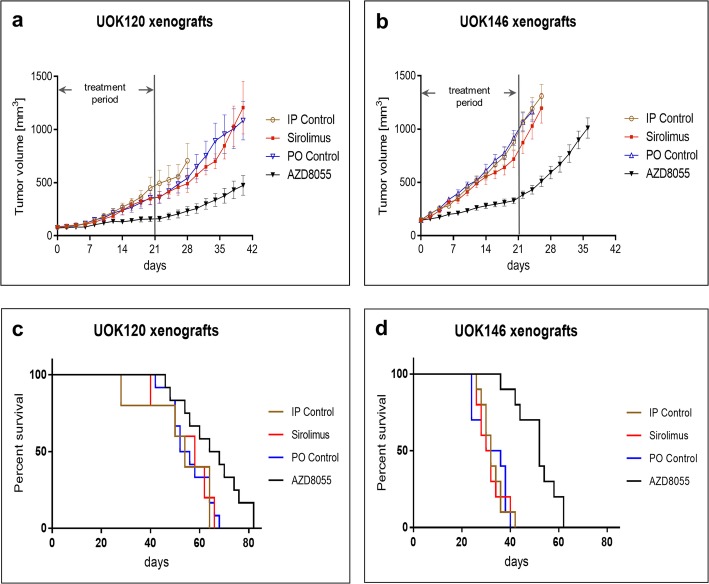
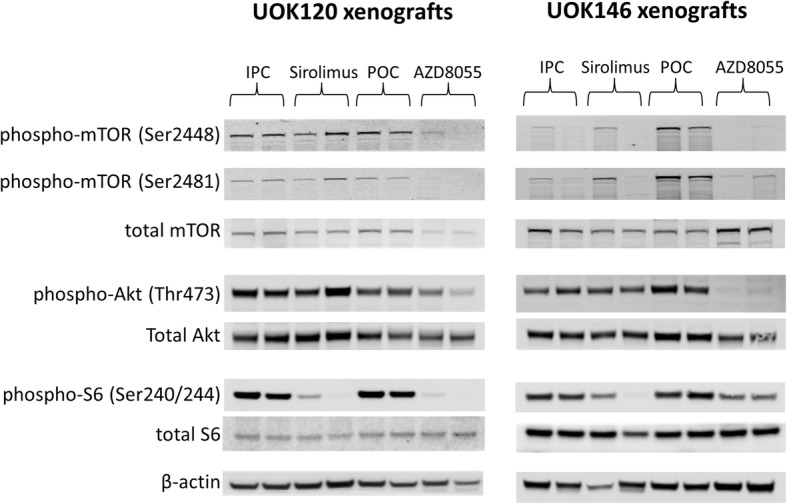
Methods: Levels of phosphorylated Akt/mTOR pathway proteins were compared by immunoblot in TfRCC and clear cell RCC (ccRCC) cell lines. Effects of the mTORC1 inhibitor, sirolimus, and the dual mTORC1/2 inhibitor, AZD8055, on Akt/mTOR activation, cell cycle progression, cell viability and cytotoxicity were compared in TfRCC cells. TfRCC xenograft tumor growth in mice was evaluated after 3-week treatment with oral AZD8055, intraperitoneal sirolimus and respective vehicle controls.

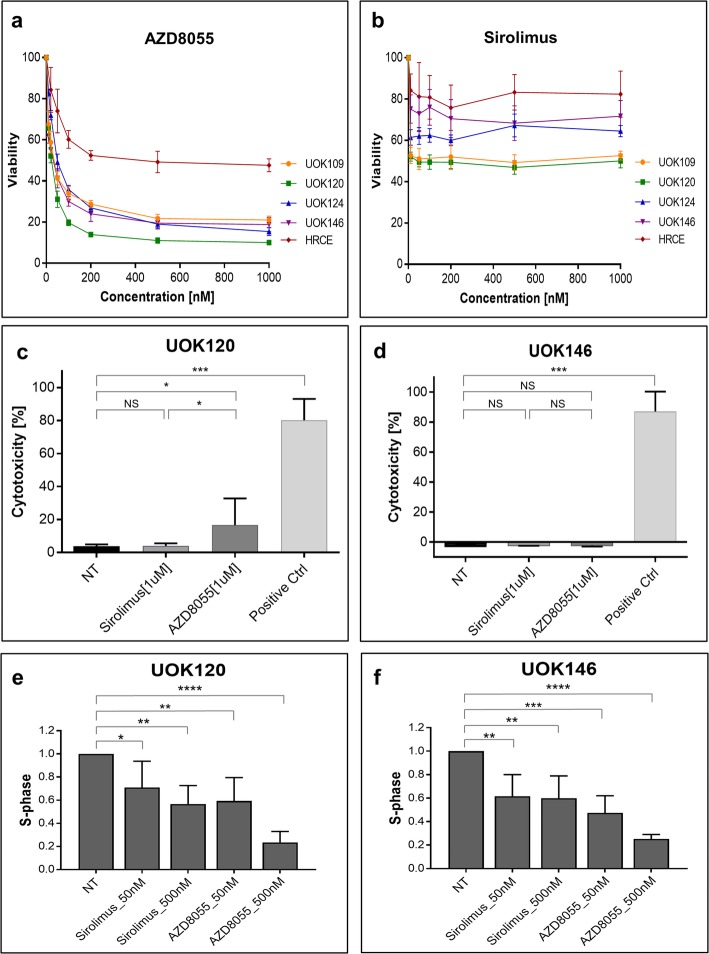
Results: The Akt/mTOR pathway was activated to a similar or greater degree in TfRCC than ccRCC cell lines and persisted partly during growth factor starvation, suggesting constitutive activation. Dual mTORC1/2 inhibition with AZD8055 potently inhibited TfRCC viability (IC50 = 20-50 nM) due at least in part to cell cycle arrest, while benign renal epithelial cells were relatively resistant (IC50 = 400 nM). Maximal viability reduction was greater with AZD8055 than sirolimus (80-90% versus 30-50%), as was the extent of Akt/mTOR pathway inhibition, based on significantly greater suppression of P-Akt (Ser473), P-4EBP1, P-mTOR and HIF1α. In mouse xenograft models, AZD8055 achieved significantly better tumor growth inhibition and prolonged mouse survival compared to sirolimus or vehicle controls.

Conclusions: Akt/mTOR activation is common in TfRCC and a promising therapeutic target. Dual mTORC1/2 inhibition suppresses Akt/mTOR signaling more effectively than selective mTORC1 inhibition and demonstrates in vivo preclinical efficacy against TFE3-fusion renal cell carcinoma.

Keywords: AZD8055; Fusion gene; MITF; TFE3; Translocation renal cell carcinoma; mTOR inhibitor.


Conflict of interest statement

The authors declare that they have no competing interests.

Figures

Fig. 1
Fig. 1
Akt/mTOR pathway member protein expression and activation in TfRCC and ccRCC cell lines. a Akt/mTOR pathway member protein expression was determined by Western blot for TfRCC cell lines relative to ccRCC cell lines after 48 h of culture in standard serum-supplemented media. Akt/mTOR pathway activation levels in TfRCC cell lines are comparable to levels in ccRCC cell lines, as shown by similar protein phosphorylation levels of mTOR, Akt, GSK3β, S6 Ribosomal Protein, and 4EBP1. HIF1α expression, a hallmark of ccRCC due to VHL functional loss, is less pronounced in TfRCC than ccRCC cell lines. b Akt/mTOR pathway member protein expression was determined by Western blot after serum starvation versus serum stimulation of TfRCC cell lines. Cells were cultured for 18 h in media without serum supplementation followed by culture for 6 h in the presence (+) or absence (−) of 10% serum supplementation. In the absence of serum stimulation, some levels of phosphorylation are preserved in mTOR, Akt, its kinase target protein GSK3β, S6, and 4EBP1, indicating some constitutive activation of mTORC1, mTORC2 and Akt
Fig. 2
Fig. 2
Cell viability, cytotoxicity and cell cycle progression in TfRCC cell lines treated with mTOR inhibitors. a, b Cell viability, as measured by MTT assay for TfRCC cell lines and the benign renal epithelial cell line HRCE after 72 h of treatment with up to 1000 nM concentrations of the dual mTORC1/2 inhibitor, AZD8055 (a), or selective mTORC1 inhibitor, sirolimus (b). Viability in TfRCC cells was suppressed by approximately 80–90% with AZD8055 and 30–50% with sirolimus relative to the untreated (0 nM drug) condition. Both drugs inhibited growth to a greater degree in TfRCC cells than in benign renal cells. c, d Cell cytotoxicity, as measured by LDH release by UOK120 and UOK146 TfRCC cell lines after 48 h of treatment with 1 μM of AZD8055 (c) or sirolimus (d). Only slight cytotoxicity in UOK120 cells and no cytotoxicity in UOK146 cells was observed after AZD8055 treatment, while sirolimus treatment had no cytotoxic effect. Multi protein inhibitor LY294002 [100 μM] was used as a positive control. e, f Relative fraction of cells in S-phase of the cell cycle, as measured by BrdU incorporation in UOK120 (e) and UOK146 (f) cell lines treated for 24 h with low (50 nM) and high (500 nM) concentrations of AZD8055 or sirolimus. Dose-dependent reductions in S-phase in both cell lines with either drug mirror the magnitude of reductions observed in cell viability (a, b), supporting a predominantly cytostatic mechanism of growth inhibition for both drugs. *p < 0.05; **p < 0.01; ***p < 0.001; NS = non-significant
Fig. 3
Fig. 3
Differential Akt/mTOR pathway suppression in TfRCC cells treated with dual mTORC1/mTORC2 versus selective mTORC1 inhibition. A representative Western blot shows time- and dose-dependent effects of dual mTORC1/2 inhibition with AZD8055 versus selective mTORC1 inhibition with sirolimus in a TfRCC cell line (UOK146). Cells were cultured with 0–500 nM of either drug for 0, 1 and 6 h. Dose- and time-dependent reductions by AZD8055 treatment in levels of phosphorylated S6 or 4EBP1 and Akt (Ser473) confirmed target inhibition of mTORC1 and mTORC2, respectively, with complete suppression of each achieved with 500 nM by 6 h. Similar dose- and time-dependent suppression was observed for other Akt/mTORC pathway members, including phosphorylated GSK3β, phosphorylated mTOR and HIF1α. In contrast, sirolimus achieved complete suppression of phosphorylated S6 by 6 h, but caused time- and dose-dependent increases in other Akt/mTOR pathway members consistent with feedback activation
Fig. 4
Fig. 4
TfRCC tumor growth and mouse survival after treatment with dual mTORC1/mTORC2 versus selective mTORC1 inhibition. Nude mice bearing UOK120 or UOK146 tumor xenografts were treated with oral (PO) AZD8055, PO vehicle control, intraperitoneal (IP) sirolimus or IP vehicle control for a 3-week period. a, b Tumor growth curves showing average tumor volume over time for each treatment condition in UOK120 (a) and UOK146 (b) xenograft-bearing mice. AZD8055 significantly reduced tumor size compared to PO control (UOK120: p < 0.0001; UOK146: p < 0.0001) or sirolimus (UOK120: p = 0.004; UOK146: p = 0.0003). Growth curves are truncated at the time of the first mouse death for that condition. c, d Survival curves for xenograft-bearing mice. Sirolimus treatment showed no significant benefit on mouse survival compared to vehicle treated controls, while AZD8055 treatment extended survival compared to the PO control and sirolimus treatments in mice harboring UOK120 (c) or UOK146 (d) xenografts. Log-rank p-values: p = 0.021 for AZD8055 vs. PO control (UOK120); p = 0.076 for AZD8055 vs. sirolimus (UOK120); p = 0.815 for sirolimus vs. IP control (UOK120); p < 0.0001 for AZD8055 vs. PO control (UOK146); p < 0.0001 for AZD8055 vs. sirolimus (UOK146); p = 0.729 for sirolimus vs. IP control (UOK146)
Fig. 5
Fig. 5
Dual mTORC1/2 inhibitor and selective mTORC1 inhibitor treatments achieve on-target effects in TfRCC xenograft models. Western Blot of UOK120 and UOK146 xenograft tumors 6 h after treatment with a selective mTORC1 inhibitor (sirolimus), a dual mTORC1/2 inhibitor (AZD8055) or respective vehicle controls. Reduction in phosphorylation levels of S6 with sirolimus compared to vehicle control (IPC) confirmed on-target inhibition of mTORC1. Reduction in phosphorylation levels of S6(Ser240/244) and Akt (Thr473) by AZD8055 treatment compared to vehicle control (POC) confirmed on-target inhibition of mTORC1 and mTORC2, respectively. Levels of phosphorylated mTOR were suppressed with AZD8055 but not sirolimus compared to respective controls

References

    1. Linehan WM, Bratslavsky G, Pinto PA, Schmidt LS, Neckers L, Bottaro DP, Srinivasan R. Molecular diagnosis and therapy of kidney cancer. Annu Rev Med. 2010;61:329–343. doi: 10.1146/annurev.med.042808.171650. - DOI - PMC - PubMed
    1. Komai Y, Fujiwara M, Fujii Y, Mukai H, Yonese J, Kawakami S, Yamamoto S, Migita T, Ishikawa Y, Kurata M, et al. Adult Xp11 translocation renal cell carcinoma diagnosed by cytogenetics and immunohistochemistry. Clin Cancer Res. 2009;15(4):1170–1176. doi: 10.1158/1078-0432.CCR-08-1183. - DOI - PubMed
    1. Zhong M, De Angelo P, Osborne L, Paniz-Mondolfi AE, Geller M, Yang Y, Linehan WM, Merino MJ, Cordon-Cardo C, Cai D. Translocation renal cell carcinomas in adults: a single-institution experience. Am J Surg Pathol. 2012;36(5):654–662. doi: 10.1097/PAS.0b013e31824f24a6. - DOI - PMC - PubMed
    1. Cancer Genome Atlas Research N Comprehensive molecular characterization of clear cell renal cell carcinoma. Nature. 2013;499(7456):43–49. doi: 10.1038/nature12222. - DOI - PMC - PubMed
    1. Cancer Genome Atlas Research N. Linehan WM, Spellman PT, Ricketts CJ, Creighton CJ, Fei SS, Davis C, Wheeler DA, Murray BA, Schmidt L, et al. Comprehensive Molecular Characterization of Papillary Renal-Cell Carcinoma. N Engl J Med. 2016;374(2):135–145. doi: 10.1056/NEJMoa1505917. - DOI - PMC - PubMed

MeSH terms

Substances

LinkOut - more resources