

Specific gut microbiome members are associated with distinct immune markers in pediatric allogeneic hematopoietic stem cell transplantation
- PMID: 31519210
- PMCID: PMC6744702
- DOI: 10.1186/s40168-019-0745-z
Specific gut microbiome members are associated with distinct immune markers in pediatric allogeneic hematopoietic stem cell transplantation
Abstract
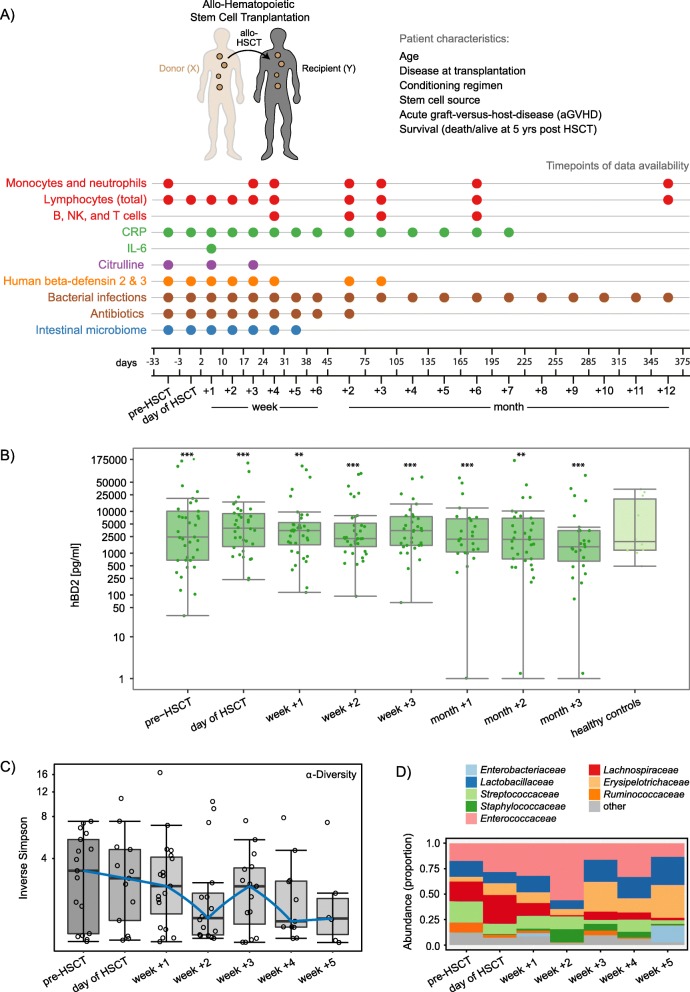
Background: Increasing evidence reveals the importance of the microbiome in health and disease and inseparable host-microbial dependencies. Host-microbe interactions are highly relevant in patients receiving allogeneic hematopoietic stem cell transplantation (HSCT), i.e., a replacement of the cellular components of the patients' immune system with that of a foreign donor. HSCT is employed as curative immunotherapy for a number of non-malignant and malignant hematologic conditions, including cancers such as acute lymphoblastic leukemia. The procedure can be accompanied by severe side effects such as infections, acute graft-versus-host disease (aGvHD), and death. Here, we performed a longitudinal analysis of immunological markers, immune reconstitution and gut microbiota composition in relation to clinical outcomes in children undergoing HSCT. Such an analysis could reveal biomarkers, e.g., at the time point prior to HSCT, that in the future could be used to predict which patients are of high risk in relation to side effects and clinical outcomes and guide treatment strategies accordingly.
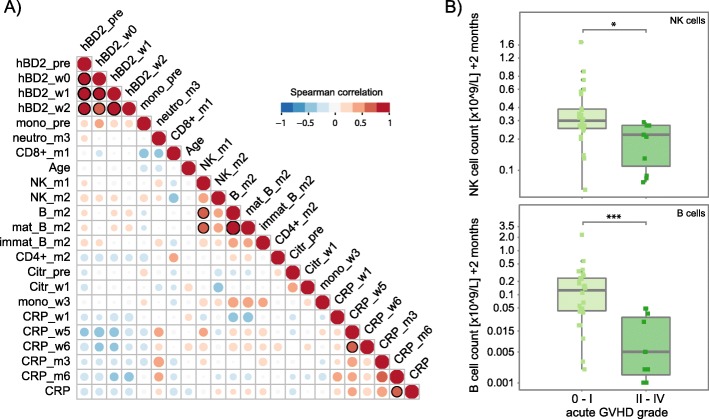
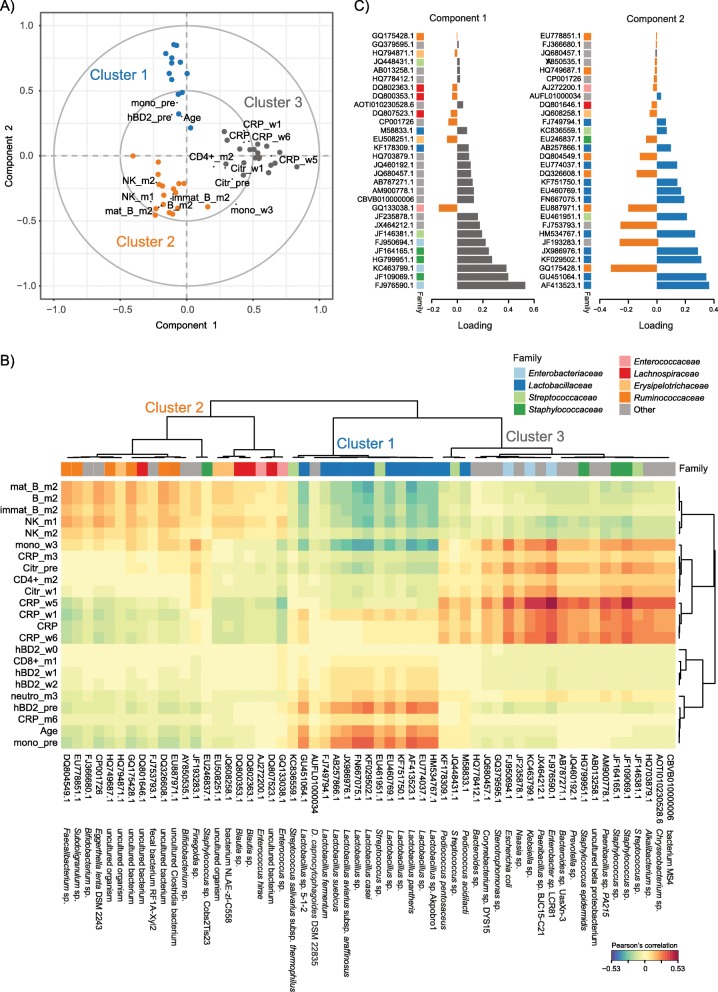
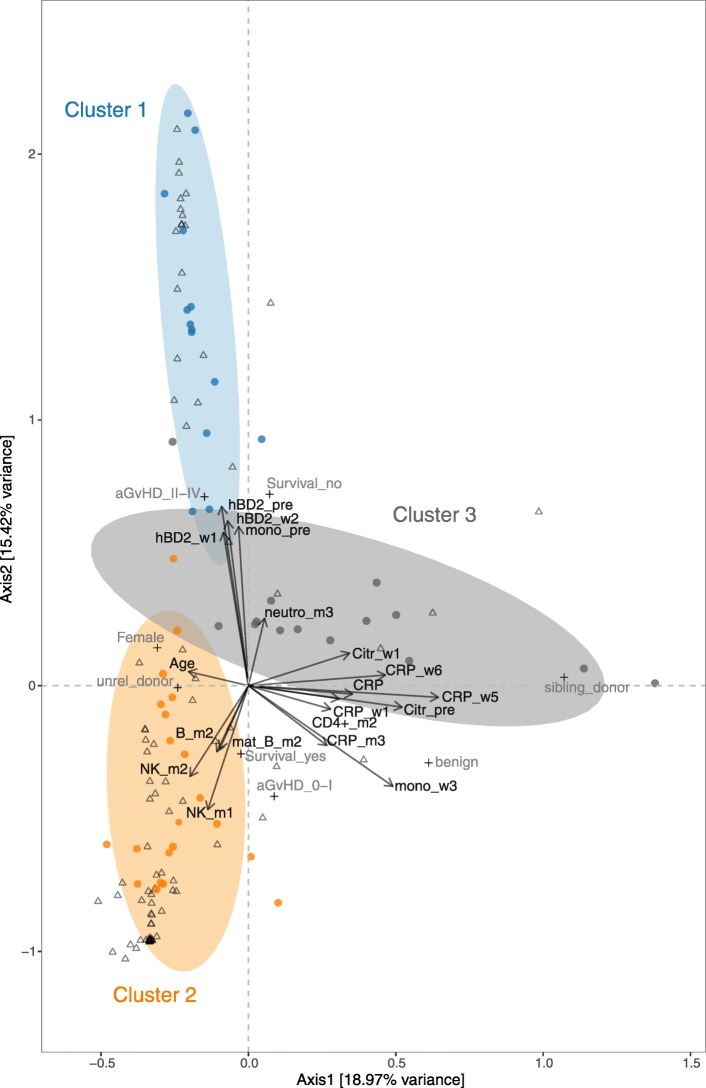
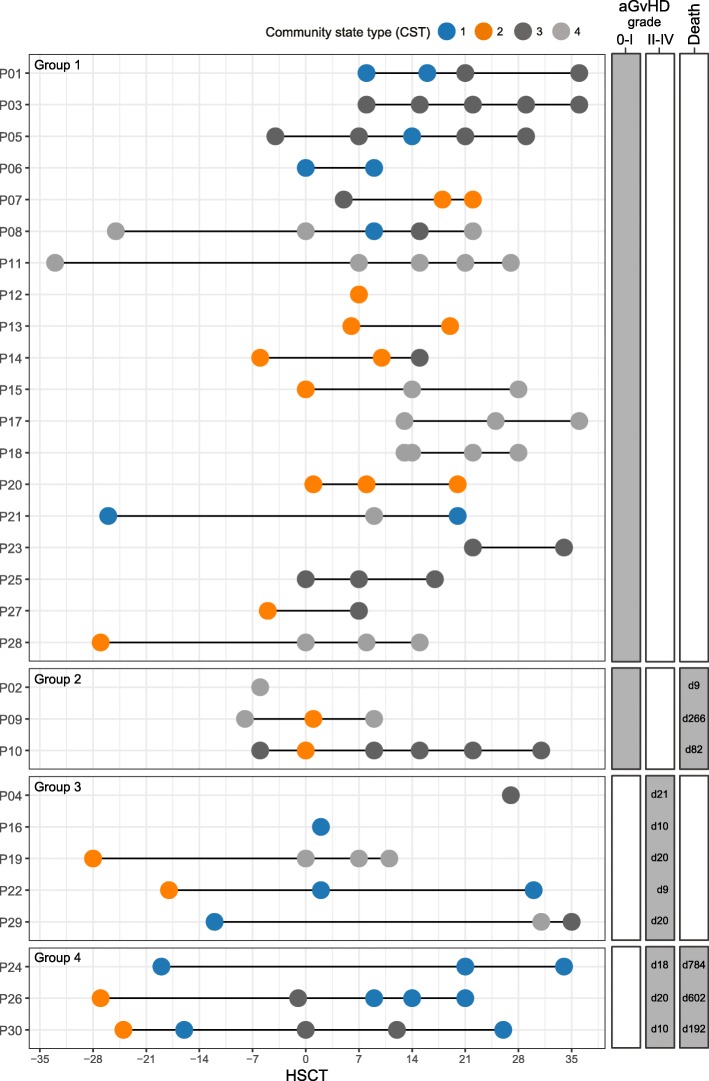
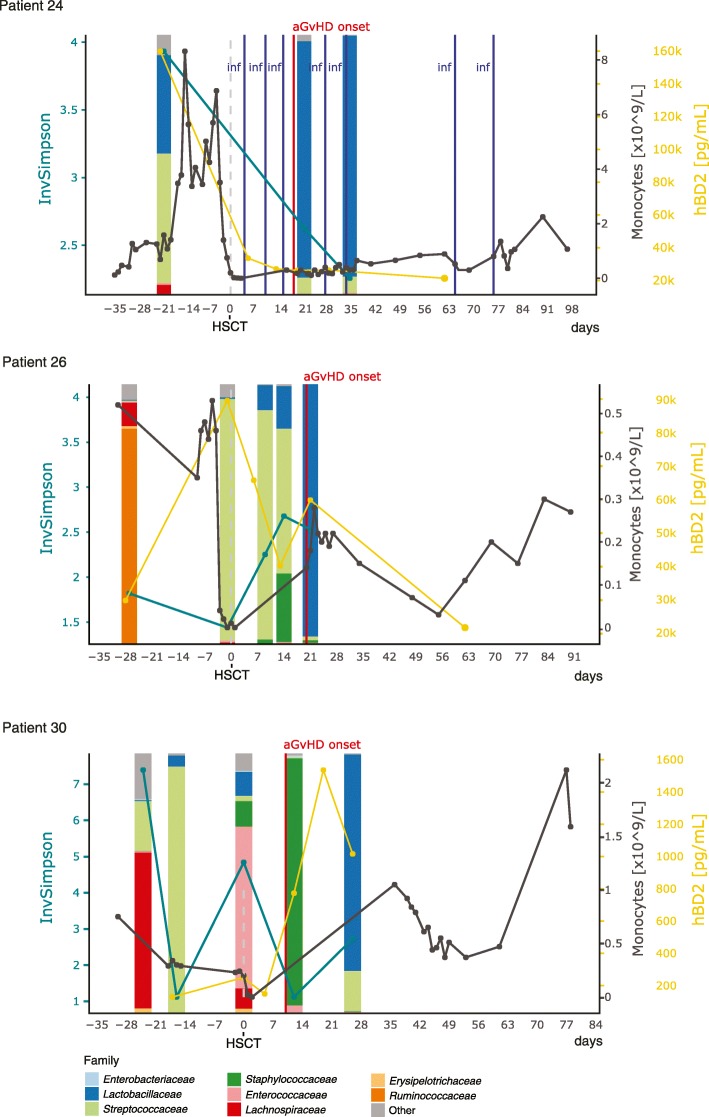
Results: In two multivariate analyses (sparse partial least squares regression and canonical correspondence analysis), we identified three consistent clusters: (1) high concentrations of the antimicrobial peptide human beta-defensin 2 (hBD2) prior to the transplantation in patients with high abundances of Lactobacillaceae, who later developed moderate or severe aGvHD and exhibited high mortality. (2) Rapid reconstitution of NK and B cells in patients with high abundances of obligate anaerobes such as Ruminococcaceae, who developed no or mild aGvHD and exhibited low mortality. (3) High inflammation, indicated by high levels of C-reactive protein, in patients with high abundances of facultative anaerobic bacteria such as Enterobacteriaceae. Furthermore, we observed that antibiotic treatment influenced the bacterial community state.
Conclusions: We identify multivariate associations between specific microbial taxa, host immune markers, immune cell reconstitution, and clinical outcomes in relation to HSCT. Our findings encourage further investigations into establishing longitudinal surveillance of the intestinal microbiome and relevant immune markers, such as hBD2, in HSCT patients. Profiling of the microbiome may prove useful as a prognostic tool that could help identify patients at risk of poor immune reconstitution and adverse outcomes, such as aGvHD and death, upon HSCT, providing actionable information in guiding precision medicine.
Keywords: 16S rRNA gene profiling; B cells and NK cells; Data integration; Gut microbiota; HSCT; Human beta-defensin 2; Immune reconstitution; Pediatric cancer; Ruminococcaceae; acute GvHD.
Conflict of interest statement
The authors declare that they have no competing interests.
Figures
Similar articles
-
Microbiota long-term dynamics and prediction of acute graft-versus-host disease in pediatric allogeneic stem cell transplantation.Microbiome. 2021 Jun 28;9(1):148. doi: 10.1186/s40168-021-01100-2. Microbiome. 2021. PMID: 34183060 Free PMC article.
-
Intestinal Microbiota at Engraftment Influence Acute Graft-Versus-Host Disease via the Treg/Th17 Balance in Allo-HSCT Recipients.Front Immunol. 2018 Apr 24;9:669. doi: 10.3389/fimmu.2018.00669. eCollection 2018. Front Immunol. 2018. PMID: 29740427 Free PMC article.
-
Early gut microbiota signature of aGvHD in children given allogeneic hematopoietic cell transplantation for hematological disorders.BMC Med Genomics. 2019 Mar 7;12(1):49. doi: 10.1186/s12920-019-0494-7. BMC Med Genomics. 2019. PMID: 30845942 Free PMC article.
-
Allogenic stem cell transplant-associated acute graft versus host disease: a computational drug discovery text mining approach using oral and gut microbiome signatures.Support Care Cancer. 2021 Apr;29(4):1765-1779. doi: 10.1007/s00520-020-05821-2. Epub 2020 Oct 22. Support Care Cancer. 2021. PMID: 33094358 Review.
-
Microbiome: An Emerging New Frontier in Graft-Versus-Host Disease.Dig Dis Sci. 2019 Mar;64(3):669-677. doi: 10.1007/s10620-018-5369-9. Epub 2018 Dec 7. Dig Dis Sci. 2019. PMID: 30523482 Review.
Cited by
-
Ecological insights into hematopoiesis regulation: unraveling the influence of gut microbiota.Gut Microbes. 2024 Jan-Dec;16(1):2350784. doi: 10.1080/19490976.2024.2350784. Epub 2024 May 10. Gut Microbes. 2024. PMID: 38727219 Free PMC article. Review.
-
Advancing therapeutic strategies for graft-versus-host disease by targeting gut microbiome dynamics in allogeneic hematopoietic stem cell transplantation: current evidence and future directions.Mol Med. 2025 Jan 3;31(1):2. doi: 10.1186/s10020-024-01060-x. Mol Med. 2025. PMID: 39754054 Free PMC article. Review.
-
The causal relationship between circulating inflammatory proteins, gut microbiotas, immune cells and leukemia: a bidirectional Mendelian randomization study.Discov Oncol. 2025 Jun 19;16(1):1157. doi: 10.1007/s12672-025-02863-y. Discov Oncol. 2025. PMID: 40537729 Free PMC article.
-
Gut microbiota in acute leukemia: Current evidence and future directions.Front Microbiol. 2022 Dec 1;13:1045497. doi: 10.3389/fmicb.2022.1045497. eCollection 2022. Front Microbiol. 2022. PMID: 36532458 Free PMC article. Review.
-
Early stool microbiome and metabolome signatures in pediatric patients undergoing allogeneic hematopoietic cell transplantation.Pediatr Blood Cancer. 2022 Jan;69(1):e29384. doi: 10.1002/pbc.29384. Epub 2021 Oct 28. Pediatr Blood Cancer. 2022. PMID: 34709713 Free PMC article.
References
-
- Liu C, Frank D N, Horch M, Chau S, Ir D, Horch E A, Tretina K, van Besien K, Lozupone C A, Nguyen V H. Associations between acute gastrointestinal GvHD and the baseline gut microbiota of allogeneic hematopoietic stem cell transplant recipients and donors. Bone Marrow Transplantation. 2017;52(12):1643–1650. doi: 10.1038/bmt.2017.200. - DOI - PubMed
Publication types
MeSH terms
Substances
LinkOut - more resources
Full Text Sources
Research Materials
