

Corneal Biomechanics and Visual Field Progression in Eyes with Seemingly Well-Controlled Intraocular Pressure
- PMID: 31519385
- PMCID: PMC6884091
- DOI: 10.1016/j.ophtha.2019.07.023
Corneal Biomechanics and Visual Field Progression in Eyes with Seemingly Well-Controlled Intraocular Pressure
Abstract
Purpose: To investigate the incidence and risk factors for glaucomatous visual field progression in eyes with well-controlled intraocular pressure (IOP).
Design: Prospective cohort.
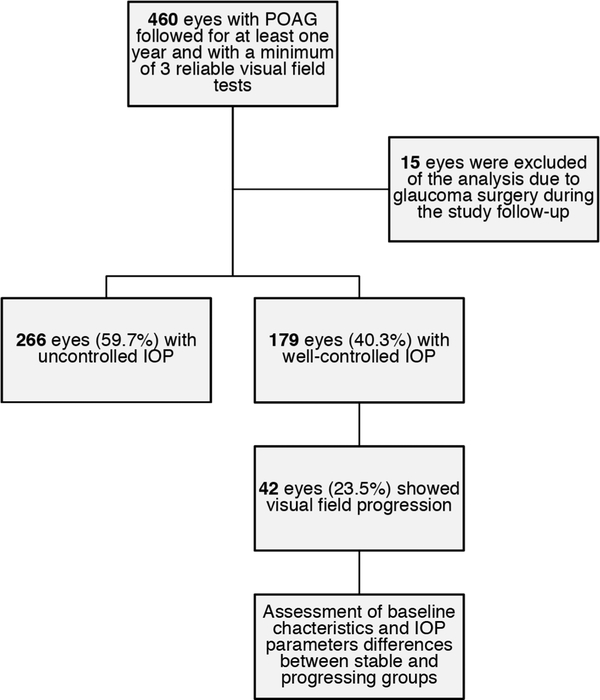
Participants: A total of 460 eyes of 334 patients with glaucoma under treatment.
Methods: Study subjects had a mean follow-up of 4.3±0.8 years. Patients were classified as well controlled if all IOP measurements were less than 18 mmHg. Rates of visual field progression were calculated using ordinary least-squares linear regression of standard automated perimetry (SAP) mean deviation (MD) values over time. Progression was defined as a significantly negative MD slope (alpha = 0.05).
Main outcome measures: Rates of SAP MD change; mean and peak IOP, and IOP fluctuation; and corneal biomechanics: corneal hysteresis (CH), central corneal thickness (CCT), and corneal index.
Results: Of the 179 eyes with well-controlled IOP, 42 (23.5%) demonstrated visual field progression. There was no significant difference between progressing and stable patients in baseline MD (-6.4±7.1 decibels [dB] vs. -6.0±6.2 dB; P = 0.346), mean IOP (11.7±2.0 mmHg vs. 12.1±2.3 mmHg; P = 0.405), IOP fluctuation (1.6±0.6 mmHg vs. 1.6±0.5 mmHg; P = 0.402), or peak IOP (14.3±1.9 mmHg vs. 14.6±2.1 mmHg; P = 0.926). Progressing eyes had significantly lower CH (8.6±1.3 mmHg vs. 9.4±1.6 mmHg; P = 0.014) and thinner CCT (515.1±33.1 μm vs. 531.1±42.4 μm; P = 0.018, respectively) compared with stable eyes. In the multivariate analysis, a 1 standard deviation lower corneal index, a summation of normalized versions of CH and CCT, resulted in a 68% higher risk of progression (odds ratio, 1.68; 95% confidence interval, 1.08-2.62; P = 0.021).
Conclusions: Approximately one-quarter of eyes with well-controlled IOP may show visual field progression over time. Thin cornea and low CH are main risk factors.
Copyright © 2019 American Academy of Ophthalmology. Published by Elsevier Inc. All rights reserved.
Conflict of interest statement
Conflict of Interest:
Bianca N. Susanna: none; Carolina N. Susanna: none; Nara G. Ogata: none; Alessandro A. Jammal: none; Samuel I. Berchuck: none; Felipe A. Medeiros: Alcon Laboratories (C, L, S), Allergan (C, L), Bausch&Lomb (F), Carl Zeiss Meditec (C, L, S), Heidelberg Engineering (L), Merck (L), nGoggle Inc. (P), Sensimed (C), Topcon (C), Reichert (C, S), National Institutes of Health/National Eye Institute (S).
Figures
References
-
- Leske MC, Heijl A, Hyman L, et al. Predictors of long-term progression in the early manifest glaucoma trial. Ophthalmology 2007;114(11):1965–72. - PubMed
-
- Comparison of glaucomatous progression between untreated patients with normal-tension glaucoma and patients with therapeutically reduced intraocular pressures. Collaborative Normal-Tension Glaucoma Study Group. Am J Ophthalmol 1998;126(4):487–97. - PubMed
-
- De Moraes CG, Juthani VJ, Liebmann JM, et al. Risk factors for visual field progression in treated glaucoma. Arch Ophthalmol 2011;129(5):562–8. - PubMed
-
- Gordon MO, Beiser JA, Brandt JD, et al. The Ocular Hypertension Treatment Study: baseline factors that predict the onset of primary open-angle glaucoma. Arch Ophthalmol 2002;120(6):714–20; discussion 829–30. - PubMed
Publication types
MeSH terms
Grants and funding
LinkOut - more resources
Full Text Sources
Medical
Miscellaneous
