. 2019 Sep 17;51(3):535-547.e9.
doi: 10.1016/j.immuni.2019.08.006. Epub 2019 Sep 10.

Unique and Shared Epigenetic Programs of the CREBBP and EP300 Acetyltransferases in Germinal Center B Cells Reveal Targetable Dependencies in Lymphoma

Affiliations

Unique and Shared Epigenetic Programs of the CREBBP and EP300 Acetyltransferases in Germinal Center B Cells Reveal Targetable Dependencies in Lymphoma

Stefanie N Meyer et al. Immunity. .

Abstract

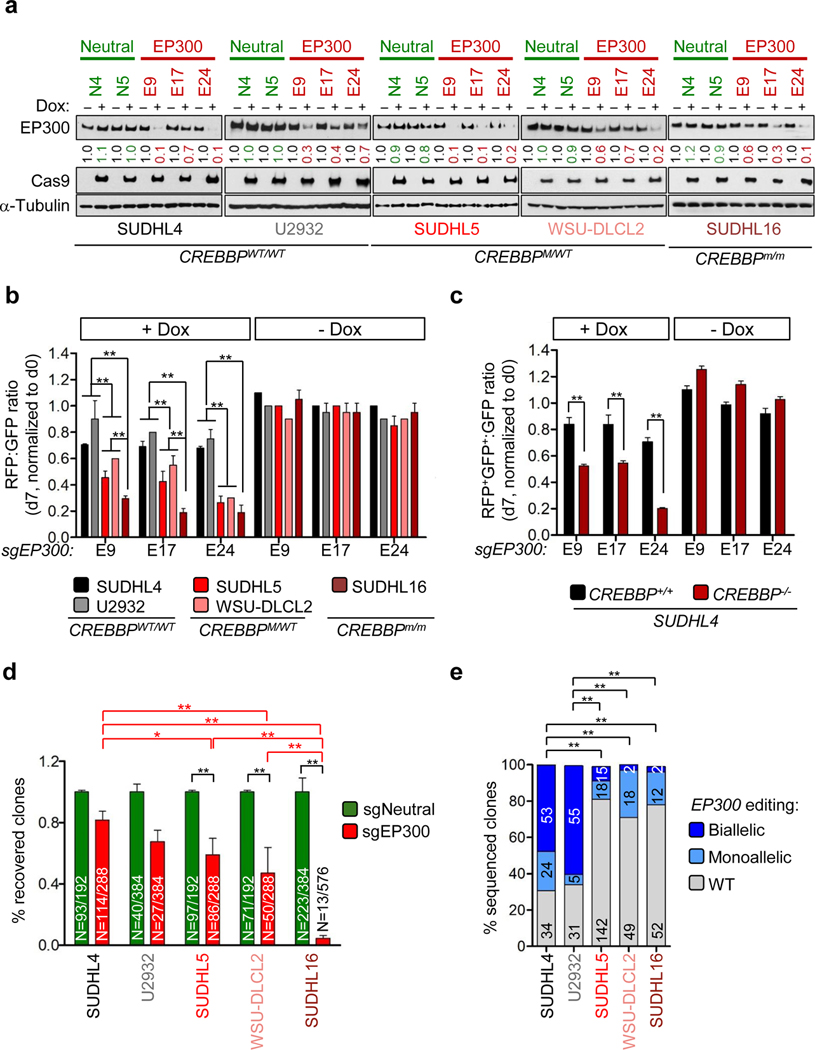
Inactivating mutations of the CREBBP and EP300 acetyltransferases are among the most common genetic alterations in diffuse large B cell lymphoma (DLBCL) and follicular lymphoma (FL). Here, we examined the relationship between these two enzymes in germinal center (GC) B cells, the normal counterpart of FL and DLBCL, and in lymphomagenesis by using conditional GC-directed deletion mouse models targeting Crebbp or Ep300. We found that CREBBP and EP300 modulate common as well as distinct transcriptional programs implicated in separate anatomic and functional GC compartments. Consistently, deletion of Ep300 but not Crebbp impaired the fitness of GC B cells in vivo. Combined loss of Crebbp and Ep300 completely abrogated GC formation, suggesting that these proteins partially compensate for each other through common transcriptional targets. This synthetic lethal interaction was retained in CREBBP-mutant DLBCL cells and could be pharmacologically targeted with selective small molecule inhibitors of CREBBP and EP300 function. These data provide proof-of-principle for the clinical development of EP300-specific inhibitors in FL and DLBCL.

Keywords: CREBBP; EP300; acetyltransferase inhibitor; dark zone; diffuse large cell lymphoma; germinal center; light zone; synthetic lethality.


Figures

Figure 1.
Figure 1.. Crebbp and Ep300 Play Non-overlapping Roles in GC B Cells
(A) Representative flow-cytometric analysis of splenic B220+ cells from Crebbp+/+, Crebbpfl/+, and Crebbpfl/fl (top) vs Ep300+/+, Ep300fl/+, and Ep300fl/fl (bottom) Cγ1Cre/+ mice, analyzed 10 days after SRBC immunization. GC B cells are identified as CD95+PNAhi cells, and numbers in each image indicate the percentage in the gate. (B) Percentage of GC B cells in mice from the indicated genotypes, analyzed at 3 months of age, 10 days after SRBC immunization (n = 5–8 mice per genotype). (C) Immunofluorescence staining of Crebbp (red) and Ep300 (purple) in representative spleen sections from SRBC-immunized Crebbpfl/flCγ1Cre/+ and Ep300fl/flCγ1Cre/+ mice. PNA (green) identifies the GC area (outlined). The total number of Crebbp or Ep300-null GCs, out of the total number of PNA+ GCs, is given on the right for the two mouse models (n = 3 animals per genotype). Scale bar, 30 μm. (D) Immunohistochemical analysis of BCL6 in representative spleen sections from Ep300+/+, Ep300fl/+, and Ep300fl/fl Cγ1Cre/+ mice, analyzed 10 days after SRBC immunization. Scale bar, 500 μm. (E) Mean GC number, GC size, and overall GC area (per spleen section) in mice of the indicated genotypes, measured in pixels using the ImageJ software on 3 sections per mouse (mean ± SD; n = 3–4 mice per genotype). *p <0.05, **p <0.01; Student’s t-test. Only statistically significant p values are indicated.
Figure 2.
Figure 2.. Crebbp and Ep300 Modulate Distinct Functional Programs Implicated in DZ to LZ Transition
(A) Differentially expressed genes in Crebbpfl/fl and Ep300fl/flCγ1Cre/+ GC B cells, compared with WT (left and middle panel) or to each other (right). In the heatmaps, rows correspond to genes and columns correspond to different mice; the third category is shown as reference (blue, reduced expression; red, increased expression; FDR < 0.05, FC ≥ 1.2). Scale bar indicates the Z score. Representative transcripts are indicated, and the complete list is provided in Table S1. Only annotated genes are shown. (B) Venn diagrams of genes differentially expressed in Crebbpfl/fl and Ep300fl/flCγ1Cre/+ GCB cells, compared with WT (only annotated genes considered). See also Figure S2. (C) Top significantly enriched (p < 0.05 after correction for multiple hypothesis) biological pro-grams/signaling pathways identified among the list of genes showing reduced expression in Crebbp-deficient (left) and Ep300-deficient (right) GC B cells, compared with WT (see Method Details). The full list of differentially enriched categories is provided in Table S2. (D) GSEA analysis of LZ-associated and DZ-associated genes along the T score rank of transcripts expressed in Crebbp+/+Ep300+/+ vs Crebbpfl/flCγ1Cre/+ (left) and Crebbp+/+Ep300+/+ vs Ep300fl/flCγ1Cre/+ (right) GC B cells. The reverse analysis showed no significant enrichment, indicating preferential modulation of LZ genes by Crebbp and of DZ genes by Ep300 (see Table S3).
Figure 3.
Figure 3.. Crebbp-Deficient GC B Cells Are Dependent on the Residual Ep300 Protein
(A) Representative flow-cytometric analysis of splenic B220+ cells from Crebbp+/+Ep300+/+, Crebbpfl/+Ep300fl/+, Crebbpfl/+Ep300fl/fl, Crebbpfl/flEp300fl/+, and Crebbpfl/flEp300fl/fl Cγ1Cre/+ mice, analyzed 10 days after SRBC immunization. GC B cells are identified as CD95+PNAhi cells, and numbers in each image indicate the percentage in the gate. (B) Normalized percentage of splenic GC B cells in SRBC-immunized mice from the indicated genotypes, in relation to WT littermates (arbitrarily set as 1). Data correspond to 4 experiments, each performed with subsets of genotypes (vs WT) and 3 or 4 animals per genotype. (C) Immunohistochemical staining of BCL6 in representative spleen sections from animals of the indicated genotypes, analyzed 10 days after SRBC immunization. Scale bar, 500 μm (D) Mean GC number, GC size, and GC area (per spleen section) in the indicated mice, measured in pixels using the ImageJ software on 3 sections per mouse (Bars represent mean ± SD. The total number of animals analyzed is given inside the bars). Only statistically significant p values are indicated. *p < 0.05, **p < 0.01; Student’s t test.
Figure 4.
Figure 4.. Combined Loss of Crebbp and Ep300 Blocks Cell Proliferation
(A) WB analysis of Crebbp and Ep300 expression in Ficoll-separated splenic B cells of the indicated genotypes, cultured ex vivo in the presence of αCD40 and IL-4 for 4 days. Analysis of H3K27Ac and H3K18Ac monitors for the functional effects of Crebbp and/or Ep300 loss and is quantified on the bottom. Tubulin and total H3 serve as loading control for whole-cell and chromatin extracts, respectively. (B) Representative histogram plots showing the number of cell divisions in cultured B cells from the indicated genotypes, measured on day 4 after labeling with the CellTraceViolet reagent (live cells gate). (C) Quantification of the data shown in (B) (mean ± SD; n = 3 mice per genotype). (D) Cell growth in the same cells, measured by enzymatic activity and expressed as fold changes relative to day 0 (mean ± SD; n = 3 mice per genotype); (E and F) Analysis of cell viability, assessed on the basis of the percentage of dead cells in the forward scatter versus side scatter (FSC/SSC) (E) and the percentage of AnnexinV+ cells (F). Data are from one experiment where all genotypes were simultaneously analyzed and are representative of at least two independent experiments performed with subsets of genotypes (n = 3 each) that gave analogous results and were combined for statistical analyses. Note that the ex vivo assay is associated with an intrinsic elevated cell death. Bars represent mean ± SD. Only statistically significant p values are indicated. *p < 0.05, **p < 0.01; Student’s t test.
Figure 5.
Figure 5.. CREBBP Mutant DLBCL Cells Are Significantly Counter-Selectedupon EP300 Deletion
(A) Immunoblot analysis of EP300 and Cas9 expression in five DLBCL cell lines carrying wild-type (wt/wt) or mutant (M indicates truncating mutation; m indicates missense mutation or in frame deletion) CREBBP alleles, treated with Dox for 3 days to induce Cas9-mediated disruption of the EP300 gene or a control intronic region. Values indicate normalized EP300 protein levels in relation to uninduced, set as 1; α-Tubulin, loading control. (B) Relative fraction of RFP+ (sgEP300-transduced) to GFP+ (sgNeutral-transduced) cells in the same lines, measured on day 7 after Dox-induction (mean ± SD; n = 2 assays performed by using different sg-neutral transduced clones). Significance was calculated by using two-way ANOVA with Bonferroni post-test; 1 representative experiment out of 2 that gave similar results. Only statistically significant p values are indicated; **p < 0.01. (C) Relative fraction of RFP+GFP+ (sgEP300-transduced) to GFP+ (sgNeutral-transduced) cells in isogenic SUDHL4 clones engineered to carry WT (+/+) or disrupted (−/−) CREBBP alleles, measured on day 7 after Dox induction (mean ± SD; n = 3). **p < 0.01, two-way ANOVA with Bonferroni post-test. (D) Percentage of recovered clones in the indicated cell lines after Dox-induced deletion of EP300 (red) vs a control region (green) arbitrarily set as 1. Bars represent the average ± SD of independent transductions using 3 different EP300-sgRNAs and 2 neutral-sgRNAs, except for the U2932 cell line, where only 2 EP300-sgRNAs and 1 neutral-sgRNA gave informative results because of its general poor growth as single clones. The absolute number of clones recovered over the total plated is provided inside the bars. Only statistically significant p values are indicated; *p < 0.05, **p < 0.001; Fisher’s exact test. In U2932, no significant differences were found between the number of clones recovered in EP300- and neutral-sgRNAs; comparisons with other cell lines (red parentheses) are not reported because they were not informative given the distinct growth characteristics of this cell line. (E) Pattern of EP300 editing in the recovered clones, as determined by PCR amplification and Sanger sequencing. Color codes denote biallelically edited, monoallelically edited, and unedited (WT) clones. Data are expressed as percentage of total sequenced clones, and the absolute number is shown inside the bars. Note that the two biallelically edited SUDHL16 clones harbored in-frame deletions that did not disrupt EP300 protein expression. Only statistically significant p values are indicated. **p < 0.001; Fisher’s exact test.
Figure 6.
Figure 6.. CREBBP Mutant Cells Are Preferentially Vulnerable to CREBBP/EP300 Inhibition
(A) Cell proliferation of CREBBP+/+ and CREBBP−/− SUDHL4 clones grown in the presence of 100 nM CCS1477 or 50 nM CU329 over the course of 6 days (mean ± SD; n = 4); **p < 0.01; Student’s t-test. (B) Quantification of cell cycle analysis in the same cells, assessed after 72 h of treatment with CCS1477, CU329, or control DMSO (mean ± SD; n = 4); only statistically significant p values indicated. *p < 0.05; Student’s t-test. (C) Differentially expressed transcripts involved in cell cycle/DNA replication, as identified by DESeq2 in SUDHL4 cells treated with DMSO versus CCS1477 or CU329 for 48 h. In the heatmap, rows correspond to genes and columns represent 3 independent clones cultured in the presence or absence of the inhibitor as indicated (FDR ≤ 0.05%, FC ≥ 2 in at least one of the compounds and ≥ 1.2 in both compounds, except for MYC that showed a 1.5-fold reduction upon treatment with CU329 and 1.3-fold reduction upon treatment with CCS1477). Scale bar indicates the Z score, with blue representing decreased expression and red representing increased expression. Only representative transcripts are highlighted. (D) GSEA of cell cycle and DNA replication genes in the rank of transcripts differentially expressed between DMSO-treated and BRDi- or HATi-treated SUDHL4 cells. See also Table S4. (E) Western blot analysis of CREBBP and EP300 expression in isogenic SUDHL4 cell lines carrying intact (grey) or disrupted (red) CREBBP alleles and treated with DMSO, CCS1477, or CU329. Analysis of global H3K18 and H3K27 acetylation documents the stronger effect of the two inhibitors in CREBBP-deficient clones, as quantified at the bottom after normalization for total H3.

Comment in

References

    1. Akimaru H, Chen Y, Dai P, Hou DX, Nonaka M, Smolik SM, Armstrong S, Goodman RH, and Ishii S. (1997). Drosophila CBP is a co-activator of cubitus interruptus in hedgehog signalling. Nature 386, 735–738. - PubMed
    1. Arthur SE, Jiang A, Grande BM, Alcaide M, Cojocaru R, Rushton CK, Mottok A, Hilton LK, Lat PK, Zhao EY, et al. (2018). Genome-wide discovery of somatic regulatory variants in diffuse large B-cell lymphoma. Nat. Commun 9, 4001. - PMC - PubMed
    1. Avantaggiati ML, Ogryzko V, Gardner K, Giordano A, Levine AS, and Kelly K. (1997). Recruitment of p300/CBP in p53-dependent signal pathways. Cell 89, 1175–1184. - PubMed
    1. Bannister AJ, and Kouzarides T. (1996). The CBP co-activator is a histone acetyltransferase. Nature 384, 641–643. - PubMed
    1. Bedford DC, Kasper LH, Fukuyama T, and Brindle PK (2010). Target gene context influences the transcriptional requirement for the KAT3 family of CBP and p300 histone acetyltransferases. Epigenetics 5, 9–15. - PMC - PubMed

Publication types