. 2019 Oct 30;85(22):e01701-19.
doi: 10.1128/AEM.01701-19. Print 2019 Nov 15.

Ammonia Oxidizers in High-Elevation Rivers of the Qinghai-Tibet Plateau Display Distinctive Distribution Patterns

Affiliations

Ammonia Oxidizers in High-Elevation Rivers of the Qinghai-Tibet Plateau Display Distinctive Distribution Patterns

Sibo Zhang et al. Appl Environ Microbiol. .

Abstract

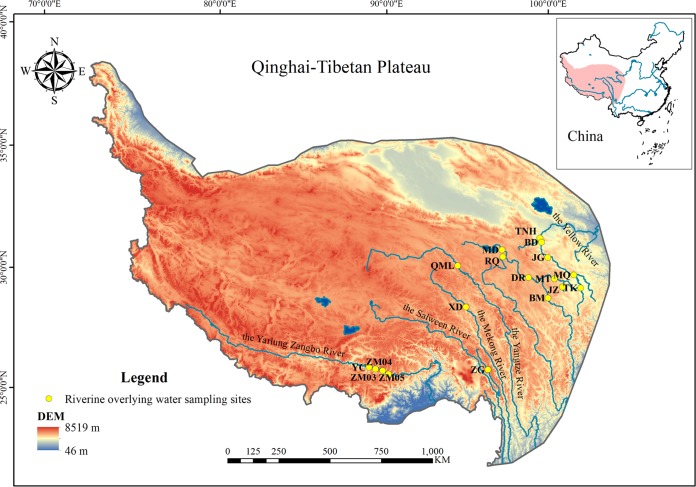
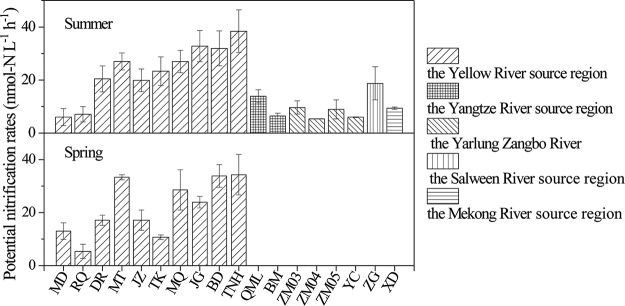
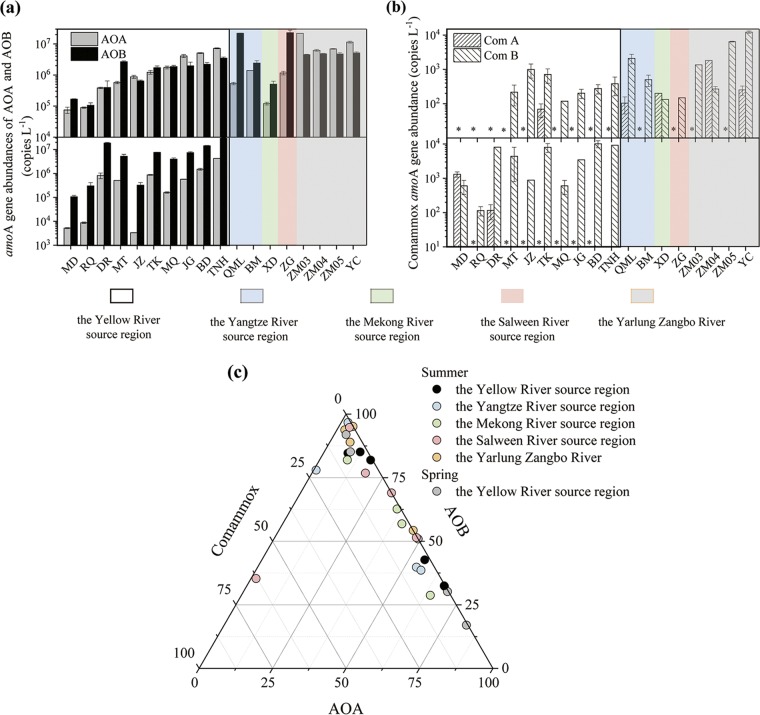
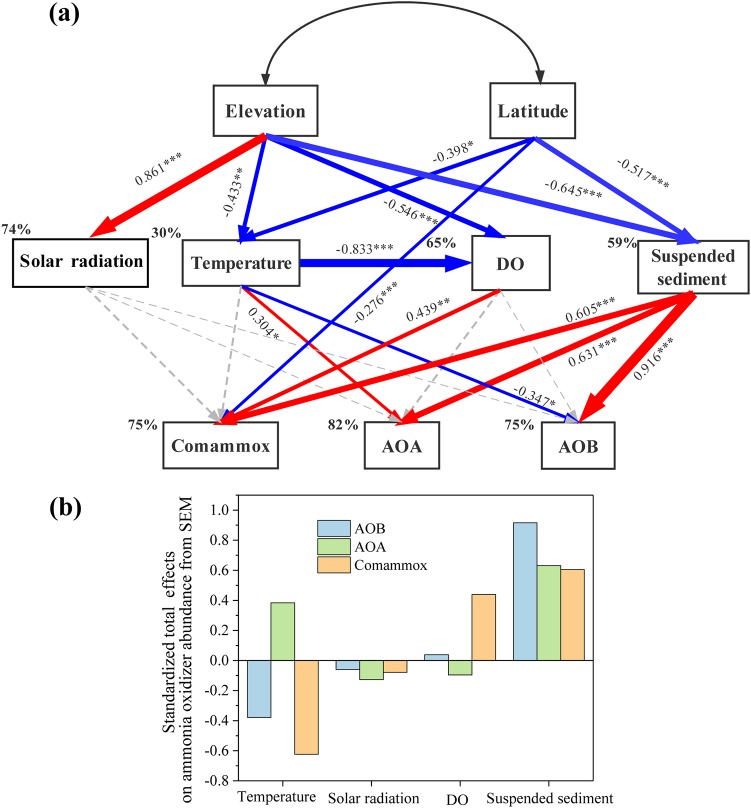
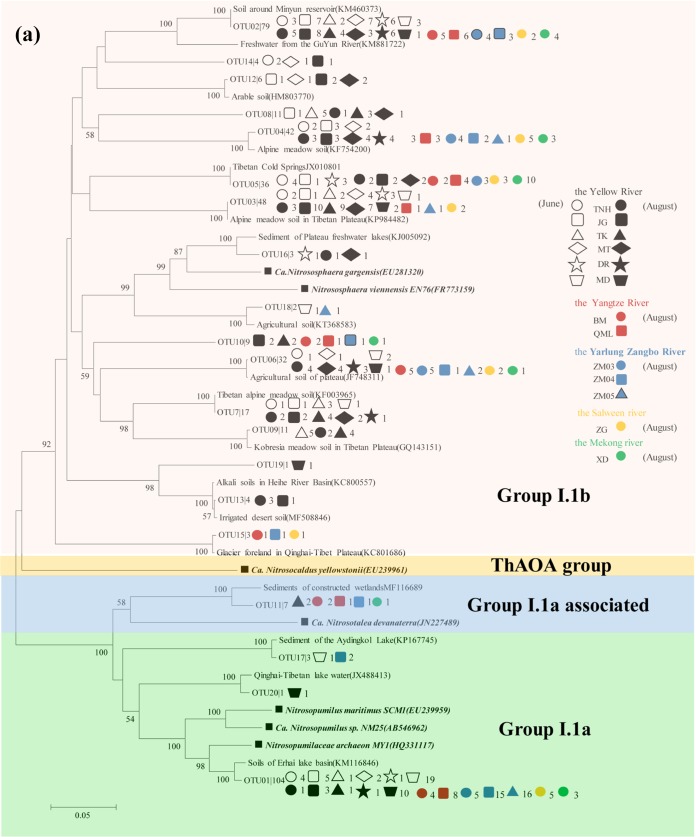
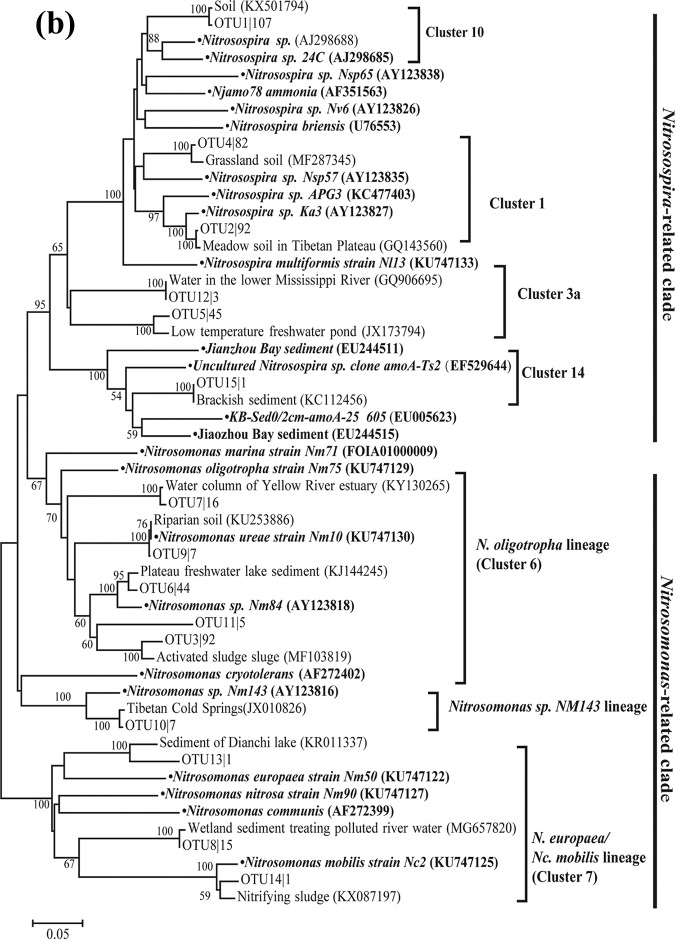
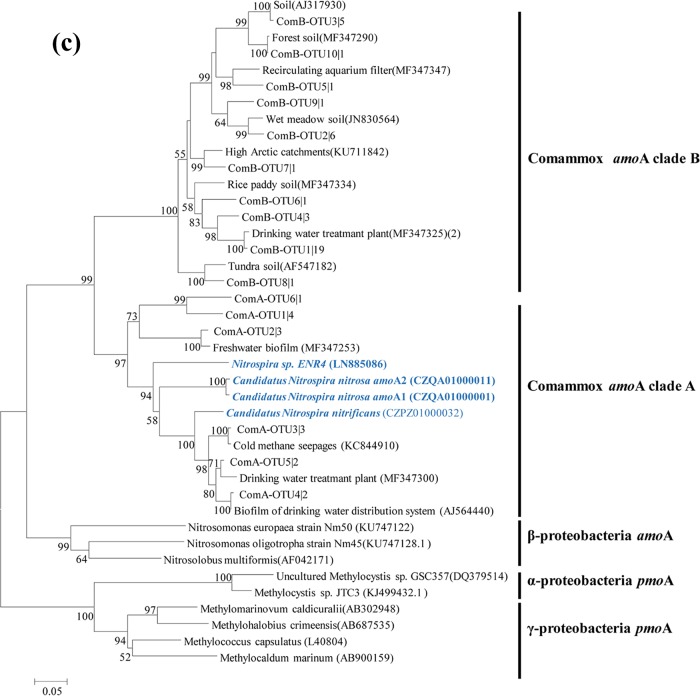
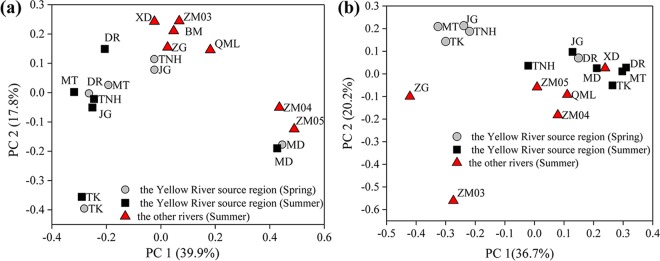
Ammonia-oxidizing bacteria (AOB) and archaea (AOA) as well as comammox catalyze ammonia oxidation. The distribution and biogeography of these ammonia oxidizers might be distinctive in high-elevation rivers, which are generally characterized by low temperature and low ammonium concentration but strong solar radiation; however, these characteristics have rarely been documented. This study explored the abundance, community, and activity of ammonia oxidizers in the overlying water of five rivers in the Qinghai-Tibet Plateau (QTP). Potential nitrification rates in these rivers ranged from 5.4 to 38.4 nmol N liter-1 h-1, and they were significantly correlated with ammonium concentration rather than temperature. Comammox were found in 25 of the total 28 samples, and they outnumbered AOA in three samples. Contrary to most studied low-elevation rivers, average AOB amoA gene abundance was significantly higher than that of AOA, and AOB/AOA ratios increased with decreasing water temperature. The Simpson index of the AOA community increased with elevation (P < 0.05), and AOA and AOB communities exhibited high dissimilarities with low-elevation rivers. Cold-adapted (Nitrosospira amoA cluster 1, 33.6%) and oligotrophic (Nitrosomonas amoA cluster 6a, 31.7%) groups accounted for large proportions in the AOB community. Suspended sediment concentration exerted significant effects on ammonia oxidizer abundance (r > 0.56), and owing to their elevational variations in source and concentration, suspended sediments facilitated distance-decay patterns for AOA and AOB community similarities. This study demonstrates distinctive biogeography and distribution patterns for ammonia oxidizers in high-elevation rivers of the QTP. Extensive research should be conducted to explore the role of these microbes in the nitrogen cycle of this zone.IMPORTANCE Ammonia-oxidizing archaea (AOA) and bacteria (AOB) as well as comammox contribute to ammonia oxidation, which plays significant roles in riverine nitrogen cycle and N2O production. Source regions of numerous rivers in the world lie in high-elevation zones, but the abundance, community, and activity of ammonia oxidizers in rivers in high-elevation regions have rarely been investigated. This study revealed distinctive distribution patterns and community structures for ammonia oxidizers in five high-elevation rivers of the Qinghai-Tibet Plateau, and the individual and combined effects of low temperature, low nutrients, and strong solar radiation on ammonia oxidizers were elucidated. The findings of this study are helpful to broaden our knowledge on the biogeography and distribution pattern of ammonia oxidizers in river systems. Moreover, this study provides some implications to predict the performance of ammonia oxidizers in high-elevation rivers and its variations under global climate warming.

Keywords: Qinghai-Tibet Plateau; ammonia-oxidizing archaea (AOA); comammox Nitrospira; distance-decay pattern; high-elevation rivers; suspended sediment.


Figures

FIG 1
FIG 1
Location of sampling sites (yellow circles) in the five high-elevation rivers of the Qinghai-Tibet Plateau. The five rivers consist of the Yellow River source region, the Yangtze River source region, the Mekong River source region, the Salween River source region, and the Yarlung Zangbo River. Ten sites were sampled in the Yellow River source region, with Maduo (MD), Dari (DR), Mentang (MT), Maqu (MQ), Jungong (JG), Banduo (BD), and Tangnaihai (TNH) in the main channel and Requ (RQ), Jiuzhi (JZ), and Tangke (TK) in the tributary. There were two sampling sites in the Yangtze River source region, which were Qumalai (QML) and Banma (BM). Xiangda (XD) was sampled in the Mekong River source region. Two sites were sampled in the Salween River source region, Jiayuqiao (JYQ) and Zuogong (ZG), and Zangmu03 (ZM03), Zangmu04 (ZM04), Zangmu05 (ZM05), and Yangcun (YC) were sampled in the Yarlung Zangbo River.
FIG 2
FIG 2
Potential nitrification rates in the overlying water samples. Data represent the mean values ± standard deviations for three replicates.
FIG 3
FIG 3
amoA gene abundance of AOA and AOB (a) and Nitrospira comammox (b), as well as their respective proportions in the overlying water samples (c). An asterisk denotes that comammox amoA gene abundance was below the detection limit. AOA abundance (3.34 × 103 copies liter−1) in the JiuZhi station was slightly below the detection limit (3.70 × 103 copies liter−1). Moreover, in qPCR assays for this station, evident amplification was observed and there was no unspecific melt-curve peak. Therefore, 3.34 × 103 copies liter−1 could be accepted to represent its AOA abundance. Data represent the mean values ± SD for three replicates.
FIG 4
FIG 4
(a) Structural equation models (SEMs) showing the effects of environmental factors on ammonia oxidizer abundance in the overlying water samples. Blue and red arrows indicate significantly negative and positive relationships, respectively, while gray arrows denote insignificant relationships. Numbers close to arrows are path coefficients, and the arrow width is proportional to the strength of these coefficients. Significance levels are indicated: *, P < 0.05; **, P < 0.01; ***, P < 0.001. Percentages adjacent to variables refer to the variance accounted for by the model (R2). The final model showed a satisfactory fit to our data, with a model of χ2 = 16.7, df = 15, P = 0.34, GFI (goodness-of-fit index) = 0.89, and RMSEA (root mean square error of approximation) = 0.066. (b) The standardized total effects of each environmental factor involved in the SEM on the abundance of ammonia oxidizers.
FIG 5
FIG 5
Phylogenetic trees showing the affiliations of amoA gene sequences of AOA (a), AOB (b), and comammox Nitrospira (c) retrieved from the overlying water samples based on the 85% (AOA and AOB) and 95% (comammox) similarities. The tree was constructed with neighbor-joining methods using maximum composite likelihood with 1,000 bootstraps. The clone names are labeled with OTU number followed by the number of times this OTU was detected in the overlying water samples.
FIG 5
FIG 5
Phylogenetic trees showing the affiliations of amoA gene sequences of AOA (a), AOB (b), and comammox Nitrospira (c) retrieved from the overlying water samples based on the 85% (AOA and AOB) and 95% (comammox) similarities. The tree was constructed with neighbor-joining methods using maximum composite likelihood with 1,000 bootstraps. The clone names are labeled with OTU number followed by the number of times this OTU was detected in the overlying water samples.
FIG 6
FIG 6
PCoA plots of AOA (a) and AOB (b) community dissimilarities among sampling sites of five rivers in the QTP using the weighted UniFrac distance.
FIG 7
FIG 7
PCoA plots of AOA (a) and AOB (b) community dissimilarities among sampling sites of this study and other reference sites using the weighted UniFrac distance. Detailed information on these reference sequences is listed in Table S6.

References

    1. Stein LY. 2019. Insights into the physiology of ammonia-oxidizing microorganisms. Curr Opin Chem Biol 49:9–15. doi:10.1016/j.cbpa.2018.09.003. - DOI - PubMed
    1. Beaulieu JJ, Tank JL, Hamilton SK, Wollheim WM, Hall RO, Mulholland PJ, Peterson BJ, Ashkenas LR, Cooper LW, Dahm CN, Dodds WK, Grimm NB, Johnson SL, McDowell WH, Poole GC, Valett HM, Arango CP, Bernot MJ, Burgin AJ, Crenshaw CL, Helton AM, Johnson LT, O'Brien JM, Potter JD, Sheibley RW, Sobota DJ, Thomas SM. 2011. Nitrous oxide emission from denitrification in stream and river networks. Proc Natl Acad Sci USA 108:214–219. doi:10.1073/pnas.1011464108. - DOI - PMC - PubMed
    1. Martens-Habbena W, Berube PM, Urakawa H, de la Torre JR, Stahl DA. 2009. Ammonia oxidation kinetics determine niche separation of nitrifying Archaea and Bacteria. Nature 461:976. doi:10.1038/nature08465. - DOI - PubMed
    1. Stahl DA, de la Torre JR. 2012. Physiology and diversity of ammonia-oxidizing archaea. Annu Rev Microbiol 66:83–101. doi:10.1146/annurev-micro-092611-150128. - DOI - PubMed
    1. Erguder TH, Boon N, Wittebolle L, Marzorati M, Verstraete W. 2009. Environmental factors shaping the ecological niches of ammonia-oxidizing archaea. FEMS Microbiol Rev 33:855–869. doi:10.1111/j.1574-6976.2009.00179.x. - DOI - PubMed

Publication types

LinkOut - more resources