. 2019 Oct 17;146(20):dev179093.
doi: 10.1242/dev.179093.

A novel self-organizing embryonic stem cell system reveals signaling logic underlying the patterning of human ectoderm

Affiliations

A novel self-organizing embryonic stem cell system reveals signaling logic underlying the patterning of human ectoderm

George Britton et al. Development. .

Abstract

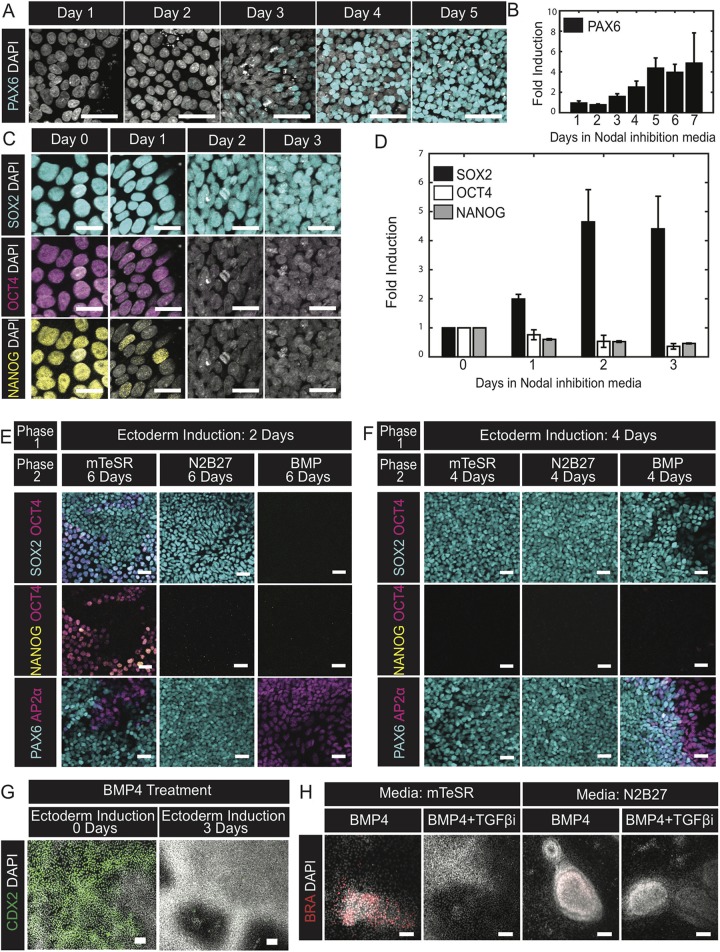
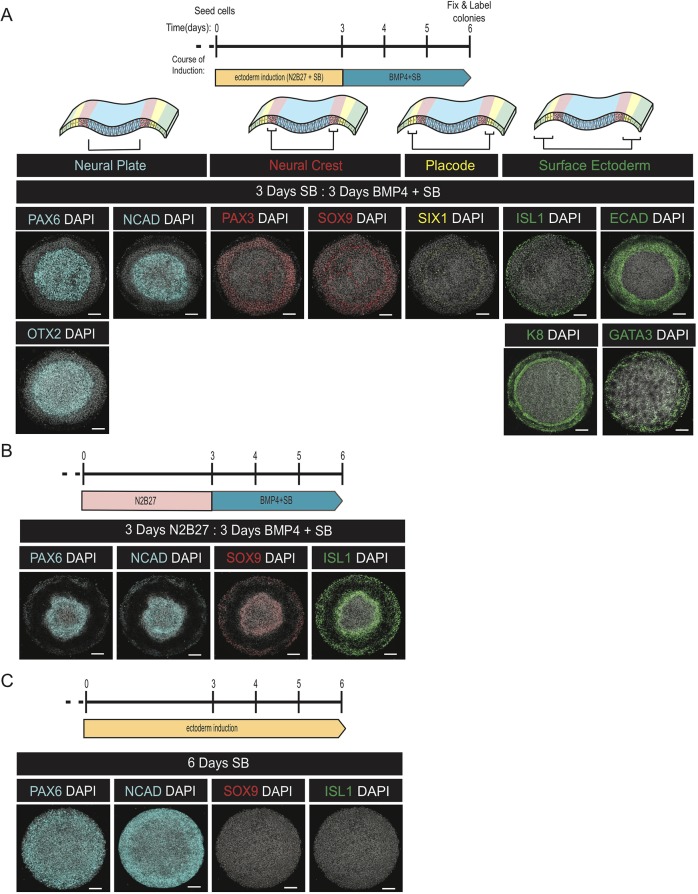
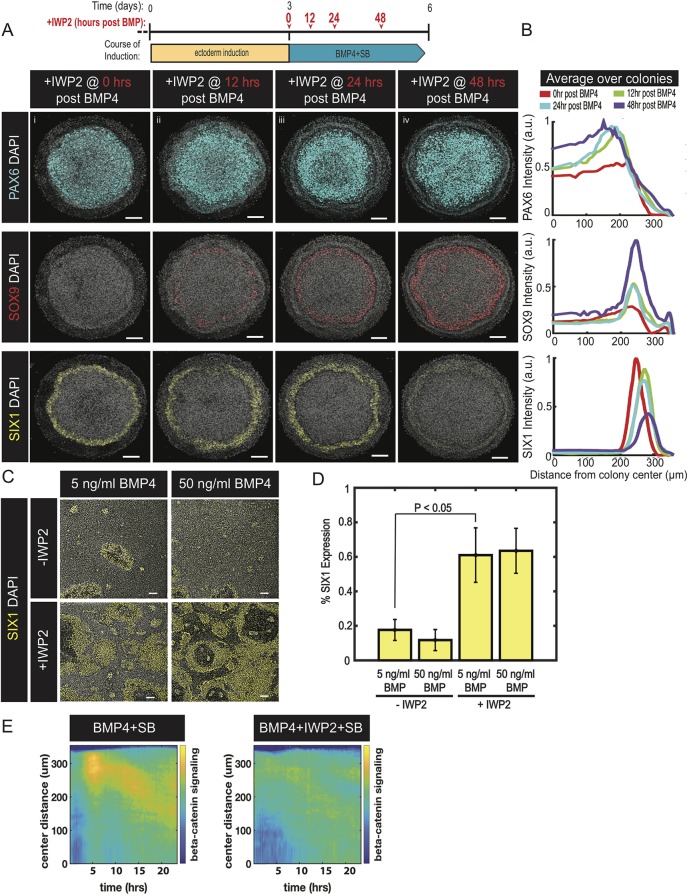
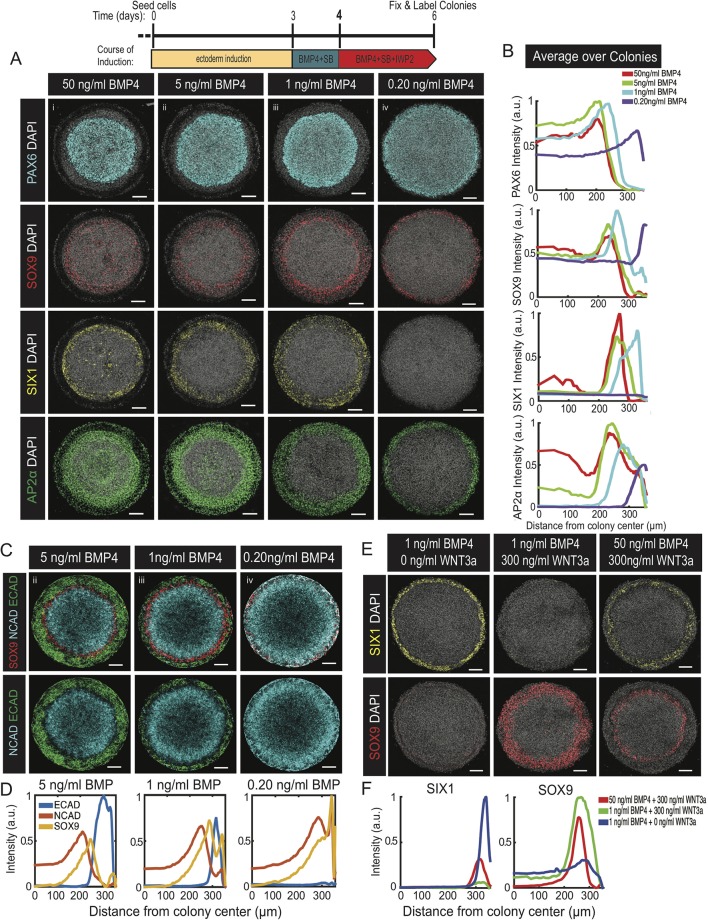
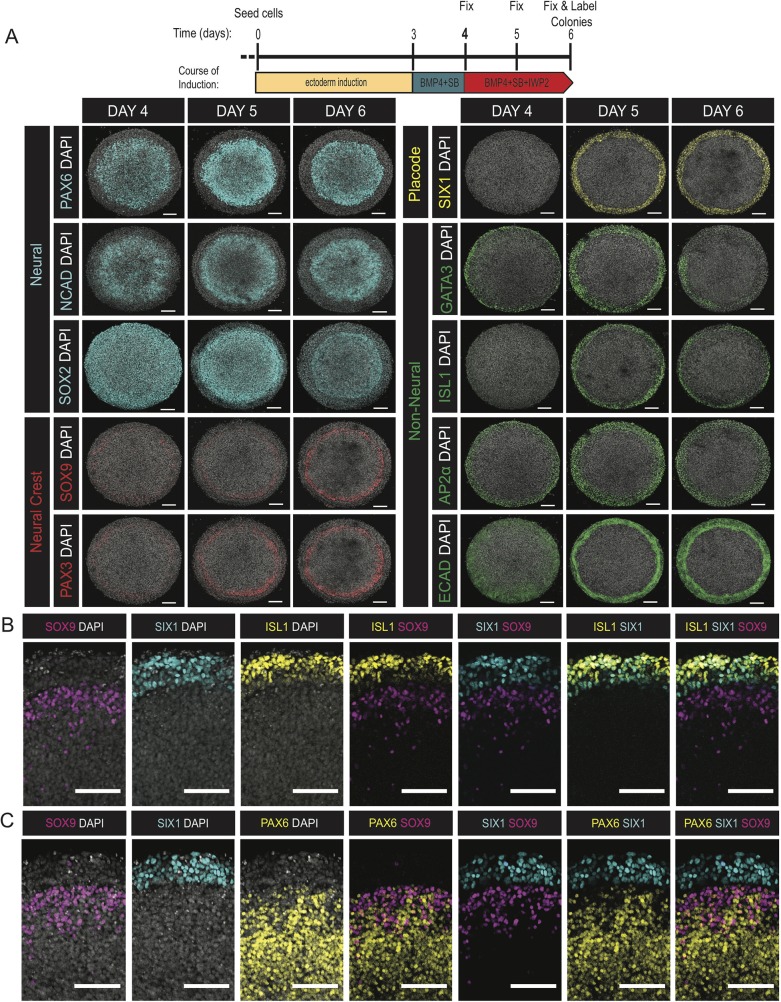
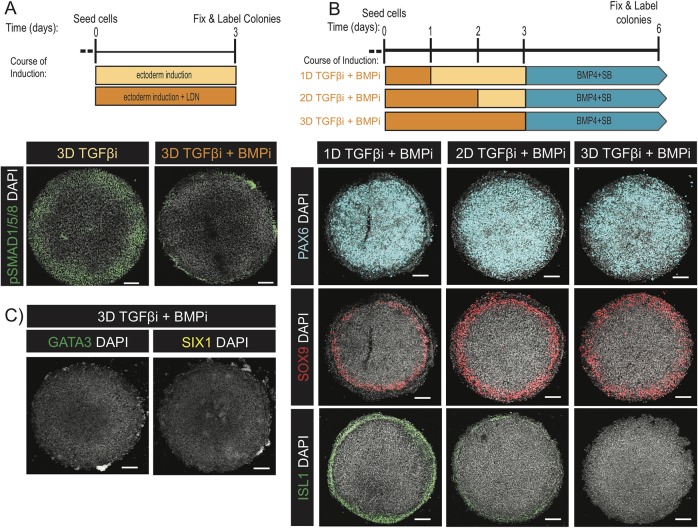
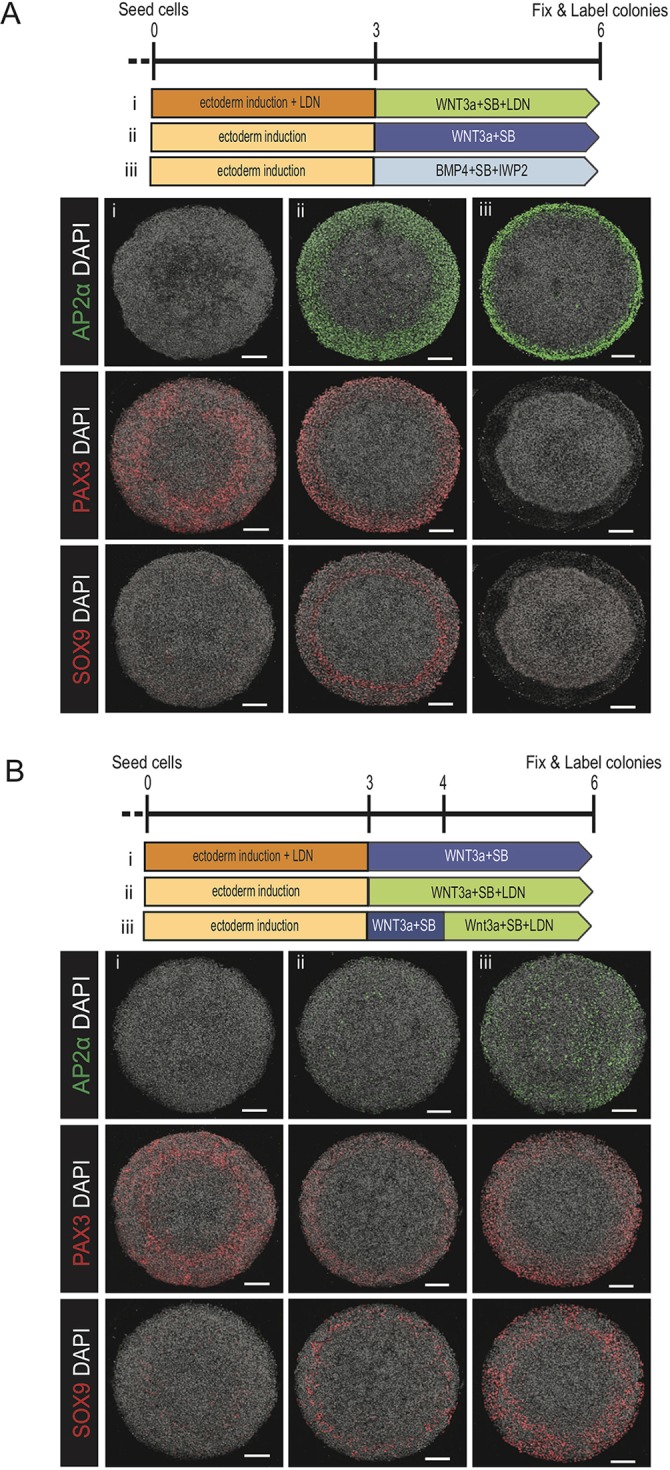
During development, the ectoderm is patterned by a combination of BMP and WNT signaling. Research in model organisms has provided substantial insight into this process; however, there are currently no systems in which to study ectodermal patterning in humans. Further, the complexity of neural plate border specification has made it difficult to transition from discovering the genes involved to deeper mechanistic understanding. Here, we develop an in vitro model of human ectodermal patterning, in which human embryonic stem cells self-organize to form robust and quantitatively reproducible patterns corresponding to the complete medial-lateral axis of the embryonic ectoderm. Using this platform, we show that the duration of endogenous WNT signaling is a crucial control parameter, and that cells sense relative levels of BMP and WNT signaling in making fate decisions. These insights allowed us to develop an improved protocol for placodal differentiation. Thus, our platform is a powerful tool for studying human ectoderm patterning and for improving directed differentiation protocols.This article has an associated 'The people behind the papers' interview.

Keywords: BMP signaling; Ectoderm development; Human embryonic stem cells; Self-organization; WNT signaling.


Conflict of interest statement

Competing interestsThe authors declare no competing or financial interests.

Figures

Fig. 1.
Fig. 1.
During neural differentiation cells transition through an ectodermal progenitor state before commitment. (A,C) Representative images of cells fixed on the indicated days during the course of Nodal inhibition and immunostained for the neural progenitor marker PAX6 (A) or the pluripotent markers SOX2, OCT4 and NANOG (C). (B,D) Quantification of the fold change in average intensities of PAX6 (B) or SOX2, OCT4 and NANOG (D) normalized to DAPI for the indicated days relative to day 0. N=3 experiments. (E,F) Representative images of cells immunofluorescently co-stained for AP2α/PAX6 or SOX2/NANOG/OCT4 at the conclusion of a two-phase induction protocol. Cells were initially differentiated in Nodal inhibition media for either 2 (E) or 4 (F) days and then treated with the indicated culture conditions for the subsequent 6 (E) or 4 (F) days. Experiment replicated three times. (G) Representative images of cells immunofluorescently labeled for CDX2. All cells were treated with BMP4 for 2 days following either no prior treatment or 3 days of Nodal inhibition. Experiment replicated three times. (H) Representative images of cells immunofluorescently labeled for BRA at the conclusion of the experiment. All cells were initially induced for 3 days in Nodal inhibition media. Thereafter, the media was exchanged for treatment conditions indicated in the banner above the corresponding images. First row banners indicate the base media and the second banner row indicates the signals added to the base media. Experiment replicated three times. TGFβi, SB431542. Data are mean±s.e.m. Scale bars: 25 µm (C); 50 µm (A,E,F); 100 µm (G,H).
Fig. 2.
Fig. 2.
A two-phase protocol generates self-organized patterns of ectodermal fates. (A-C) Representative images of colonies stained with the indicated antibodies following treatment with either a two-step protocol consisting of 3 days in ectoderm induction media and 3 days in N2B27+BMP+SB (A), the same protocol except the first 3 days were in N2B27 alone (B), or 6 days of ectoderm induction media (C). The top row in (A) shows a schematic of the organization of fates in the anterior ectoderm. Each experiment was replicated at least three times. Scale bars: 100 μm.
Fig. 3.
Fig. 3.
Endogenous WNT ligands drive differentiation to neural crest at the expense of placodal fates. (A) Representative images of colonies immunostained for PAX6, SOX9 or SIX1. Colonies were initially induced for 3 days in ectoderm induction media and then subsequently differentiated for 3 days in N2B27 media containing BMP4 and SB. The time between BMP4 and IWP2 addition is indicated in the induction schematic and linked in red with the banner above the corresponding image. Experiment replicated four times. (B) Quantification of the images in A represented as average nuclear intensities of the indicated markers normalized to DAPI as a function of radial position. N=3 colonies. (C) Representative images of cells in standard culture immunostained for SIX1. Cells were initially induced for 3 days in ectoderm induction media and then treated with either 5 or 50 ng/ml of BMP4 in media with (+) or without (−) IWP2 for the subsequent 3 days. (D) Fraction of cells expressing SIX1. N=3 experiments; P=0.011 (two-sided t-test). Data are mean±s.e.m. (E) Kymograph of β-catenin signaling activity over a 24-h period (on day 4) in micropatterned colonies initially treated in Nodal inhibition media for 3 days and then with the indicated signaling conditions. N=4 colonies and repeated twice. Colony diameter in A: 700 µm. Scale bars: 100 µm.
Fig. 4.
Fig. 4.
Cell fates are determined from the relative levels of BMP4 and WNT3a. (A,C) Representative images of colonies with the indicated single (A) or multiplexed (C) immunolabels following a three-step ectoderm induction protocol and patterned with (i) 50 ng/ml BMP4, (ii) 5 ng/ml BMP4, (iii) 1 ng/ml BMP4 or (iv) 0.20 ng/ml BMP4 in N2B27 media with SB. Experiment replicated three times. (B,D) Quantifications of images in A (B) and C (D) represented as the average nuclear intensities of the indicated markers normalized to DAPI as a function of radial position. N=3 colonies. (E) Representative images of colonies immunostained for SOX9 or SIX1. Cells were initially differentiated in ectoderm induction media for 3 days and subsequently induced in media containing IWP2 with the indicated levels of BMP4 and WNT3a in the overhead banner. Experiment replicated twice. (F) Quantification of images in E represent the intensities of the indicated markers normalized to DAPI as a function of distance from the colony center. N=3 colonies. Colony diameter: 700 µm. Scale bars: 100 µm.
Fig. 5.
Fig. 5.
Spatiotemporal characterization of human ectoderm pattern emergence. (A-C) Representative images of colonies fixed on the indicated days (A), or day 6 of induction (B,C), and immunostained with the indicated antibodies. Colonies were differentiated using a three-step ectoderm induction protocol and patterned with 1 ng/ml BMP4. Experiment replicated twice. Colony diameter: 700 µm. Scale bars: 100 µm.
Fig. 6.
Fig. 6.
Endogenous BMP signaling prior to BMP4 treatment is required for surface ectodermal differentiation. (A-C) Representative images of colonies immunostained for the indicated antibodies on day 3 following induction in media containing SB only or in combination with LDN (A), and on day 6 following 1, 2 or 3 days of SB+LDN treatment in the first phase of induction prior to BMP4 treatment for 3 days. Conditions that removed dual inhibition before day 3 had media replaced with N2B27+SB such that all conditions were in culture for the same duration prior to the introduction of BMP4 (B). Experiments were repeated three (A) and four (B) times. Colony diameter: 800 µm (A); 700 µm (B). Scale bars: 100 µm.
Fig. 7.
Fig. 7.
Dissecting the logic connecting BMP and WNT signaling to the transcription factors AP2a, PAX3 and SOX9. (A,B) Representative images of colonies immunostained for AP2α, PAX3 or SOX9. The induction schematic indicates the signaling conditions over the course of the experiment. In A: (i) 3 days SB+LDN followed by 3 days WNT3a+SB+LDN; (ii) 3 days SB followed by 3 days WNT3a+SB; (iii) 3 days SB followed by 3 days BMP4+SB+IWP2. In B: (i) 3 days SB+LDN followed by 3 days WNT3a+SB; (ii) 3 days SB followed by 3 days WNT3a+SB+LDN; (iii) 3 days SB followed by 1 day WNT3a+SB then 2 days WNT3a+LDN+SB. Each experiment was replicated three times. Colony diameter: 700 µm. Scale bars: 100 µm.

Similar articles

Cited by

References

    1. Ahrens K. and Schlosser G. (2005). Tissues and signals involved in the induction of placodal Six1 expression in Xenopus laevis. Dev. Biol. 288, 40-59. 10.1016/j.ydbio.2005.07.022 - DOI - PubMed
    1. Arnold S. J. and Robertson E. J. (2009). Making a commitment: cell lineage allocation and axis patterning in the early mouse embryo. Nat. Rev. Mol. Cell Biol. 10, 91-103. 10.1038/nrm2618 - DOI - PubMed
    1. Bae C.-J., Park B.-Y., Lee Y.-H., Tobias J. W., Hong C.-S. and Saint-Jeannet J.-P. (2014). Identification of Pax3 and Zic1 targets in the developing neural crest. Dev. Biol. 386, 473-483. 10.1016/j.ydbio.2013.12.011 - DOI - PMC - PubMed
    1. Barry C., Schmitz M. T., Jiang P., Schwartz M. P., Duffin B. M., Swanson S., Bacher R., Bolin J. M., Elwell A. L., McIntosh B. E. et al. (2017). Species-specific developmental timing is maintained by pluripotent stem cells ex utero. Dev. Biol. 423, 101-110. 10.1016/j.ydbio.2017.02.002 - DOI - PMC - PubMed
    1. Benham-Pyle B. W., Pruitt B. L. and Nelson W. J. (2015). Cell adhesion. Mechanical strain induces E-cadherin-dependent Yap1 and β-catenin activation to drive cell cycle entry. Science 348, 1024-1027. 10.1126/science.aaa4559 - DOI - PMC - PubMed

Publication types